Another Word For It Patrick Durusau on Topic Maps and Semantic Diversity

October 25, 2014

Wastebook 2014

Filed under: Government,Politics — Patrick Durusau @ 6:42 pm

Wastebook 2014: What Washington doesn’t want you to read. (Voodoo Dolls, Gambling Monkeys, Zombies in Love and Paid Vacations for Misbehaving Bureaucrats Top List of the Most Outlandish Government Spending in Wastebook 2014)

From the webpage:

Gambling monkeys, dancing zombies and mountain lions on treadmills are just a few projects exposed in Wastebook 2014 – highlighting $25 billion in Washington’s worst spending of the year.

Wastebook 2014 — the report Washington doesn’t want you to read —reveals the 100 most outlandish government expenditures this year, costing taxpayers billions of dollars.

“With no one watching over the vast bureaucracy, the problem is not just what Washington isn’t doing, but what it is doing.” Dr. Coburn said. “Only someone with too much of someone else’s money and not enough accountability for how it was being spent could come up some of these projects.”

“I have learned from these experiences that Washington will never change itself. But even if the politicians won’t stop stupid spending, taxpayers always have the last word.”

Congress actually forced federal agencies to waste billions of dollars for purely parochial, political purposes.

For example, lawmakers attached a rider to a larger bill requiring NASA to build a $350 million launch pad tower, which was mothballed as soon as it was completed because the rockets it was designed to test were scrapped years ago. Similarly, when USDA attempted to close an unneeded sheep research station costing nearly $2 million every year to operate, politicians in the region stepped in to keep it open.

Examples of wasteful spending highlighted in “Wastebook 2014” include:

  • Coast guard party patrols – $100,000
  • Watching grass grow – $10,000
  • State department tweets @ terrorists – $3 million
  • Swedish massages for rabbits – $387,000
  • Paid vacations for bureaucrats gone wild – $20 million
  • Mountain lions on a treadmill – $856,000
  • Synchronized swimming for sea monkeys – $50,000
  • Pentagon to destroy $16 billion in unused ammunition — $1 billion
  • Scientists hope monkey gambling unlocks secrets of free will –$171,000
  • Rich and famous rent out their luxury pads tax free – $10 million
  • Studying “hangry” spouses stabbing voodoo dolls – $331,000
  • Promoting U.S. culture around the globe with nose flutists – $90 million

Read the full report here.

Watch the Wastebook 2014 videos here and here and here

Wastebook 2014 runs a total of one hundred and ten (110) pages and has 1137 footnotes (with references to data analysis in many cases). It occurs to me to ask if the lavish graphics, design and research were donated by volunteers or perhaps this was the work of paid staff of Sen. Coburn?

The other question to ask is what definition of “waste” is Sen. Coburn using?

I suspect the people who were paid monthly salaries for any of the listed projects would disagree their salaries were “waste.” A sentiment that would be echoed by their landlords, car dealers, grocery stores, etc.

It might be cheaper to simply pay all those staffer and not buy equipment and materials for their projects, but that would have an adverse impact on the vendors for those products and their staffs, who likewise have homes, cars, and participate in their local economies.

Not that governments are the sole offenders when it comes to waste but they are easy targets since unlike most corporations, more information is public about their internal operations.

The useful question that topic maps could play a role in on questions of “waste” would be to track the associations of people involved in a project to all the other participants in the local economy. I think you will find that the economic damage of cutting some “waste” is far higher than the cost of continuing the “waste.”

Such a project would give you the data on which to make principled arguments to distinguish between waste with little local impact and waste with a large local impact.

I first saw this at Full Text Reports as: Wastebook 2014: What Washington doesn’t want you to read.

Data Visualization with JavaScript

Filed under: Javascript,Visualization — Patrick Durusau @ 6:08 pm

Data Visualization with JavaScript by Stephen A. Thomas.

From the introduction:

It’s getting hard to ignore the importance of data in our lives. Data is critical to the largest social organizations in human history. It can affect even the least consequential of our everyday decisions. And its collection has widespread geopolitical implications. Yet it also seems to be getting easier to ignore the data itself. One estimate suggests that 99.5% of the data our systems collect goes to waste. No one ever analyzes it effectively.

Data visualization is a tool that addresses this gap.

Effective visualizations clarify; they transform collections of abstract artifacts (otherwise known as numbers) into shapes and forms that viewers quickly grasp and understand. The best visualizations, in fact, impart this understanding subconsciously. Viewers comprehend the data immediately—without thinking. Such presentations free the viewer to more fully consider the implications of the data: the stories it tells, the insights it reveals, or even the warnings it offers. That, of course, defines the best kind of communication.

If you’re developing web sites or web applications today, there’s a good chance you have data to communicate, and that data may be begging for a good visualization. But how do you know what kind of visualization is appropriate? And, even more importantly, how do you actually create one? Answers to those very questions are the core of this book. In the chapters that follow, we explore dozens of different visualizations and visualization techniques and tool kits. Each example discusses the appropriateness of the visualization (and suggests possible alternatives) and provides step-by-step instructions for including the visualization in your own web pages.

To give you a better idea of what to expect from the book, here’s a quick description of what the book is, and what it is not.

The book is a sub-part of http://jsdatav.is/ where Stephen maintains his blog, listing of talks and a link to his twitter account.

If you are interested in data visualization with JavaScript, this should be on a short list of bookmarks.

Building Scalable Search from Scratch with ElasticSearch

Filed under: ElasticSearch,Search Engines — Patrick Durusau @ 5:46 pm

Building Scalable Search from Scratch with ElasticSearch by Ram Viswanadha.

From the post:

1 Introduction

Savvy is an online community for the world’s product enthusiasts. Our communities are the product trendsetters that the rest of the world follows. Across the site, our users are able to compare products, ask and answer product questions, share product reviews, and generally share their product interests with one another. Savvy1.com boasts a vibrant community that save products on the site at the rate of 1 product every second. We wanted to provide a search bar that can search across various entities in the system – users, products, coupons, collections, etc. – and return the results in a timely fashion.

2 Requirements

The search server should satisfy the following requirements:

  1. Full Text Search: The ability to not only return documents that contain the exact keywords, but also documents that contain words that are related or relevant to the keywords.
  2. Clustering: The ability to distribute data across multiple nodes for load balancing and efficient searching.
  3. Horizontal Scalability: The ability to increase the capacity of the cluster by adding more nodes.
  4. Read and Write Efficiency: Since our application is both read and write heavy, we need a system that allows for high write loads and efficient read times on heavy read loads.
  5. Fault Tolerant: The loss of any node in the cluster should not affect the stability of the cluster.
  6. REST API with JSON: The server should support a REST API using JSON for input and output.

At the time, we looked at Sphinx, Solr and ElasticSearch. The only system that satisfied all of the above requirements was ElasticSearch, and — to sweeten the deal — ElasticSearch provided a way to efficiently ingest and index data in our MongoDB database via the River API so we could get up and running quickly.

If you need an outline for building a basic ElasticSearch system, this is it!

It has the advantage of introducing you to a number of other web technologies that will be handy with ElasticSearch.

Enjoy!

Overview App API

Filed under: News,Reporting — Patrick Durusau @ 3:30 pm

Overview App API

From the webpage:

An Overview App is a program that uses Overview.

You can make one. You know you want to.

Using Overview’s App API you can drive Overview’s document handling engine from your own code, create new visualizations that replace Overview’s default Topic Tree, or write interactive document handling or data extraction apps.

If you don’t remember the Overview Project:

Overview is just what you need to search, analyze and cull huge volumes of text or documents. It was built for investigative journalists who go through thousands of pages of material, but it’s also used by reasearchers facing huge archives and social media analysts with millions of posts. With advanced search and interactive topic modeling, you can:

  • find what you didn’t even know to look for
  • quickly tag or code documents
  • let the computer organize your documents by topic, automatically

Leveraging the capabilities in Overview is a better use of resources than re-inventing basic file and search capabilities.

Understanding Information Retrieval by Using Apache Lucene and Tika

Filed under: Information Retrieval,Lucene,Tika — Patrick Durusau @ 3:15 pm

Understanding Information Retrieval by Using Apache Lucene and Tika, Part 1

Understanding Information Retrieval by Using Apache Lucene and Tika, Part 2

Understanding Information Retrieval by Using Apache Lucene and Tika, Part 3

by Ana-maria Mihalceanu.

From part 1:

In this tutorial, the Apache Lucene and Apache Tika frameworks will  be explained through their core concepts (e.g.  parsing, mime detection,  content analysis, indexing,  scoring, boosting) via illustrative examples that should be applicable to not only seasoned software developers but to beginners to content analysis and programming as well. We assume you have a working knowledge of the Java™ programming language and plenty of content to analyze.

Throughout this tutorial, you will learn:

  • how to use Apache Tika’s API and its most relevant functions
  • how to develop code with Apache Lucene API and its most important modules
  • how to integrate Apache Lucene and Apache Tika in order to build your own piece of software that stores and retrieves information efficiently. (project code is available for download)

Part 1 introduces you to Apache Lucene and Apache Tika and concludes by covering automatic extraction of metadata from files with Apache Tika.

Part 2 covers extracting/indexing of content, along with stemming, boosting and scoring. (If any of that sounds unfamiliar, this isn’t the best tutorial for you.)

Part 3 details the highlighting of fragments when they match a search query.

A good tutorial on Apache Lucene and Apache Tika, what parts of them are covered, but there was no coverage of information retrieval. For example, part 3 talks about increasing search “efficiency” without any consideration of what “efficiency” might mean in a particular search context.

Illuminating issues in information retrieval using Apache Lucene and Tika as opposed to coding up an indexing/searching application with no discussion of the potential choices and tradeoffs would make a much better tutorial.

An interactive visualization to teach about the curse of dimensionality

Filed under: Dimension Reduction,Dimensions,Visualization — Patrick Durusau @ 2:36 pm

An interactive visualization to teach about the curse of dimensionality by Jeff Leek.

From the post:

I recently was contacted for an interview about the curse of dimensionality. During the course of the conversation, I realized how hard it is to explain the curse to a general audience. One of the best descriptions I could come up with was trying to describe sampling from a unit line, square, cube, etc. and taking samples with side length fixed. You would capture fewer and fewer points. As I was saying this, I realized it is a pretty bad way to explain the curse of dimensionality in words. But there was potentially a cool data visualization that would illustrate the idea. I went to my student Prasad, our resident interactive viz design expert to see if he could build it for me. He came up with this cool Shiny app where you can simulate a number of points (n) and then fix a side length for 1-D, 2-D, 3-D, and 4-D and see how many points you capture in a cube of that length in that dimension. You can find the full app here or check it out on the blog here:

An excellent visualization of the “curse of dimensionality!”

The full app will take several seconds to redraw the screen when the length of the edge gets to .5 and above (or at least that was my experience).

The 2014 Social Media Glossary: 154 Essential Definitions

Filed under: Glossary,Social Media — Patrick Durusau @ 1:20 pm

The 2014 Social Media Glossary: 154 Essential Definitions by Matt Foulger.

From the post:

Welcome to the 2014 edition of the Hootsuite Social Media Glossary. This is a living document that will continue to grow as we add more terms and expand our definitions. If there’s a term you would like to see added, let us know in the comments!

I searched but did not find an earlier version of this glossary on the Hootsuite blog. I have posted a comment asking for pointers to the earlier version(s).

In the meantime, you may want to compare: The Ultimate Glossary: 120 Social Media Marketing Terms Explained by Kipp Bodnar. From 2011 but if you don’t know the terms, even a 2011 posting may be helpful.

We all accept the notion that language evolves but within domains that evolution is gradual and as thinking in that domain shifts, making it harder for domain members to see it.

Tracking a rapidly changing vocabulary, such as the one used in social media, might be more apparent.

The Anatomy of a Large-Scale Hypertextual Web Search Engine (Ambiguity)

Filed under: Search Engines,WWW — Patrick Durusau @ 12:26 pm

If you search for “The Anatomy of a Large-Scale Hypertextual Web Search Engine” by Sergey Brin and Lawrence Page, will you get the “long” version or the “short” version?

The version found at: http://infolab.stanford.edu/pub/papers/google.pdf reports in its introduction:

(Note: There are two versions of this paper — a longer full version and a shorter printed version. The full version is available on the web and the conference CD-ROM.)

However, it doesn’t say whether it is the “longer full version” or the “shorter printed version.” Length, twenty (20) pages.

The version found at: http://snap.stanford.edu/class/cs224w-readings/Brin98Anatomy.pdf claims the following citation: “Computer Networks and ISDN Systems 30 (1998) 107-117.” Length, eleven (11) pages. It “looks” like a journal printed article.

Ironic that the search engine fails to distinguish between these two versions of such an important paper.

Perhaps the search confusion is justified to some degree because Lawrence Page’s publications at: http://research.google.com/pubs/LawrencePage.html reports:

Lawrence Page pub info

But if you access the PDF, you get the twenty (20) page version, not the eleven page version published at: Computer Networks and ISDN Systems 30 (1998) 107-117.

BTW, if you want to automatically distinguish the files, the file sizes on the two versions referenced above are: 123603 (the twenty (20) page version) and 1492735 (the eleven (11) page version). (The published version has the publisher logo, etc. that boosts the file size.)

If Google had a mechanism to accept explicit crowd input, that confusion and the typical confusion between slides and papers with the same name could be easily solved.

The first reader who finds either the paper or slides, types it as paper or slides. The characteristics of that file become the basis for distinguishing those files into paper or slides. When the next searcher is returned results including those files, they get a pointer to paper or slides?

If they don’t submit a change for paper or slides, that distinction becomes more certain.

I don’t know what the carrot would be for typing resources returned in search results, perhaps five (5) minutes of freedom from ads! 😉

Thoughts?

I first saw this in a tweet by onepaperperday.

October 24, 2014

This Is Watson

Filed under: Artificial Intelligence — Patrick Durusau @ 7:08 pm

This is Watson (IBM Journal of Research and Development, Volume 56, Issue: 3.4, 2012)

The entire issue of IBM Journal of Research and Development, Volume 56, Issue: 3.4 as PDF files.

From the table of contents:

This Is Watson

In 2007, IBM Research took on the grand challenge of building a computer system that could compete with champions at the game of Jeopardy!. In 2011, the open-domain question-answering system dubbed Watson beat the two highest ranked players in a nationally televised two-game Jeopardy! match. This special issue provides a deep technical overview of the ideas and accomplishments that positioned our team to take on the Jeopardy! challenge, build Watson, and ultimately triumph. It describes the nature of the question-answering challenge represented by Jeopardy! and details our technical approach. The papers herein describe and provide experimental results for many of the algorithmic techniques developed as part of the Watson system, covering areas including computational linguistics, information retrieval, knowledge representation and reasoning, and machine leaning. The papers offer component-level evaluations as well as their end-to-end contribution to Watson’s overall question-answering performance.

1 Introduction to “This is Watson”
D. A. Ferrucci

2 Question analysis: How Watson reads a clue
A. Lally, J. M. Prager, M. C. McCord, B. K. Boguraev, S. Patwardhan, J. Fan, P. Fodor, and J. Chu-Carroll

3 Deep parsing in Watson
M. C. McCord, J. W. Murdock, and B. K. Boguraev

4 Textual resource acquisition and engineering
J. Chu-Carroll, J. Fan, N. Schlaefer, and W. Zadrozny

5 Automatic knowledge extraction from documents
J. Fan, A. Kalyanpur, D. C. Gondek, and D. A. Ferrucci

6 Finding needles in the haystack: Search and candidate generation
J. Chu-Carroll, J. Fan, B. K. Boguraev, D. Carmel, D. Sheinwald, and C. Welty

7 Typing candidate answers using type coercion
J. W. Murdock, A. Kalyanpur, C. Welty, J. Fan, D. A. Ferrucci, D. C. Gondek, L. Zhang, and H. Kanayama

8 Textual evidence gathering and analysis
J. W. Murdock, J. Fan, A. Lally, H. Shima, and B. K. Boguraev

9 Relation extraction and scoring in DeepQA
C. Wang, A. Kalyanpur, J. Fan, B. K. Boguraev, and D. C. Gondek

10 Structured data and inference in DeepQA
A. Kalyanpur, B. K. Boguraev, S. Patwardhan, J. W. Murdock, A. Lally, C. Welty, J. M. Prager, B. Coppola, A. Fokoue-Nkoutche, L. Zhang, Y. Pan, and Z. M. Qiu

11 Special Questions and techniques
J. M. Prager, E. W. Brown, and J. Chu-Carroll

12 Identifying implicit relationships
J. Chu-Carroll, E. W. Brown, A. Lally, and J. W. Murdock

13 Fact-based question decomposition in DeepQA
A. Kalyanpur, S. Patwardhan, B. K. Boguraev, A. Lally, and J. Chu-Carroll

14 A framework for merging and ranking of answers in DeepQA
D. C. Gondek, A. Lally, A. Kalyanpur, J. W. Murdock, P. A. Duboue, L. Zhang, Y. Pan, Z. M. Qiu, and C. Welty

15 Making Watson fast
E. A. Epstein, M. I. Schor, B. S. Iyer, A. Lally, E. W. Brown, and J. Cwiklik

16 Simulation, learning, and optimization techniques in Watson’s game strategies
G. Tesauro, D. C. Gondek, J. Lenchner, J. Fan, and J. M. Prager

17 In the game: The interface between Watson and Jeopardy!
B. L. Lewis

Whatever your views on AI, Watson is truly impressive computer science.

Enjoy!

I first saw this in a tweet by Christopher Phipps.

Data Science Challenge 3

Filed under: Challenges,Contest,Data Science — Patrick Durusau @ 6:39 pm

Data Science Challenge 3

From the post:

Challenge Period

The Fall 2014 Data Science Challenge runs October 11, 2014 through January 21, 2015.

Challenge Prerequisite

You must pass Data Science Essentials (DS-200) prior to registering for the Challenge.

Challenge Description

The Fall 2014 Data Science Challenge incorporates three independent problems derived from real-world scenarios and data sets. Each problem has its own data, can be solved independently, and should take you no longer than eight hours to complete. The Fall 2014 Challenge includes problems dealing with online travel services, digital advertising, and social networks.

Problem 1: SmartFly
You have been contacted by a new online travel service called SmartFly. SmartFly provides its customers with timely travel information and notifications about flights, hotels, destination weather, and airport traffic, with the goal of making your travel experience smoother. SmartFly’s product team has come up with the idea of using the flight data that it has been collecting to predict whether customers’ flights will be delayed in order to respond proactively. The team has now contacted you to help test out the viability of the idea. You will be given SmartFly’s data set from January 1 to September 30, 2014 and be asked to return a list of of upcoming flights sorted from the most likely to the least likely to be delayed.

Problem 2: Almost Famous
Congratulations! You have just published your first book on data science, advanced analytics, and predictive modeling. You’ve also decided to use your skills as a data scientist to build and optimize a website that promotes your book, and you have started several ad campaigns on a popular search engine in order to drive traffic to your site. Using your skills in data munging and statistical analysis, you will be asked to evaluate the performance of a series of campaigns directed towards site visitors using the log data in Hadoop as your source of truth.

Problem 3: WINKLR
WINKLR is a curiously popular social network for fans of the 1970s sitcom Happy Days. Users can post photos, write messages, and, most importantly, follow each other’s posts. This helps members keep up with new content from their favorite users. To help its users discover new people to follow on the site, WINKLR is building a new machine learning system called The Fonz to predict who a given user might like to follow. Phase One of The Fonz project is underway. The engineers can export the entire user graph as tuples. You have joined the Fonz project to implement Phase Two, which improves on this result. Given the user graph and the list of frequent-click tuples, you are being asked to select a 70,000 tuple subset in “user1,user2” format, where you believe user1 is mostly likely to want to follow user2. These will result in emails to the users, inviting them to follow the recommended user.

Prize for success: CCP: Data Scientist status

Great way to start 2015!

I first saw this in a tweet by Sarah.

The Pretence of Knowledge

Filed under: Knowledge,Knowledge Engineering,Semantics — Patrick Durusau @ 5:48 pm

The Pretence of Knowledge by Friedrich August von Hayek. (Nobel Prize Lecture in Economics, December 11, 1974)

From the lecture:

The particular occasion of this lecture, combined with the chief practical problem which economists have to face today, have made the choice of its topic almost inevitable. On the one hand the still recent establishment of the Nobel Memorial Prize in Economic Science marks a significant step in the process by which, in the opinion of the general public, economics has been conceded some of the dignity and prestige of the physical sciences. On the other hand, the economists are at this moment called upon to say how to extricate the free world from the serious threat of accelerating inflation which, it must be admitted, has been brought about by policies which the majority of economists recommended and even urged governments to pursue. We have indeed at the moment little cause for pride: as a profession we have made a mess of things.

It seems to me that this failure of the economists to guide policy more successfully is closely connected with their propensity to imitate as closely as possible the procedures of the brilliantly successful physical sciences – an attempt which in our field may lead to outright error. It is an approach which has come to be described as the “scientistic” attitude – an attitude which, as I defined it some thirty years ago, “is decidedly unscientific in the true sense of the word, since it involves a mechanical and uncritical application of habits of thought to fields different from those in which they have been formed.”1 I want today to begin by explaining how some of the gravest errors of recent economic policy are a direct consequence of this scientistic error.

If you have some time for serious thinking over the weekend, visit or re-visit this lecture.

Substitute “computistic” for “scientistic” and capturing semantics as the goal.

Google and other search engines are overwhelming proof that some semantics can be captured by computers, but they are equally evidence of a semantic capture gap.

Any number of proposals exist to capture semantics, ontologies, Description Logic, RDF, OWL, but none are based on an empirical study how semantics originate, change and function in human society. Such proposals are snapshots of a small group’s understanding of semantics. Your mileage may vary.

Depending on your goals and circumstances, one or more proposal may be useful. But capturing and maintaining semantics without a basis in empirical study of semantics seems like a hit or miss proposition.

Or at least historical experience with capturing and maintaining semantics points in that direction.

I first saw this in a tweet by Chris Diehl

15 Tricks to Appear Smart in Emails

Filed under: Humor — Patrick Durusau @ 4:32 pm

15 Tricks to Appear Smart in Emails by Sarah Cooper.

From the post:

If you don’t care about appearing smart in emails, you can stop reading now.

Oh good, we’re alone.

In the corporate world, there is no ground more fertile for appearing smart than the rich earth that is electronic communication. Your email writing, sending and ignoring skills are just as important as your nodding skills, and even more important than your copying and pasting skills. Here are 15 email tricks that will make you appear smart, passionate, dedicated and most of all, smart.

Great illustrations to go along with the 15 tricks so see Sarah’s post.


Update: Is this beat up on email day? See: University administrator demands new email emphasis tool

Edinburgh. A University administrator has demanded a new tool with which to emphasize parts of e-mails, having exhausted traditional methods such as bold, italics, red text and flashing text.

“The simple fact is that people ignore my emails” said Ima Jobsworth, a senior administrator at the University of Berwick. “In the early days I used bold and italics to emphasize parts of the text, and people paid attention” he contnued. “But then they figured out that the bold and italicised sections were just as irrelevant to them as the rest of the email, perhaps even more so”.

Analysis of Named Entity Recognition and Linking for Tweets

Filed under: Entity Extraction,Entity Resolution,Named Entity Mining,Tweets — Patrick Durusau @ 4:12 pm

Analysis of Named Entity Recognition and Linking for Tweets by Leon Derczynski, et al.

Abstract:

Applying natural language processing for mining and intelligent information access to tweets (a form of microblog) is a challenging, emerging research area. Unlike carefully authored news text and other longer content, tweets pose a number of new challenges, due to their short, noisy, context-dependent, and dynamic nature. Information extraction from tweets is typically performed in a pipeline, comprising consecutive stages of language identi cation, tokenisation, part-of-speech tagging, named entity recognition and entity disambiguation (e.g. with respect to DBpedia). In this work, we describe a new Twitter entity disambiguation dataset, and conduct an empirical analysis of named entity recognition and disambiguation, investigating how robust a number of state-of-the-art systems are on such noisy texts, what the main sources of error are, and which problems should be further investigated to improve the state of the art.

A detailed review of existing solutions for mining tweets, where they fail along and why.

A comparison to spur tweet research:

Tweets Per Day > 500,000,000 Derczynski, p. 2
Annotated Tweets < 10,000 Derczynski, p. 27

Let’s see: 500,000,000 / 10,000 = 50,000.

The number of tweet per day is more than 50,000 times the number of tweets annotated with named entity types.

It may just be me but that sounds like the sort of statement you would see in a grant proposal to increase the number of annotated tweets.

Yes?

I first saw this in a tweet by Diana Maynard.

50 Face Recognition APIs

Filed under: Face Detection,Image Processing,Image Recognition,Image Understanding — Patrick Durusau @ 1:44 pm

50 Face Recognition APIs by Mirko Krivanek.

Interesting listing published on Mashape. Only the top 12 are listed below. It would be nice to have a separate blog for voice recognition APIs. I’ve been thinking at using voice rather than passport or driving license, as a more secure ID. The voice has a texture unique to each individual.

Subjects that are likely to be of interest!

Mirko mentions voice but then lists face recognition APIs.

Voice comes up in a mixture of APIs in: 37 Recognition APIS: AT&T SPEECH, Moodstocks and Rekognition by Matthew Scott.

I first saw this in a tweet by Andrea Mostosi

analyze survey data for free

Filed under: Public Data,R,Survey — Patrick Durusau @ 10:08 am

Anthony Damico has “unlocked” a number of public survey data sets with blog posts that detail how to analyze those sets with R.

Forty-six (46) data set are covered so far:

unlocked public-use data sets

An impressive donation of value to R and public data and an example that merits emulation! Pass this along.

I first saw this in a tweet by Sharon Machlis.

analyze the public libraries survey (pls) with r

Filed under: Library,R — Patrick Durusau @ 9:55 am

analyze the public libraries survey (pls) with r by Anthony Damico.

From the post:

each and every year, the institute of museum and library services coaxes librarians around the country to put down their handheld “shhhh…” sign and fill out a detailed online questionnaire about their central library, branch, even bookmobile. the public libraries survey (pls) is actually a census: nearly every public library in the nation responds annually. that microdata is waiting for you to check it out, no membership required. the american library association estimates well over one hundred thousand libraries in the country, but less than twenty thousand outlets are within the sample universe of this survey since most libraries in the nation are enveloped by some sort of school system. a census of only the libraries that are open to the general public, the pls typically hits response rates of 98% from the 50 states and dc. check that out.

A great way to practice your R skills!

Not to mention generating analysis to support your local library.

Strong Passwords – Myths of CS?

Filed under: Cybersecurity,Security — Patrick Durusau @ 9:44 am

Do we really need strong passwords? by Mark Stockley.

Mark reviews “An Administrator’s Guide to Internet Password Research” by Dinei Florêncio, Cormac Herley and Paul C. van Oorschot.

From the post:

The authors, Dinei Florêncio, Cormac Herley and Paul C. van Oorschot, contend that “much of the available guidance lacks supporting evidence” and so set out to examine the usefulness of (among other things) password composition policies, forced password expiration and password lockouts.

They also set out to determine just how strong a password used on a website needs to be to withstand a real-world attack.

Their conclusion is that creating strong passwords is wasted effort a lot of the time.

They suggest that organisations should invest their own resources in securing systems rather than simply offloading the cost to end users in the form of advice, demands or enforcement policies that are often pointless.

To understand their conclusions we need to look at the difference between online and offline attacks.

Don’t take the conclusion:

that creating strong passwords is wasted effort a lot of the time.

You need to read Mark’s post in full and/or the article to know when it is “a lot of the time.”

The abstract from the article:

The research literature on passwords is rich but little of it directly aids those charged with securing web-facing services or setting policies. With a view to improving this situation we examine questions of implementation choices, policy and administration using a combination of literature survey and first-principles reasoning to identify what works, what does not work, and what remains unknown. Some of our results are surprising. We find that offline attacks, the justification for great demands of user effort, occur in much more limited circumstances than is generally believed (and in only a minority of recently-reported breaches). We find that an enormous gap exists between the effort needed to withstand online and offline attacks, with probable safety occurring when a password can survive 106 and 1014 guesses respectively. In this gap, eight orders of magnitude wide, there is little return on user effort: exceeding the online threshold but falling short of the offline one represents wasted effort. We find that guessing resistance above the online threshold is also wasted at sites that store passwords in plaintext or reversibly encrypted: there is no attack scenario where the extra effort protects the account.

Empirical research is creating a new genre of mythology. Computer Science Mythology, coming to a bookstore near you.

October 23, 2014

Analyzing Schema.org

Filed under: Description Logic,OWL,RDF,Schema.org,Semantics — Patrick Durusau @ 8:20 pm

Analyzing Schema.org by Peter F. Patel-Schneider.

Abstract:

Schema.org is a way to add machine-understandable information to web pages that is processed by the major search engines to improve search performance. The definition of schema.org is provided as a set of web pages plus a partial mapping into RDF triples with unusual properties, and is incomplete in a number of places. This analysis of and formal semantics for schema.org provides a complete basis for a plausible version of what schema.org should be.

Peter’s analysis is summarized when he says:

The lack of a complete definition of schema.org limits the possibility of extracting the correct information from web pages that have schema.org markup.

Ah, yes, “…the correct information from web pages….”

I suspect the lack of semantic precision has powered the success of schema.org. Each user of schema.org markup has their private notion of the meaning of their use of the markup and there is no formal definition to disabuse them of that notion. Not that formal definitions were enough to save owl:sameAs from varying interpretations.

Schema.org empowers varying interpretations without requiring users to ignore OWL or description logic.

For the domains that schema.org covers, eateries, movies, bars, whore houses, etc., the semantic slippage permitted by schema.org lowers the bar to usage of its markup. Which has resulted in its adoption more widely than other proposals.

The lesson of schema.org is the degree of semantic slippage you can tolerate depends upon your domain. For pharmaceuticals, I would assume that degree of slippage is as close to zero as possible. For movie reviews, not so much.

Any effort to impose the same degree of semantic slippage across all domains is doomed to failure.

I first saw this in a tweet by Bob DuCharme.

Rich Citations: Open Data about the Network of Research

Filed under: Citation Practices,Open Data,PLOS — Patrick Durusau @ 7:13 pm

Rich Citations: Open Data about the Network of Research by Adam Becker.

From the post:

Why are citations just binary links? There’s a huge difference between the article you cite once in the introduction alongside 15 others, and the data set that you cite eight times in the methods and results sections, and once more in the conclusions for good measure. Yet both appear in the list of references with a single chunk of undifferentiated plain text, and they’re indistinguishable in citation databases — databases that are nearly all behind paywalls. So literature searches are needlessly difficult, and maps of that literature are incomplete.

To address this problem, we need a better form of academic reference. We need citations that carry detailed information about the citing paper, the cited object, and the relationship between the two. And these citations need to be in a format that both humans and computers can read, available under an open license for anyone to use.

This is exactly what we’ve done here at PLOS. We’ve developed an enriched format for citations, called, appropriately enough, rich citations. Rich citations carry a host of information about the citing and cited entities (A and B, respectively), including:

  • Bibliographic information about A and B, including the full list of authors, titles, dates of publication, journal and publisher information, and unique identifiers (e.g. DOIs) for both;
  • The sections and locations in A where a citation to B appears;
  • The license under which B appears;
  • The CrossMark status of B (updated, retracted, etc);
  • How many times B is cited within A, and the context in which it is cited;
  • Whether A and B share any authors (self-citation);
  • Any additional works cited by A at the same location as B (i.e. citation groupings);
  • The data types of A and B (e.g. journal article, book, code, etc.).

As a demonstration of the power of this new citation format, we’ve built a new overlay for PLOS papers, which displays much more information about the references in our papers, and also makes it easier to navigate and search through them. Try it yourself here: http://alpha.richcitations.org.
The suite of open-source tools we’ve built make it easy to extract and display rich citations for any PLOS paper. The rich citation API is available now for interested developers at http://api.richcitations.org.

If you look at one of the test articles such as: Jealousy in Dogs, the potential of rich citations becomes immediately obvious.

Perhaps I was reading “… the relationship between the two…” a bit too much like an association between two topics. It’s great to know how many times a particular cite occurs in a paper, when it is a self-citation, etc. but is a long way from attaching properties to an association between two papers.

On the up side, however, PLOS is already has 10,000 papers with “smart cites” with more on the way.

A project to watch!

Avoiding “Hive” Confusion

Filed under: BigData,Bioinformatics,Genomics,Hive — Patrick Durusau @ 6:46 pm

Depending on your community, when you hear “Hive,” you think “Apache Hive:”

The Apache Hive ™ data warehouse software facilitates querying and managing large datasets residing in distributed storage. Hive provides a mechanism to project structure onto this data and query the data using a SQL-like language called HiveQL. At the same time this language also allows traditional map/reduce programmers to plug in their custom mappers and reducers when it is inconvenient or inefficient to express this logic in HiveQL.

But, there is another “Hive,” which handles large datasets:

High-performance Integrated Virtual Environment (HIVE) is a specialized platform being developed/implemented by Dr. Simonyan’s group at FDA and Dr. Mazumder’s group at GWU where the storage library and computational powerhouse are linked seamlessly. This environment provides web access for authorized users to deposit, retrieve, annotate and compute on HTS data and analyze the outcomes using web-interface visual environments appropriately built in collaboration with research scientists and regulatory personnel.

I ran across this potential source of confusion earlier today and haven’t run it completely to ground but wanted to share some of what I have found so far.

Inside the HIVE, the FDA’s Multi-Omics Compute Architecture by Aaron Krol.

From the post:

“HIVE is not just a conventional virtual cloud environment,” says Simonyan. “It’s a different system that virtualizes the services.” Most cloud systems store data on multiple servers or compute units until users want to run a specific application. At that point, the relevant data is moved to a server that acts as a node for that computation. By contrast, HIVE recognizes which storage nodes contain data selected for analysis, then transfers executable code to those nodes, a relatively small task that allows computation to be performed wherever the data is stored. “We make the computations on exactly the machines where the data is,” says Simonyan. “So we’re not moving the data to the computational unit, we are moving computation to the data.”

When working with very large packets of data, cloud computing environments can sometimes spend more time on data transfer than on running code, making this “virtualized services” model much more efficient. To function, however, it relies on granular and readily-accessed metadata, so that searching for and collecting together relevant data doesn’t consume large quantities of compute time.

HIVE’s solution is the honeycomb data model, which stores raw NGS data and metadata together on the same network. The metadata — information like the sample, experiment, and run conditions that produced a set of NGS reads — is stored in its own tables that can be extended with as many values as users need to record. “The honeycomb data model allows you to put the entire database schema, regardless of how complex it is, into a single table,” says Simonyan. The metadata can then be searched through an object-oriented API that treats all data, regardless of type, the same way when executing search queries. The aim of the honeycomb model is to make it easy for users to add new data types and metadata fields, without compromising search and retrieval.

Popular consumption piece so next you may want to visit the HIVE site proper.

From the webpage:

HIVE is a cloud-based environment optimized for the storage and analysis of extra-large data, like Next Generation Sequencing data, Mass Spectroscopy files, Confocal Microscopy Images and others.

HIVE uses a variety of advanced scientific and computational visualization graphics, to get the MOST from your HIVE experience you must use a supported browser. These include Internet Explore 8.0 or higher (Internet Explorer 9.0 is recommended), Google Chrome, Mozilla Firefox and Safari.

A few exemplary analytical outputs are displayed below for your enjoyment. But before you can take advantage of all that HIVE has to offer and create these objects for yourself, you’ll need to register.

With A framework for organizing cancer-related variations from existing databases, publications and NGS data using a High-performance Integrated Virtual Environment (HIVE) by Tsung-Jung Wu, et al., you are starting to approach the computational issues of interest for data integration.

From the article:

The forementioned cooperation is difficult because genomics data are large, varied, heterogeneous and widely distributed. Extracting and converting these data into relevant information and comparing results across studies have become an impediment for personalized genomics (11). Additionally, because of the various computational bottlenecks associated with the size and complexity of NGS data, there is an urgent need in the industry for methods to store, analyze, compute and curate genomics data. There is also a need to integrate analysis results from large projects and individual publications with small-scale studies, so that one can compare and contrast results from various studies to evaluate claims about biomarkers.

See also: High-performance Integrated Virtual Environment (Wikipedia) for more leads to the literature.

Heterogeneous data is still at large and people are building solutions. Rather than either/or, what do you think topic maps could bring as a value-add to this project?

I first saw this in a tweet by ChemConnector.

Results of 2014 State of Clojure and ClojureScript Survey

Filed under: Clojure,ClojureScript,Documentation — Patrick Durusau @ 6:06 pm

Results of 2014 State of Clojure and ClojureScript Survey by Alex Miller.

From the post:

The 2014 State of Clojure and ClojureScript Survey was open from Oct. 8-17th. The State of Clojure survey (which was applicable to all users of Clojure, ClojureScript, and ClojureCLR) had 1339 respondents. The more targeted State of ClojureScript survey had 642 respondents.

The responses to “What has been most frustrating for you in your use of Clojure/CLJS? put “Availability of comprehensive / approachable documentation, tutorials, etc” at #2 and #3 respectively.

Improved technical capabilities is important for existing users but increasing mind share is an issue of “onboarding” new users of Clojure. If you have ever experienced or “read about” the welcoming given even casual visitors in some churches, you will have a good idea of some effective ideas at building membership.

If you try to build a community using techniques not found in churches, you need better techniques. Remember churches have had centuries to practice their membership building techniques.

Let me put it this way: When was the last time you saw a church passing out information as poorly written, organized and incomplete as that for most computer languages? Guess who is winning the membership race by any measure?

Are you up for studying and emulating building church membership techniques? (as appropriate or adapted)

R Programming for Beginners

Filed under: Programming,R — Patrick Durusau @ 10:03 am

R Programming for Beginners by LearnR.

Short videos on R programming, running from a low of two (2) minutes (the intro) up to eight minutes (the debugging session) but generally three (3) to five (5) minutes in length. I have cleaned up the YouTube listing to make it suitable for sharing and/or incorporation into other R resources.

Enjoy!

Balisage 2015!

Filed under: Conferences — Patrick Durusau @ 7:49 am

Early date and location news for Balisage 2015:

We have a date and location for Balisage 2015:

Pre-conference symposium: August 10, 2014
Balisage Conference: August 11 – 14, 2014

Same location as Balisage 2014:

Bethesda North Marriott Hotel & Conference Center,
5701 Marinelli Road, Rockville, MD, 20852-2785

(We have moved to the second week of August so we could have the same auditorium for the conference sessions and better space for posters, breaks, and such.)

Mark your calendars. Start thinking about what you want to talk about at Balisage 2015. Plan your trip to the Washington DC area.

Put plane tickets to Balisage on your holiday wish list!

Start planning your paper and slides now. Imagine what a difference ten (10) months versus the wee morning hours before will make on your slides. (No names, Eliot.)

Whatever your political leanings, the mid-term elections hold no fear. Balisage will occur in August of 2015 so all is right with the world.

October 22, 2014

Loading CSV files into Neo4j

Filed under: CSV,Neo4j — Patrick Durusau @ 8:22 pm

Loading CSV files into Neo4j is so easy that it has taken only three (3) posts, so far, to explain the process. This post is a collection of loading CSV into Neo4j references. If you have others, feel free to contribute them and I will add them to this post.

LOAD CSV into Neo4j quickly and successfully by Michael Hunger on Jun 25, 2014.

Note: You can also read an interactive and live version of this blog post as a Neo4j GraphGist.

Since version 2.1 Neo4j provides out-of-the box support for CSV ingestion. The LOAD CSV command that was added to the Cypher Query language is a versatile and powerful ETL tool.

It allows you to ingest CSV data from any URL into a friendly parameter stream for your simple or complex graph update operation, that … conversion.

The June 25, 2014 post has content that is not repeated in the Oct. 18, 2014 post on loading CSV so you will need both posts, or a very fine memory.

Flexible Neo4j Batch Import with Groovy by Michael Hunger on Oct 9, 2014.

You might have data as CSV files to create nodes and relationships from in your Neo4j Graph Database.

It might be a lot of data, like many tens of million lines.

Too much for LOAD CSV to handle transactionally.

Usually you can just fire up my batch-importer and prepare node and relationship files that adhere to its input format requirements.

What follows is advice on when you may want to deviate from the batch-importer defaults and how to do so.

LOAD CVS with SUCCESS by Michael Hunger on Oct 18, 2014.

I have to admit that using our LOAD CSV facility is trickier than you and I would expect.

Several people ran into issues that they could not solve on their own.

My first blog post on LOAD CSV is still valid in it own right, and contains important aspects that I won’t repeat here.

Incomplete so reference LOAD CSV into Neo4j quickly and successfully while reading this post.

Others?

Consensus Filters

Filed under: Consensus,Filters — Patrick Durusau @ 7:43 pm

Consensus Filters by Yao Yujian.

From the post:

Suppose you have a huge number of robots/vehicles and you want all of them to track some global value, maybe the average of the weight of the fuel that each contains.

One way to do this is to have a master server that takes in everyone’s input and generates the output. So others can get it from the master. But this approach results in a single point of failure and a huge traffic to one server.

The other way is to let all robots talk to each other, so each robot will have information from others, which can then be used to compute the sum. Obviously this will incur a huge communication overhead. Especially if we need to generate the value frequently.

If we can tolerate approximate results, we have a third approach: consensus filters.

There are two advantages to consensus filters:

  1. Low communication overhead
  2. Approximate values can be used even without a consensus

Approximate results won’t be acceptable for all applications but where they are, consensus filters may be on your agenda.

Web Apps in the Cloud: Even Astronomers Can Write Them!

Filed under: Astroinformatics,Social Media — Patrick Durusau @ 7:23 pm

Web Apps in the Cloud: Even Astronomers Can Write Them!

From the post:

Philip Cowperthwaite and Peter K. G. Williams work in time-domain astronomy at Harvard. Philip is a graduate student working on the detection of electromagnetic counterparts to gravitational wave events, and Peter studies magnetic activity in low-mass stars, brown dwarfs, and planets.

Astronomers that study GRBs are well-known for racing to follow up bursts immediately after they occur — thanks to services like the Gamma-ray Coordinates Network (GCN), you can receive an email with an event position less than 30 seconds after it hits a satellite like Swift. It’s pretty cool that we professionals can get real-time notification of stars exploding across the universe, but it also seems like a great opportunity to convey some of the excitement of cutting-edge science to the broader public. To that end, we decided to try to expand the reach of GCN alerts by bringing them on to social media. Join us for a surprisingly short and painless tale about the development of YOITSAGRB, a tiny piece of Python code on the Google App Engine that distributes GCN alerts through the social media app Yo.

If you’re not familiar with Yo, there’s not much to know. Yo was conceived as a minimalist social media experience: users can register a unique username and send each other a message consisting of “Yo,” and only “Yo.” You can think of it as being like Twitter, but instead of 140 characters, you have zero. (They’ve since added more features such as including links with your “Yo,” but we’re Yo purists so we’ll just be using the base functionality.) A nice consequence of this design is that the Yo API is incredibly straightforward, which is convenient for a “my first web app” kind of project.

While “Yo” has been expanded to include more content, the origin remains an illustration of the many meanings that can be signaled by the same term. In this case, the detection of a gamma-ray burst in the known universe.

Or “Yo” could mean it is time to start some other activity when received from a particular sender. Or even be a message composed entirely of “Yo’s” where different senders had some significance. Or “Yo’s” sent at particular times to compose a message. Or “Yo’s” sent to leave the impression that messages were being sent. 😉

So, does a “Yo” have any semantics separate and apart from that read into it by a “Yo” recipient?

Data Integrity and Problems of Scope

Filed under: Distributed Consistency,Immutable — Patrick Durusau @ 4:21 pm

Data Integrity and Problems of Scope by Peter Baillis.

From the post:

Mutable state in distributed systems can cause all sorts of headaches, including data loss, corruption, and unavailability. Fortunately, there are a range of techniques—including exploiting commutativity and immutability—that can help reduce the incidence of these events without requiring much overhead. However, these techniques are only useful when applied correctly. When applied incorrectly, applications are still subject to data loss and corruption. In my experience, (the unfortunately common) incorrect application of these techniques is often due to problems of scope. What do I mean by scope? Let’s look at two examples:

Having the right ideas is not enough, you must implement them correctly as well.

Peter’s examples will sharpen your thinking about data integrity.

Enjoy!

Gram­mat­i­cal the­o­ry: From trans­for­ma­tion­al gram­mar to con­straint-​based ap­proach­es

Filed under: Grammar,Language — Patrick Durusau @ 4:09 pm

Gram­mat­i­cal the­o­ry: From trans­for­ma­tion­al gram­mar to con­straint-​based ap­proach­es by Ste­fan Müller.

From the webpage:

To ap­pear 2015 in Lec­ture Notes in Lan­guage Scineces, No 1, Berlin: Lan­guage Sci­ence Press. The book is a trans­la­tion and ex­ten­sion of the sec­ond edi­tion of my gram­mar the­o­ry book that ap­peared 2010 in the Stauf­fen­burg Ver­lag.

This book in­tro­duces for­mal gram­mar the­o­ries that play a role in cur­rent lin­guis­tics or con­tribut­ed tools that are rel­e­vant for cur­rent lin­guis­tic the­o­riz­ing (Phrase Struc­ture Gram­mar, Trans­for­ma­tion­al Gram­mar/Gov­ern­ment & Bind­ing, Gen­er­al­ized Phrase Struc­ture Gram­mar, Lex­i­cal Func­tion­al Gram­mar, Cat­e­go­ri­al Gram­mar, Head-​Driv­en Phrase Struc­ture Gram­mar, Con­struc­tion Gram­mar, Tree Ad­join­ing Gram­mar). The key as­sump­tions are ex­plained and it is shown how the re­spec­tive the­o­ry treats ar­gu­ments and ad­juncts, the ac­tive/pas­sive al­ter­na­tion, local re­order­ings, verb place­ment, and fronting of con­stituents over long dis­tances. The anal­y­ses are ex­plained with Ger­man as the ob­ject lan­guage.

In a final chap­ter the ap­proach­es are com­pared with re­spect to their pre­dic­tions re­gard­ing lan­guage ac­qui­si­tion and psy­cholin­guis­tic plau­si­bil­i­ty. The Na­tivism hy­poth­e­sis that as­sumes that hu­mans poss­es ge­net­i­cal­ly de­ter­mined in­nate lan­guage-​spe­cif­ic knowl­edge is ex­am­ined crit­i­cal­ly and al­ter­na­tive mod­els of lan­guage ac­qui­si­tion are dis­cussed. In ad­di­tion this chap­ter ad­dress­es is­sues that are dis­cussed con­tro­ver­sial­ly in cur­rent the­o­ry build­ing as for in­stance the ques­tion whether flat or bi­na­ry branch­ing struc­tures are more ap­pro­pri­ate, the ques­tion whether con­struc­tions should be treat­ed on the phrasal or the lex­i­cal level, and the ques­tion whether ab­stract, non-​vis­i­ble en­ti­ties should play a role in syn­tac­tic anal­y­ses. It is shown that the anal­y­ses that are sug­gest­ed in the re­spec­tive frame­works are often trans­lat­able into each other. The book clos­es with a sec­tion that shows how prop­er­ties that are com­mon to all lan­guages or to cer­tain lan­guage class­es can be cap­tured.

The webpage offers a download link for the current draft, teaching materials and a BibTeX file of all publications that the author cites in his works.

Interesting because of the application of these models to a language other than English and the author’s attempt to help readers avoid semantic confusion:

Unfortunately, linguistics is a scientific field which is afflicted by an unbelievable degree of terminological chaos. This is partly due to the fact that terminology originally defined for certain languages (e. g. Latin, English) was later simply adopted for the description of other languages as well. However, this is not always appropriate since languages differ from one another greatly and are constantly changing. Due to the problems this caused, the terminology started to be used differently or new terms were invented. when new terms are introduced in this book, I will always mention related terminology or differing uses of each term so that readers can relate this to other literature.

Unfortunately, it does not appear like the author gathered the new terms up into a table or list. Creating such a list from the book would be a very useful project.

FilterGraph

Filed under: Astroinformatics,Graphics,Visualization — Patrick Durusau @ 3:38 pm

FilterGraph

From the wiki:

Filtergraph allows you to create interactive portals from datasets that you import. As a web application, no downloads are necessary – it runs and updates in real time on your browser as you make changes within the portal. All that you need to start a portal is an email address and a dataset in a supported type. Creating an account is completely free, and Filtergraph supports a wide variety of data types. For a list of supported data types see “ Supported File Types ”. (emphasis in original)

Just in case you are curious about the file types:

Filtergraph will allow you to upload dataset files in the following formats:

ASCII text Tab, comma and space separated
Microsoft Excel *.xls, *.xlsx
SQLite *.sqlite
VOTable *.vot, *.xml
FITS *.fits
IPAC *.tbl
Numpy *.npy
HDF5 *.h5

You can upload files up to 50MB in size. Larger files can be accommodated if you contact us via a Feedback Form.

For best results:

  • Make sure each row has the same number of columns. If a row has an incorrect number of columns, it will be ignored.
  • Place a header in the first row to name each column. If a header cannot be found, the column names will be assigned as Column1, Column2, etc.
  • If you include a header, make the name of each column unique. Otherwise, the duplicate names will be modified.
  • For ASCII files, you may optionally use the ‘#’ symbol to designate a header.

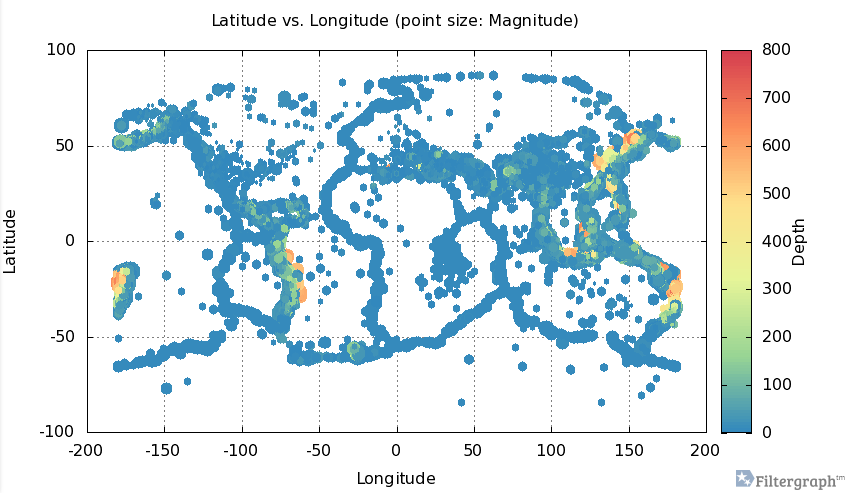
Here is an example of an intereactive graph for earthquakes at FilterGraph:

graph of earthquakes

You can share the results of analysis and allow others to change the analysis of large data sets, without sending the data.

From the homepage:

Developed by astronomers at Vanderbilt University, Filtergraph is used by over 200 people in 28 countries to empower large-scale projects such as the KELT-North and KELT-South ground-based telescopes, the Kepler, Spitzer and TESS space telescopes, and a soil collection project in Bangladesh.

Enjoy!

« Newer PostsOlder Posts »

Powered by WordPress