From the wiki:
Filtergraph allows you to create interactive portals from datasets that you import. As a web application, no downloads are necessary – it runs and updates in real time on your browser as you make changes within the portal. All that you need to start a portal is an email address and a dataset in a supported type. Creating an account is completely free, and Filtergraph supports a wide variety of data types. For a list of supported data types see “ Supported File Types ”. (emphasis in original)
Just in case you are curious about the file types:
Filtergraph will allow you to upload dataset files in the following formats:
ASCII text Tab, comma and space separated Microsoft Excel *.xls, *.xlsx SQLite *.sqlite VOTable *.vot, *.xml FITS *.fits IPAC *.tbl Numpy *.npy HDF5 *.h5 You can upload files up to 50MB in size. Larger files can be accommodated if you contact us via a Feedback Form.
For best results:
- Make sure each row has the same number of columns. If a row has an incorrect number of columns, it will be ignored.
- Place a header in the first row to name each column. If a header cannot be found, the column names will be assigned as Column1, Column2, etc.
- If you include a header, make the name of each column unique. Otherwise, the duplicate names will be modified.
- For ASCII files, you may optionally use the ‘#’ symbol to designate a header.
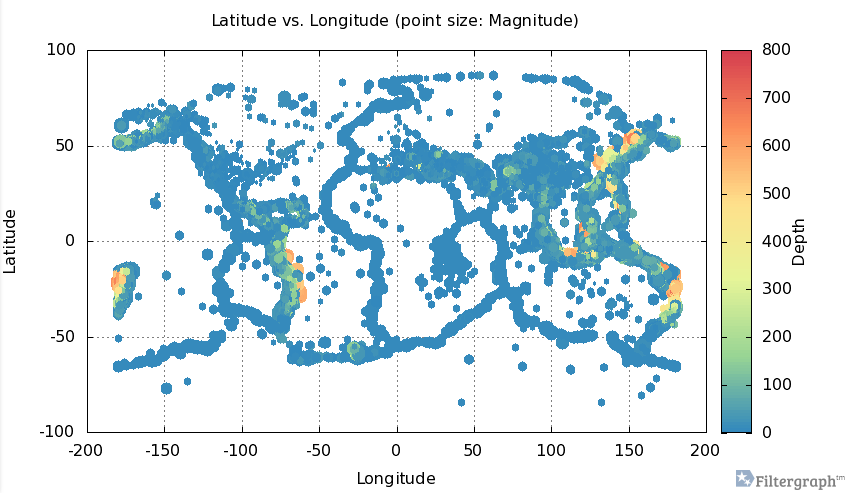
Here is an example of an intereactive graph for earthquakes at FilterGraph:
You can share the results of analysis and allow others to change the analysis of large data sets, without sending the data.
From the homepage:
Developed by astronomers at Vanderbilt University, Filtergraph is used by over 200 people in 28 countries to empower large-scale projects such as the KELT-North and KELT-South ground-based telescopes, the Kepler, Spitzer and TESS space telescopes, and a soil collection project in Bangladesh.
Enjoy!
