Another Word For It Patrick Durusau on Topic Maps and Semantic Diversity

March 6, 2014

Bersys 2014!

Filed under: Benchmarks,RDF,SPARQL — Patrick Durusau @ 2:18 pm

Bersys 2014!

From the webpage:

Following the 1st International workshop on Benchmarking RDF Systems (BeRSys 2013) the aim of the BeRSys 2014 workshop is to provide a discussion forum where researchers and industrials can meet to discuss topics related to the performance of RDF systems. BeRSys 2014 is the only workshop dedicated to benchmarking different aspects of RDF engines – in the line of TPCTC series of workshops.The focus of the workshop is to expose and initiate discussions on best practices, different application needs and scenarios related to different aspects of RDF data management.

We will solicit contributions presenting experiences with benchmarking RDF systems, real-life RDF application needs which are good candidates for benchmarking, as well as novel ideas on developing benchmarks for different aspects of RDF data management ranging from query processing, reasoning to data integration. More specifically, we will welcome contributions from a diverse set of domain areas such as life science (bio-informatics, pharmaceutical), social networks, cultural informatics, news, digital forensics, e-science (astronomy, geology) and geographical among others. More specifically, the topics of interest include but are not limited to:

  • Descriptions of RDF data management use cases and query workloads
  • Benchmarks for RDF SPARQL 1.0 and SPARQL 1.1 query workloads
  • Benchmarks RDF data integration tasks including but not limited to ontology aligment, instance matching and ETL techniques
  • Benchmark metrics
  • Temporal and geospatial benchmarks
  • Evaluation of benchmark performance results on RDF engines
  • Benchmark principles
  • Query processing and optimization algorithms for RDF systems.

Venue:

The workshop is held in conjuction with the 40th International Conference on Very Large Data Bases (VLDB2014) in Hangzhou, China.

The only date listed on the announcement is September 1-5, 2014 for the workshop.

When other dates appear, I will update this post and re-post about the conference.

As you have seen in better papers on graphs, RDF, etc., benchmarking in this area is a perilous affair. Workshops, like this one, are one step towards building the experience necessary to consider the topic of benchmarking.

I first saw this in a tweet by Stefano Bertolo.

Fostering Innovation?

Filed under: Challenges,Funding — Patrick Durusau @ 11:03 am

How Academia and Publishing are Destroying Scientific Innovation: A Conversation with Sydney Brenner by Elizabeth Dzeng.

From the post:

I recently had the privilege of speaking with Professor Sydney Brenner, a professor of Genetic medicine at the University of Cambridge and Nobel Laureate in Physiology or Medicine in 2002. My original intention was to ask him about Professor Frederick Sanger, the two-time Nobel Prize winner famous for his discovery of the structure of proteins and his development of DNA sequencing methods, who passed away in November. I wanted to do the classic tribute by exploring his scientific contributions and getting a first hand account of what it was like to work with him at Cambridge’s Medical Research Council’s (MRC) Laboratory for Molecular Biology (LMB) and at King’s College where they were both fellows. What transpired instead was a fascinating account of the LMB’s quest to unlock the genetic code and a critical commentary on why our current scientific research environment makes this kind of breakthrough unlikely today.

If you or any funders you know are interested in fostering innovation, that is actually enabling innovation to happen, this is a must read interview for you.

If you are any funders you know are interested in boosting about “fostering innovation,” creating “new breakthroughs” while funding the usual suspects, etc., just pass this one by.

One can only hope that observations of proven innovators like Sydney Brenner will carry more weight that political ideologies in the research funding process.

I first saw this in a tweet by Ivan Herman.

…Why Watson Can’t Get a Job

Filed under: Artificial Intelligence — Patrick Durusau @ 10:48 am

IBM’s Artificial Intelligence Problem, or Why Watson Can’t Get a Job by Drake Bennett.

From the post:

What if we built a super-smart artificial brain and no one cared? IBM (IBM) is facing that possibility. According to the Wall Street Journal, the company is having a hard time making money off of its Jeopardy-winning supercomputer, Watson. The company has always claimed that Watson was more than a publicity stunt, that it had revolutionary real-world applications in health care, investing, and other realms. IBM Chief Executive Officer Virginia Rometty has promised that Watson will generate $10 billion in annual revenue within 10 years, but according to the Journal, as of last October Watson was far behind projections, only bringing in $100 million.

The Journal article focuses on difficulties and costs in “training” Watson to master the particulars of various businesses—at the M.D. Anderson Cancer Center, at Citigroup (C), at the health insurer WellPoint (WLP). But there may also be another issue: the sort of intelligence Watson possesses might not be a particularly good fit for some of the jobs IBM is looking at.
….

A very good summary of the issues around getting Watson some paying work.

My take away was that you can replace people in a complex situation, like medical diagnosis, but if and only if, you are willing to accept degraded results.

How degraded remains to be seen. I can say I would not want to be the medical malpractice carrier for Watson.

Which makes me wonder about the general trend of replacing people with machines. There are many tasks that machines can perform, but if and only if you are willing to accept degraded results.

For example, I am sure you have seen the machine learning sites that promise you too can analyze data like a pro! No training, expensive data scientists, etc. Just plug your data in and go.

I don’t doubt that you can “plug you data in and go” but I also have little doubt about the quality of results that you obtain.

After all, we (people in general) are the creators of computers, the data you want to process, the algorithms you will use, why it is important to exclude people from your process?

Cheaper? If results are all that count, casino dice are about $12.00 for five (5), even cheaper than online machine learning services. Just roll the dice and fill in the numbers you need.

GraphChi-DB: Simple Design…

Filed under: GraphChi,Graphs — Patrick Durusau @ 10:11 am

GraphChi-DB: Simple Design for a Scalable Graph Database System — on Just a PC by Aapo Kyrola and Carlos Guestrin.

Abstract:

We propose a new data structure, Parallel Adjacency Lists (PAL), for efficiently managing graphs with billions of edges on disk. The PAL structure is based on the graph storage model of GraphChi (Kyrola et. al., OSDI 2012), but we extend it to enable online database features such as queries and fast insertions. In addition, we extend the model with edge and vertex attributes. Compared to previous data structures, PAL can store graphs more compactly while allowing fast access to both the incoming and the outgoing edges of a vertex, without duplicating data. Based on PAL, we design a graph database management system, GraphChi-DB, which can also execute powerful analytical graph computation.

We evaluate our design experimentally and demonstrate that GraphChi-DB achieves state-of-the-art performance on graphs that are much larger than the available memory. GraphChi-DB enables anyone with just a laptop or a PC to work with extremely large graphs.

Open source will be released at: https://github.com/GraphChi.

With data structure improvements like you find with GraphChi-DB, it won’t be long until the average laptop becomes a weapons grade munition. 😉

Study the Partitioned Adjacency List (PAL) details carefully to follow up on the suggestions of using PAL for RDBMS and RDF storage (topic maps?).

Highly recommended!

March 5, 2014

Q

Filed under: Data,Language — Patrick Durusau @ 8:27 pm

Q by Bernard Lambeau.

From the webpage:

Q is a data language. For now, it is limited to a data definition language (DDL). Think “JSON/XML schema”, but the correct way. Q comes with a dedicated type system for defining data and a theory, called information contracts, for interoperability with programming and data exchange languages.

I am sure this will be useful but limited since it doesn’t extend to disclosing the semantics of data or the structures that contain data.

Unfortunate but it seems like the semantics of data are treated as: “…you know what the data means…,” which is rather far from the truth.

Sometimes some people may know what the data “means,” but that is hardly a sure thing.

My favorite example being the pyramids being build in front of hundreds of thousands of people over decades and because everyone “…knew how it was done…,” no one bothered to write it down.

Now H2 can consult with “ancient astronaut theorists” (I’m not lying, that is what they called their experts) about the building of the pyramids.

Do you want your data to be interpreted by the data equivalent of an “ancient astronaut theorist?” If not, you had better give some consideration to documenting the semantics of your data.

I first saw this in a tweet by Carl Anderson.

Welcoming Bankers/Lawyers/CEOs to the Goldfish Bowl

Filed under: Privacy,Security — Patrick Durusau @ 8:07 pm

A vast hidden surveillance network runs across America, powered by the repo industry by Shawn Musgrave.

From the post:

Few notice the “spotter car” from Manny Sousa’s repo company as it scours Massachusetts parking lots, looking for vehicles whose owners have defaulted on their loans. Sousa’s unmarked car is part of a technological revolution that goes well beyond the repossession business, transforming any ­industry that wants to check on the whereabouts of ordinary people.

An automated reader attached to the spotter car takes a picture of every ­license plate it passes and sends it to a company in Texas that already has more than 1.8 billion plate scans from vehicles across the country.

These scans mean big money for Sousa — typically $200 to $400 every time the spotter finds a vehicle that’s stolen or in default — so he runs his spotter around the clock, typically adding 8,000 plate scans to the database in Texas each day.

“Honestly, we’ve found random apartment complexes and shopping ­plazas that are sweet spots” where the company can impound multiple vehicles, explains Sousa, the president of New England Associates Inc. in Bridgewater.

But the most significant impact of Sousa’s business is far bigger than locating cars whose owners have defaulted on loans: It is the growing database of snapshots showing where Americans were at specific times, information that everyone from private detectives to ­insurers are willing to pay for.

Shawn does a great job detailing how pervasive auto-surveillance is in the United States. Bad enough for repossession but your car’s location could be used as evidence of your location as well.

I suppose as compensation for lenders and repossession companies taking photos of license plates, ordinary people could follow lender and repossession employees around and do the same thing.

While thinking about that possibility, it occurred to me that the general public could do them one better.

When you see a banker, lawyer, CEO at a party, school event, church service, restaurant, etc., use your cellphone to snap their picture. Tag everyone you recognize in the photo.

If enough people take enough photographs, there will be a geo-location and time record of their whereabouts for more and more of every day.

Thinking we need photos of elected officials, their immediate staffs and say the top 10% of your locality in terms of economic status.

It won’t take long before those images, perhaps even your images, will become quite important.

Maybe this could be the start of the intell market described in Snow Crash.

Some people may buy your intell to use it, others may buy it to suppress it.

I first saw this in a tweet by Tim O’Reilly.

F#

Filed under: F#,Functional Programming,Programming — Patrick Durusau @ 5:32 pm

Microsoft-backed F# language surges in popularity by Paul Krill.

From the post:

The Microsoft-backed F# functional programming language is gaining traction, with the platform showing a meteoric year-over-year rise on the Tiobe Programming Community Index gauging language popularity.

Ranked 69th on the index a year ago, F# has risen to the 12th spot in this month’s rankings, with a 1.216 percent rating. As the index headline notes, “F# is on its way to the Top 10.”

Microsoft Research’s F# page says the language is object-oriented and enables developers to write simple code to solve complex problems. “This simple and pragmatic language has particular strengths in data-oriented programming, parallel I/O programming, parallel CPU programming, scripting, and algorithmic development,” Microsoft said. F# originated at Microsoft Research; the F# Software Foundation has been formed to advance the language. The Microsoft Cloud Platform Tools group technically is in charge of F#.

F# Software Foundation. Did you know that F# has an open source license? Just an observation.

You can check the Tiobe Index.

Any topic map software in F#?

CUDA 6, Available as Free Download, …

Filed under: GPU,NVIDIA — Patrick Durusau @ 5:02 pm

CUDA 6, Available as Free Download, Makes Parallel Programming Easier, Faster by George Millington.

From the post:

We’re always striving to make parallel programming better, faster and easier for developers creating next-gen scientific, engineering, enterprise and other applications.

With the latest release of the CUDA parallel programming model, we’ve made improvements in all these areas.

Available now to all developers on the CUDA website, the CUDA 6 Release Candidate is packed with several new features that are sure to please developers.

A few highlights:

  • Unified Memory – This major new feature lets CUDA applications access CPU and GPU memory without the need to manually copy data from one to the other. This is a major time saver that simplifies the programming process, and makes it easier for programmers to add GPU acceleration in a wider range of applications.
  • Drop-in Libraries – Want to instantly accelerate your application by up to 8X? The new drop-in libraries can automatically accelerate your BLAS and FFTW calculations by simply replacing the existing CPU-only BLAS or FFTW library with the new, GPU-accelerated equivalent.
  • Multi-GPU Scaling – Re-designed BLAS and FFT GPU libraries automatically scale performance across up to eight GPUs in a single node. This provides over nine teraflops of double-precision performance per node, supporting larger workloads than ever before (up to 512GB).

And there’s more.

In addition to the new features, the CUDA 6 platform offers a full suite of programming tools, GPU-accelerated math libraries, documentation and programming guides.

To keep informed about the latest CUDA developments, and to access a range parallel programing tools and resources, we encourage you to sign up for the free CUDA/GPU Computing Registered Developer Program at the NVIDIA Developer Zone website.

The only sad note is that processing power continues to out-distance the ability to document and manipulate the semantics of data.

Not unlike having a car that can cross the North American continent in a hour but not having a map of locations between the coasts.

You arrive quickly, but is it where you wanted to go?

On Data and Performance

Filed under: Art,Data,Topic Maps — Patrick Durusau @ 4:46 pm

On Data and Performance by Jer Thorp.

From the post:

Data live utilitarian lives. From the moment they are conceived, as measurements of some thing or system or person, they are conscripted to the cause of being useful. They are fed into algorithms, clustered and merged, mapped and reduced. They are graphed and charted, plotted and visualized. A rare datum might find itself turned into sound, or, more seldom, manifested as a physical object. Always, though, the measure of the life of data is in its utility. Data that are collected but not used are condemned to a quiet life in a database. They dwell in obscure tables, are quickly discarded, or worse (cue violin) – labelled as ‘exhaust’.

Perhaps this isn’t the only role for a datum? To be operated on? To be useful?

Over the last couple of years, with my collaborators Ben Rubin & Mark Hansen, we’ve been investigating the possibility of using data as a medium for performance. Here, data becomes the script, or the score, and in turn technologies that we typically think of as tools become instruments, and in some cases performers.

The most recent manifestation of these explorations is a performance called A Thousand Exhausted Things, which we recently staged at The Museum of Modern Art, with the experimental theater group Elevator Repair Service. In this performance, the script is MoMA’s collections database, an eighty year-old, 120k object strong archive. The instruments are a variety of custom-written natural language processing algorithms, which are used to turn the text of the database (largely the titles of artworks) into a performable form.

The video would have been far more effective had it included the visualization at all time with the script and actors.

The use of algorithms to create a performance from the titles of works reminds me of Stanley Fish’s How to Recognize a Poem When You See One. From my perspective, the semantics you “see” in data are the semantics you expect to see. What else would they be?

What I find very powerful about topic maps is that different semantics can reside side by side for the same data.

I first saw this in tweet by blprnt.

Introducing Source Guides

Filed under: News,Reporting — Patrick Durusau @ 4:29 pm

Introducing Source Guides by Erin Kissane.

From the post:

Topical collections for readers new and experienced

In the two-and-a-bit years we’ve been publishing Source, we’ve built up a solid archive of project walkthroughs, introductions to new tools and libraries, and case studies. They’re all tagged and searchable, but as with most archives presented primarily in reverse-chron order, pieces tend to attract less attention once they fall off the first page of a given section.

We’ve also been keeping an eye out for ways of inviting in readers who haven’t been following along since we started Source, and who may be a little newer to journalism code—either to the “code” or the “journalism” part.

Introducing Guides

Earlier this year, we got the OpenNews team together for a few workdays in space graciously lent to us by the New York Times, and in our discussion of the two above challenges, we hit on the idea of packaging articles from our archives into topical “guides” that could highlight the most useful and evergreen of our articles on a given subject. Ryan extended our CMS to allow for the easy creation of topical collections via the admin interface, and we started collecting and annotating pieces a few weeks ago.

Today, we’re launching Source Guides with three topics: News Apps Essentials and Better Mapping, which are just what they say on the tin; and the Care and Feeding of News Apps, a beyond-the-basics Guide that considers the introduction, maintenance, and eventual archiving of code projects in newsrooms. In the coming months, we’ll be rolling out a few more batches of Guides, and then adding to the list organically as new themes coalesce in the archives.

Reminds me of the vertical files (do they still call them that?) reference librarians used to maintain. A manila folder with articles, photocopies, etc., centered on some particular topic. Usually one that came up every year or of local interest.

Not all that far from a topic map except that you have to read all the text to collate related pieces together and every reader repeats that task.

Having said that, this is quite a remarkable project that merits your interest and support.

I first saw this in a tweet by Bryan Connor.

Practical Sentiment Analysis Tutorial

Filed under: Lingual,Sentiment Analysis — Patrick Durusau @ 2:51 pm

Practical Sentiment Analysis Tutorial by Jason Baldridge.

Slides for tutorial on sentiment analysis.

Includes such classics as:

I saw her duck with a telescope.

How many interpretations do you get? Check yourself against Jason’s slides.

Quite a slide deck, my reader reports four hundred and thirty-five pages, 435 pages.

Enjoy!

Entity Recognition and Disambiguation Challenge

Filed under: Disambiguation,Entity Resolution — Patrick Durusau @ 2:20 pm

Entity Recognition and Disambiguation Challenge by Evgeniy Gabrilovich.

Important Dates
March 10: Leaderboard and trial submission system online (tentative)
June 10: Trial runs end at 11:59AM PDT; Test begins at noon PDT
June 20: Team results announced
June 27: Workshop paper due
July 11: Workshop at SIGIR-2014, Gold Coast, Australia

From the post:

We are happy to announce the 2014 Entity Recognition and Disambiguation (ERD) Challenge! Participating teams will have the opportunity to not only win cash prizes in the total amount of US$1,500 but also be invited to publish and present their results at a SIGIR 2014 workshop in Gold Coast, Australia, co-sponsored by Google and Microsoft (http://goo.gl/UOu08m).

The objective of an ERD system is to recognize mentions of entities in a given text, disambiguate them, and map them to the known entities in a given collection or knowledge base. Building a good ERD system is challenging because:

* Entities may appear in different surface forms
* The context in which a surface form appears often constrains valid entity interpretations
* An ambiguous surface form may match multiple entity interpretations, especially in short text

The ERD Challenge will have two tracks, with one focusing on ERD for long texts (i.e., web documents) and the other on short texts (i.e., web search queries), respectively. Each team can elect to participate either in one or both tracks.

Open to the general public, participants are asked to build their systems as publicly accessible web services using whatever resources at their disposal. The entries to the Challenge are submitted in the form of URLs to the participants’ web services.

Participants will have a period of 3 months to test run their systems using development datasets hosted by the ERD Challenge website. The final evaluations and the determination of winners will be performed on held-out datasets that have similar properties to the development sets.

From the Microsoft version of the announcement:

  • The call for participation is now available here.
  • Please express your intent for joining the competition using the signup sheet.
  • A google group is created for discussion purpose. subscribe to the google group for news and announcements.
  • ERD 2014 will be a SIGIR 2014 workshop. See you in Australia!

The challenge website: Entity Recognition and Disambiguation Challenge

Beta versions of the data sets.

I would like to be on a team but someone else would have to make the trip to Australia. 😉

Dumb, Dumber, Dumbest

Filed under: Humor,Interface Research/Design — Patrick Durusau @ 2:03 pm

There are times when the lack of quality in government and other organizations seems explainable: People work there!

From recent news stories:

Dumb:

18% of people fall for phishing emails. Hacking Critical Infrastructure Companies – A Pen Tester View

Dumber:

11% of Americans think HTML is a sexually transmitted disease. 1 in 10 Americans think HTML is an STD, study finds

Dumbest:

An elementary school principal:

responded to a Craigslist advertisement over the weekend and talked with an undercover officer who posed as a child’s mother looking to arrange for a man to meet her teenage daughter. (Bond set for Douglas County principal arrested in sex sting)

It’s been a while since I was a teenager but I don’t remember any mothers taking out ads in the newspaper for their daughters. Do you?

Take this as a reminder to do realistic user testing of interfaces.

  1. Pick people at random and put them in front your interface.
  2. Take video of their efforts to use the interface for the intended task(s).
  3. Ask what about your interface confused the user?
  4. Fix the interface (do not attempt to fix the user, plenty more where that one came from)
  5. Return to step 1.

March 4, 2014

Parkinson’s Law, DevOps, and Kingdoms

Filed under: Marketing,Silos — Patrick Durusau @ 8:39 pm

Parkinson’s Law, DevOps, and Kingdoms by Michael Ducy.

From the post:

Destruction of silos is all the rage in DevOps and has been since the beginning of the movement. Patrick Debois wrote a very intelligent piece on why silos exist and how they came about as a management strategy. While the post explains why hierarchy style of management came about in the US (General Motors and Sloan), it doesn’t cover some of the personal motivations as to why silos or management kingdoms come about.

Michael and Patrick’s posts are very much worth your time if you want to market to organizations as they exist now and not as they may exist in some parallel universe.

For example, enabling managers to do more work with fewer staff is a sale plea that is DOA. Unless your offering will cut the staff of some corporate rival. (There are exceptions to every rule.)

Or, enabling a manager’s department to further the stated goals of the organization. The goal of managers are to further their departments, which may or may not be related to the mission of the organization.

Enjoy!

Part-of-Speech Tagging from 97% to 100%:…

Filed under: Linguistics,Natural Language Processing — Patrick Durusau @ 8:21 pm

Part-of-Speech Tagging from 97% to 100%: Is It Time for Some Linguistics? by Christopher D. Manning.

Abstract:

I examine what would be necessary to move part-of-speech tagging performance from its current level of about 97.3% token accuracy (56% sentence accuracy) to close to 100% accuracy. I suggest that it must still be possible to greatly increase tagging performance and examine some useful improvements that have recently been made to the Stanford Part-of-Speech Tagger. However, an error analysis of some of the remaining errors suggests that there is limited further mileage to be had either from better machine learning or better features in a discriminative sequence classifier. The prospects for further gains from semi-supervised learning also seem quite limited. Rather, I suggest and begin to demonstrate that the largest opportunity for further progress comes from improving the taxonomic basis of the linguistic resources from which taggers are trained. That is, from improved descriptive linguistics. However, I conclude by suggesting that there are also limits to this process. The status of some words may not be able to be adequately captured by assigning them to one of a small number of categories. While conventions can be used in such cases to improve tagging consistency, they lack a strong linguistic basis.

I was struck by Christopher’s observation:

The status of some words may not be able to be adequately captured by assigning them to one of a small number of categories. While conventions can be used in such cases to improve tagging consistency, they lack a strong linguistic basis.

which comes up again in his final sentence:

But in such cases, we must accept that we are assigning parts of speech by convention for engineering convenience rather than achieving taxonomic truth, and there are still very interesting issues for linguistics to continue to investigate, along the lines of [27].

I suppose the observation stood out for me because on what other basis would we assign properties other than “convenience?”

When I construct a topic, I assign properties that I hope are useful to others when they view that particular topic. I don’t assign it properties unknown to me. I don’t necessarily assign it all the properties I may know for a given topic.

I may even assign it properties that I know will cause a topic to merge with other topics.

BTW, footnote [27] refers to:

Aarts, B.: Syntactic gradience: the nature of grammatical indeterminacy. Oxford University Press, Oxford (2007)

Sounds like an interesting work. I did search for “semantic indeterminacy” while at Amazon but it marked out “semantic” and returned results for indeterminacy. 😉

I first saw this in a tweet by the Stanford NLP Group.

Biodiversity Information Standards

Filed under: Biodiversity,RDF — Patrick Durusau @ 4:48 pm

Biodiversity Information Standards

From the webpage:

The most widely deployed formats for biodiversity occurrence data are Darwin Core (wiki) and ABCD (wiki).

The TDWG community’s priority is the deployment of Life Science Identifiers (LSID), the preferred Globally Unique Identifier technology and transitioning to RDF encoded metadata as defined by a set of simple vocabularies. All new projects should address the need for tagging their data with LSIDs and consider the use or development of appropriate vocabularies.

TDWG’s activities within the biodiversity informatics domain can be found in the Activities section of this website.

TDWG = Taxonomic Database Working Group.

I originally followed a link on “Darwin Core,” which sounded to much like another “D***** Core” to not check the reference.

Net result is two of the most popular formats used for biodiversity data.

Category Theory in Coq

Filed under: Category Theory,Coq — Patrick Durusau @ 4:10 pm

Category Theory in Coq by Adam Megacz.

From the webpage:

This is a quick page I’ve thrown together for my Coq library formalizing basic category theory. The development follows Steve Awodey’s book on category theory; the files are named after chapters and subchapters of that book for easy reference.

Getting It

The gitweb is here. You might also want to look at the README

You will find the following helpful:

The Coq Proof Assistant (v8.4 2012) Links to source, binaries and documentation.

I first saw this in a tweet by Algebra Fact.

Lyra Gets its First Visualization Tutorial

Filed under: Graphics,Lyra,Visualization — Patrick Durusau @ 3:48 pm

Lyra Gets its First Visualization Tutorial by Bryan Connor.

From the post:

Before the demo session even began, Tapestry was humming with talk of “Lyra.” A group gathered around Arvind Satyanarayan as he took us for a spin around the tool he helped developed at UW Interactive Data Lab.

It’s just a few day later and the tool’s open source code is up on Github. You can run the app yourself in the browser and now the first tutorial about Lyra has been written.

Jim Vallandingham’s Lyra tutorial is naturally a tentative investigation of an app that is in early alpha. It does a fantastic job of teasing apart the current features of Lyra and making predictions about how it can be used in the future. Some sections are highlighted below.

You will also want to visit:

The Lyra Visualization Design Environment (VDE) alpha by Arvind Satyanarayan, Kanit “Ham” Wongsuphasawat, Jeffrey Heer.

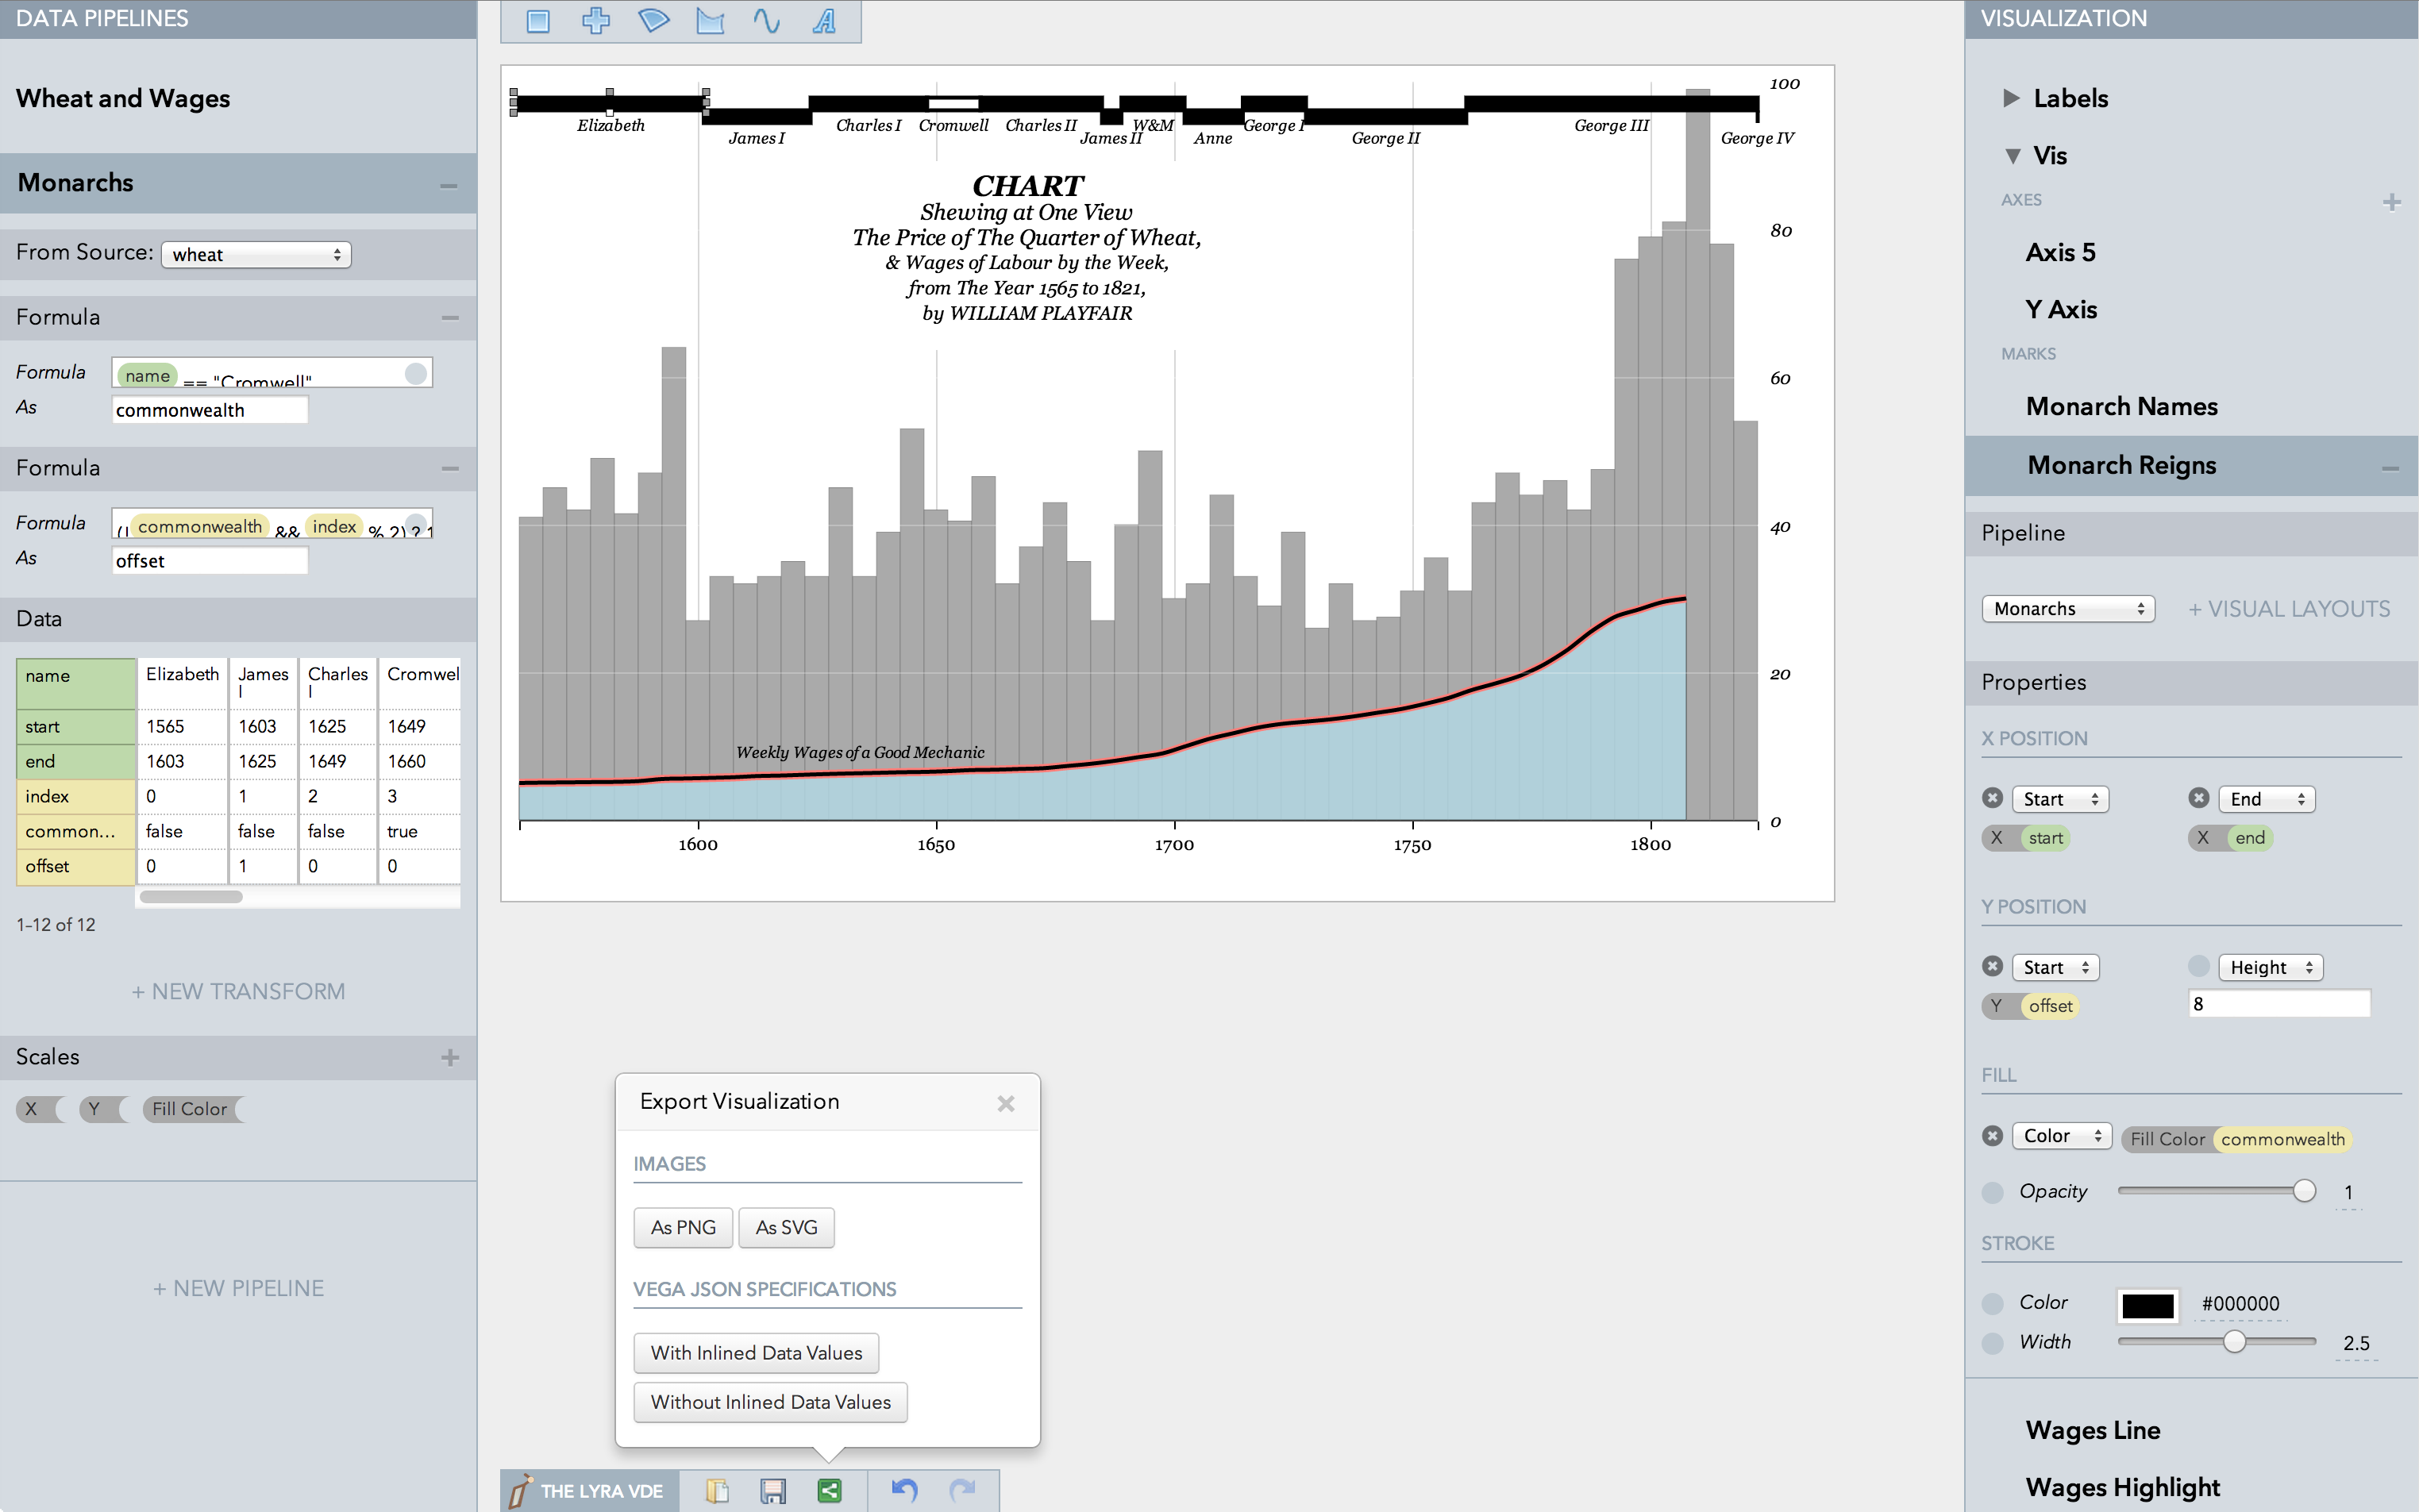
playfair
William Playfair’s classic chart comparing the price of wheat and wages in England recreated in the Lyra VDE.

Lyra is an interactive environment that enables custom visualization design without writing any code. Graphical “marks” can be bound to data fields using property drop zones; dynamically positioned using connectors; and directly moved, rotated, and resized using handles. Lyra also provides a data pipeline interface for iterative visual specification of data transformations and layout algorithms. Lyra is more expressive than interactive systems like Tableau, allowing designers to create custom visualizations comparable to hand-coded visualizations built with D3 or Processing. These visualizations can then be easily published and reused on the Web.

This looks very promising!

Semantics in Support of Biodiversity Knowledge Discovery:…

Filed under: Ontology,Semantics — Patrick Durusau @ 3:08 pm

Semantics in Support of Biodiversity Knowledge Discovery: An Introduction to the Biological Collections Ontology and Related Ontologies by Walls RL, Deck J, Guralnick R, Baskauf S, Beaman R, et al. (2014). (Walls RL, Deck J, Guralnick R, Baskauf S, Beaman R, et al. (2014) Semantics in Support of Biodiversity Knowledge Discovery: An Introduction to the Biological Collections Ontology and Related Ontologies. PLoS ONE 9(3): e89606. doi:10.1371/journal.pone.0089606).

Abstract:

The study of biodiversity spans many disciplines and includes data pertaining to species distributions and abundances, genetic sequences, trait measurements, and ecological niches, complemented by information on collection and measurement protocols. A review of the current landscape of metadata standards and ontologies in biodiversity science suggests that existing standards such as the Darwin Core terminology are inadequate for describing biodiversity data in a semantically meaningful and computationally useful way. Existing ontologies, such as the Gene Ontology and others in the Open Biological and Biomedical Ontologies (OBO) Foundry library, provide a semantic structure but lack many of the necessary terms to describe biodiversity data in all its dimensions. In this paper, we describe the motivation for and ongoing development of a new Biological Collections Ontology, the Environment Ontology, and the Population and Community Ontology. These ontologies share the aim of improving data aggregation and integration across the biodiversity domain and can be used to describe physical samples and sampling processes (for example, collection, extraction, and preservation techniques), as well as biodiversity observations that involve no physical sampling. Together they encompass studies of: 1) individual organisms, including voucher specimens from ecological studies and museum specimens, 2) bulk or environmental samples (e.g., gut contents, soil, water) that include DNA, other molecules, and potentially many organisms, especially microbes, and 3) survey-based ecological observations. We discuss how these ontologies can be applied to biodiversity use cases that span genetic, organismal, and ecosystem levels of organization. We argue that if adopted as a standard and rigorously applied and enriched by the biodiversity community, these ontologies would significantly reduce barriers to data discovery, integration, and exchange among biodiversity resources and researchers.

I want to call to your attention a great description of the current state of biodiversity data:

Assembling the data sets needed for global biodiversity initiatives remains challenging. Biodiversity data are highly heterogeneous, including information about organisms, their morphology and genetics, life history and habitats, and geographical ranges. These data almost always either contain or are linked to spatial, temporal, and environmental data. Biodiversity science seeks to understand the origin, maintenance, and function of this variation and thus requires integrated data on the spatiotemporal dynamics of organisms, populations, and species, together with information on their ecological and environmental context. Biodiversity knowledge is generated across multiple disciplines, each with its own community practices. As a consequence, biodiversity data are stored in a fragmented network of resource silos, in formats that impede integration. The means to properly describe and interrelate these different data sources and types is essential if such resources are to fulfill their potential for flexible use and re-use in a wide variety of monitoring, scientific, and policy-oriented applications [5]. (From the introduction)

Contrast that with the final claim in the abstract:

We argue that if adopted as a standard and rigorously applied and enriched by the biodiversity community, these ontologies would significantly reduce barriers to data discovery, integration, and exchange among biodiversity resources and researchers. (emphasis added)

I am very confident that both of those statements, from the introduction and from the abstract, are as true as human speakers can achieve.

However, the displacement of an unknown number of communities of practice, which vary even within disciplines, to say nothing of between disciplines, by these ontologies, seems highly unlikely. Not to mention planning for the fate of data from soon to be previous community practices.

Or perhaps I should observe that such a displacement has never happened. True, over time a community of practice may die, only to be replaced by another one but I take that as different in kind from an artificial construct that is made by one group and urged upon all others.

Think of it this way, what if the top 100 members of the biodiversity community kept their current community practices but used these ontologies as conversion targets? Followers of those various members could use their community leader’s practice as their conversion target. Reasoning it is easier to follow someone in your own community.

Rather than arguments that will outlast the ontologies that are convenient conversion targets about those ontologies, once a basis for mapping is declared, conversion to any other target becomes immeasurably easier.

Reducing the semantic friction inherent in conversion to an ontology or data format in an investment in the future.

Battling semantic friction for a conversion to an ontology or data format is an investment you will make over and over again.
Beyond Transparency

Filed under: Open Data,Open Government,Transparency — Patrick Durusau @ 1:53 pm

Beyond Transparency, edited by Brett Goldstein and Lauren Dyson.

From the webpage:

The rise of open data in the public sector has sparked innovation, driven efficiency, and fueled economic development. And in the vein of high-profile federal initiatives like Data.gov and the White House’s Open Government Initiative, more and more local governments are making their foray into the field with Chief Data Officers, open data policies, and open data catalogs.

While still emerging, we are seeing evidence of the transformative potential of open data in shaping the future of our civic life. It’s at the local level that government most directly impacts the lives of residents—providing clean parks, fighting crime, or issuing permits to open a new business. This is where there is the biggest opportunity to use open data to reimagine the relationship between citizens and government.

Beyond Transparency is a cross-disciplinary survey of the open data landscape, in which practitioners share their own stories of what they’ve accomplished with open civic data. It seeks to move beyond the rhetoric of transparency for transparency’s sake and towards action and problem solving. Through these stories, we examine what is needed to build an ecosystem in which open data can become the raw materials to drive more effective decision-making and efficient service delivery, spur economic activity, and empower citizens to take an active role in improving their own communities.

Let me list the titles for two (2) parts out of five (5):

  • PART 1 Opening Government Data
    • Open Data and Open Discourse at Boston Public Schools Joel Mahoney
    • Open Data in Chicago: Game On Brett Goldstein
    • Building a Smarter Chicago Dan X O’Neil
    • Lessons from the London Datastore Emer Coleman
    • Asheville’s Open Data Journey: Pragmatics, Policy, and Participation Jonathan Feldman
  • PART 2 Building on Open Data
    • From Entrepreneurs to Civic Entrepreneurs, Ryan Alfred, Mike Alfred
    • Hacking FOIA: Using FOIA Requests to Drive Government Innovation, Jeffrey D. Rubenstein
    • A Journalist’s Take on Open Data. Elliott Ramos
    • Oakland and the Search for the Open City, Steve Spiker
    • Pioneering Open Data Standards: The GTFS Story, Bibiana McHugh

Steve Spiker captures my concerns about efficacy of “open data” in his opening sentence:

At the center of the Bay Area lies an urban city struggling with the woes of many old, great cities in the USA, particularly those in the rust belt: disinvestment, white flight, struggling schools, high crime, massive foreclosures, political and government corruption, and scandals. (Oakland and the Search for the Open City)

It may well be that I agree with “open data,” in part because I have no real data to share. So any sharing of data is going to benefit me and whatever agenda I want to pursue.

People who are pursuing their own agendas without open data, have nothing to gain by an open playing field and more than a little to lose. Particularly if they are on the corrupt side of public affairs.

All the more reason to pursue open data in my view but with the understanding that every line of data access benefits some and penalizes others.

Take the long standing tradition of not publishing who meets with the President of the United States. Justified on the basis that the President needs open and frank advice from people who feel free to speak openly.

That’s one explanation. Another explanation is being clubby with media moguls would look inconvenient with the U.S. trade delegation be pushing a pro-media position, to the detriment of us all.

When open data is used to take down members of Congress, the White House, heads and staffs of agencies, it will truly have arrived.

Until then, open data is just whistling as it walks past a graveyard in the dark.

I first saw this in a tweet by ladyson.

Classic papers on functional languages

Filed under: Functional Programming,Programming — Patrick Durusau @ 1:08 pm

Classic papers on functional languages by Kwang Yul Seo.

An interesting collection of five (5) classic functional programming papers that don’t duplicate the list by Jim Duey here.

BTW, you may want to follow http://kwangyulseo.com/ if you are interested in functional programming.

Gephi Upgrade – Neo4j 2.0.1 Support

Filed under: Gephi,Graphs,Neo4j — Patrick Durusau @ 1:01 pm

Gephi Upgrade

From the webpage:

This plugin adds support for Neo4j graph database. You can open Neo4j 2.0.1 database directory and manipulate with graph as any other Gephi graph. You can also export any graph into Neo4j database, you can filter import or export and you can use debugging as well as lazy loading support.

That’s welcome news!

PLOS’ Bold Data Policy

Filed under: Data,Open Access,Open Data,Public Data — Patrick Durusau @ 11:32 am

PLOS’ Bold Data Policy by David Crotty.

From the post:

If you pay any attention at all to scholarly publishing, you’re likely aware of the current uproar over PLOS’ recent announcement requiring all article authors to make their data publicly available. This is a bold move, and a forward-looking policy from PLOS. It may, for many reasons, have come too early to be effective, but ultimately, that may not be the point.

Perhaps the biggest practical problem with PLOS’ policy is that it puts an additional time and effort burden on already time-short, over-burdened researchers. I think I say this in nearly every post I write for the Scholarly Kitchen, but will repeat it again here: Time is a researcher’s most precious commodity. Researchers will almost always follow the path of least resistance, and not do anything that takes them away from their research if it can be avoided.

When depositing NIH-funded papers in PubMed Central was voluntary, only 3.8% of eligible papers were deposited, not because people didn’t want to improve access to their results, but because it wasn’t required and took time and effort away from experiments. Even now, with PubMed Central deposit mandatory, only 20% of what’s deposited comes from authors. The majority of papers come from journals depositing on behalf of authors (something else for which no one seems to give publishers any credit, Kent, one more for your list). Without publishers automating the process on the author’s behalf, compliance would likely be vastly lower. Lightening the burden of the researcher in this manner has become a competitive advantage for the journals that offer this service.

While recognizing the goal of researchers to do more experiments, isn’t this reminiscent of the lack of documentation for networks and software?

That creators of networks and software want to get on with the work they enjoy, documentation not being part of that work.

The problem with the semantics of research data, much as it is with network and software semantics, it there is no one else to ask about its semantics. If researchers don’t document those semantics as they perform experiments, then they will have to spend the time at publication to gather that information together.

I sense an opportunity here for software to assist researchers in capturing semantics as they perform experiments, so that production of semantically annotated data at the end of an experiment can be largely a clerical task, subject to review by the actual researchers.

The minimal semantics that needs to be captured for different type of research will vary. That is all the more reason to research and document those semantics before anyone writes a complex monolith of semantics into which existing semantics must be shoe horned.

Reasoning if we don’t know the semantics of data, it is more cost effective to pipe it to /dev/null.

I first saw this in a tweet by ChemConnector.

March 3, 2014

Cleaning UMLS data and Loading into Graph

Filed under: Graphs,Neo4j,UMLS — Patrick Durusau @ 9:09 pm

Cleaning UMLS data and Loading into Graph by Sujit Pal.

From the post:

The little UMLS ontology I am building needs to support two basic features in its user interface – findability and navigability. I now have a reasonable solution for the findability part, and I am planning to use Neo4j (a graph database) for the navigability part.

Just to get you interested in the post, here is the outcome:

The server exposes a Web Admin client (similar to the Solr Admin client) at port 7474 (http://localhost:7474/webadmin/). The dashboard shows 2,880,385 nodes, 3,375,083 properties, 58,021,093 relationships and 653 relationship types, which matches with what we put in. (emphasis added)

Enjoy!

Data Science – Chicago

Filed under: Challenges,Data Mining,Government Data,Visualization — Patrick Durusau @ 8:19 pm

OK, I shortened the headline.

The full headline reads: Accenture and MIT Alliance in Business Analytics launches data science challenge in collaboration with Chicago: New annual contest for MIT students to recognize best data analytics and visualization ideas.: The Accenture and MIT Alliance in Business Analytics

Don’t try that without coffee in the morning.

From the post:

The Accenture and MIT Alliance in Business Analytics have launched an annual data science challenge for 2014 that is being conducted in collaboration with the city of Chicago.

The challenge invites MIT students to analyze Chicago’s publicly available data sets and develop data visualizations that will provide the city with insights that can help it better serve residents, visitors, and businesses. Through data visualization, or visual renderings of data sets, people with no background in data analysis can more easily understand insights from complex data sets.

The headline is longer than the first paragraph of the story.

I didn’t see an explanation for why the challenge is limited to:

The challenge is now open and ends April 30. Registration is free and open to active MIT students 18 and over (19 in Alabama and Nebraska). Register and see the full rule here: http://aba.mit.edu/challenge.

Find a sponsor and setup an annual data mining challenge for your school or organization.

Although I would suggest you take a pass on Bogata, Mexico City, Rio de Janeiro, Moscow, Washington, D.C. and similar places where truthful auditing could be hazardous to your health.

Or as one of my favorite Dilbert cartoons had the pointy-haired boss observing:

When you find a big pot of crazy it’s best not to stir it.

CQRS with Erlang

Filed under: Erlang,Functional Programming — Patrick Durusau @ 7:47 pm

CQRS with Erlang by Bryan Hunter.

Summary:

Bryan Hunter introduces CQRS and one of its implementations done in Erlang, outlining the areas where Erlang shines.

You will probably enjoy this presentation more after reading: Introduction to CQRS by Kanasz Robert, which reads in part:

CQRS means Command Query Responsibility Segregation. Many people think that CQRS is an entire architecture, but they are wrong. CQRS is just a small pattern. This pattern was first introduced by Greg Young and Udi Dahan. They took inspiration from a pattern called Command Query Separation which was defined by Bertrand Meyer in his book “Object Oriented Software Construction”. The main idea behind CQS is: “A method should either change state of an object, or return a result, but not both. In other words, asking the question should not change the answer. More formally, methods should return a value only if they are referentially transparent and hence possess no side effects.” (Wikipedia) Because of this we can divide a methods into two sets:

  • Commands – change the state of an object or entire system (sometimes called as modifiers or mutators).
  • Queries – return results and do not change the state of an object.

In a real situation it is pretty simple to tell which is which. The queries will declare return type, and commands will return void. This pattern is broadly applicable and it makes reasoning about objects easier. On the other hand, CQRS is applicable only on specific problems.

Demo Code for the presentation.

March 2, 2014

Theoretical CS Books Online

Filed under: Books,Computer Science — Patrick Durusau @ 9:25 pm

Theoretical CS Books Online

An awesome list of theoretical CS books at Stack Exchange, Theoretical Computer Science.

If you like the online version, be sure to acquire or recommend to your library to acquire a hard copy.

Good behavior on our part may encourage good behavior on the part of publishers.

Enjoy!

I first saw this in a tweet by Computer Science.

Data Mining with Weka (2014)

Filed under: CS Lectures,Data Mining,Weka — Patrick Durusau @ 9:17 pm

Data Mining with Weka

From the course description:

Everybody talks about Data Mining and Big Data nowadays. Weka is a powerful, yet easy to use tool for machine learning and data mining. This course introduces you to practical data mining.

The 5-week course starts on 3rd March 2014.

Apologies, somehow I missed the notice on this class.

This will be followed by More Data Mining with Weka in late April of 2014.

Based on my experience with the Weka Machine Learning course, also with Professor Witten, I recommend either one or both of these courses without reservation.

Knight News Challenge

Filed under: Challenges,Funding,News — Patrick Durusau @ 9:05 pm

Knight News Challenge

Phases of the Challenge:

Submissions (February 27 – March 18)
Feedback (March 18 – April 18)
Refinement (April 18 – 28)
Evaluation (Begins April 28)

From the webpage:

How can we strengthen the Internet for free expression and innovation?

This is an open call for ideas. We want to discover projects that make the Internet better. We believe that access to information is key to vibrant and successful communities, and we want the Internet to remain an open, equitable platform for free expression, commerce and learning. We want an Internet that fuels innovation through the creation and sharing of ideas.

We don’t have specific projects that we’re hoping to see in response to our question. Instead, we want this challenge to attract a range of approaches. In addition to technologies, we’re open to ideas focused on journalism, policy, research, education– any innovative project that results in a stronger Internet.

So we want to know what you think– what captures your imagination when you think about the Internet as a place for free expression and innovation? In June we will award $2.75 million, including $250,000 from the Ford Foundation, to support the most compelling ideas.

Breaking the strangle hold of page rank is on top of my short list. There is a great deal to be said for the “wisdom” of crowds, but one of those things is that it doesn’t respond well to the passage of time. Old material keeps racking up credibility long past its “ignore by date.”

More granular date sorting would be a strong second on my list.

What’s on your short list?

« Newer PostsOlder Posts »

Powered by WordPress