Another Word For It Patrick Durusau on Topic Maps and Semantic Diversity

January 23, 2014

Stardog 2.1 Hits Scalability Breakthrough

Filed under: RDF,Stardog — Patrick Durusau @ 5:41 pm

Stardog 2.1 Hits Scalability Breakthrough

From the post:

The new release (2.1) of Stardog, a leading RDF database, hits new scalability heights with a 50-fold increase over previous versions. Using commodity server hardware at the $10,000 price point, Stardog can manage, query, search, and reason over datasets as large as 50B RDF triples.

The new scalability increases put Stardog into contention for the largest semantic technology, linked data, and other graph data enterprise projects. Stardog’s unique feature set, including reasoning and integrity constraint validation, at large scale means it will increasingly serve as the basis for complex software projects.

A 50-fold increase in performance! That’s impressive!

The post points to Kendall Clark’s blog for the details.

As you may be guessing, better hashing and memory usage were some of the major keys to the speedup.

The Mole

Filed under: Cheminformatics,Education — Patrick Durusau @ 3:29 pm

The Mole

From the homepage:

The Mole is the Royal Society of Chemistry’s magazine for students, and anyone inspired to dig deeper into chemistry.

In the latest issue (as of today):

Find out how chemistry plays a central role in revealing how our ancestors once lived • Discover how lucrative markets are found in leftover lobster • Make your own battery from the contents of your fruit bowl • What did Egyptian mummies have for dinner? • How to control the weather so it rains where we need it to • Excavate the facts about a chemist working as an archaeologist • Discover how chemistry can reveal secrets hidden in art

Of course there is a wordsearch puzzle and a chemical acrostic on the final page.

Always interesting to learn new information and to experience “other” views of the world. May lessen your chances of answering a client before they finish outlining their problem.

I first learned of the Mole in a tweet by ChemistryWorld.

…Textbooks for $0 [Digital Illiterates?]

Filed under: Books,Education,Publishing — Patrick Durusau @ 3:15 pm

OpenStax College Textbooks for $0

From the about page:

OpenStax College is a nonprofit organization committed to improving student access to quality learning materials. Our free textbooks are developed and peer-reviewed by educators to ensure they are readable, accurate, and meet the scope and sequence requirements of your course. Through our partnerships with companies and foundations committed to reducing costs for students, OpenStax College is working to improve access to higher education for all.

OpenStax College is an initiative of Rice University and is made possible through the generous support of several philanthropic foundations. …

Available now:

  • Anatomy and Physiology
  • Biology
  • College Physics
  • Concepts of Biology
  • Introduction to Sociology
  • Introductory Statistics

Coming soon:

  • Chemistry
  • Precalculus
  • Principles of Economics
  • Principles of Macroeconomics
  • Principles of Microeconomics
  • Psychology
  • U.S. History

Check to see if I missed any present or forthcoming texts on data science. No, I didn’t see any either.

I looked at the Introduction to Sociology, which has a chapter on research methods, but no opportunity for students to experience data methods. Such as Statwing’s coverage of the General Social Survey (GSS), which I covered in Social Science Dataset Prize!

Data science should not be an aside or extra course any more than language literacy is a requirement for an education.

Consider writing or suggesting edits to subject textbooks to incorporate data science. Solely data science books will be necessary as well, just like there are advanced courses in English Literature.

Let’s not graduate digital illiterates. For their sake and ours.

I first saw this in a tweet by Michael Peter Edson.

$1 Billion Bet, From Another Point of View

Filed under: Probability,Statistics — Patrick Durusau @ 2:20 pm

What’s Warren Buffett’s $1 Billion Basketball Bet Worth? by Corey Chivers.

From the post:

A friend of mine just alerted me to a story on NPR describing a prize on offer from Warren Buffett and Quicken Loans. The prize is a billion dollars (1B USD) for correctly predicting all 63 games in the men’s Division I college basketball tournament this March. The facebook page announcing the contest puts the odds at 1:9,223,372,036,854,775,808, which they note “may vary depending upon the knowledge and skill of entrant”.
….

Corey has some R code for you to do your own analysis based on the skill level of the bettors.

But, while I was thinking about yesterday’s post: Want to win $1,000,000,000 (yes, that’s one billion dollars)?, it occurred to me that the common view of this wager is from a potential winner.

What does this bet look like from Warren Buffet/Quicken Loan point of view?

From the rules:

To be eligible for the $1 billion grand prize, entrants must be 21 years of age, a U.S. citizen and one of the first 10 million to register for the contest. At its sole discretion, Quicken Loans reserves the right and option to expand the entry pool to a larger number of entrants. Submissions will be limited to a total of one per household. (emphasis added)

Only ten million outcomes out of 9,223,372,036,854,775,808 outcomes or 0.00000000010842% of the possible outcomes will be wagered.

$1 Billion is a lot to wager but with wagered outcomes at 0.00000000010842% that leaves 99.9999999998158% of outcomes not wagered.

Remember in multi-player games to consider not only your odds but the odds of others. only the odds that interest you but the odds facing other players.

Thoughts on the probability the tournament outcome will be in the outcomes not wagered?

Provenance Reconstruction Challenge 2014

Filed under: Provenance,Semantic Web,W3C — Patrick Durusau @ 12:06 pm

Provenance Reconstruction Challenge 2014

Schedule

  • February 17, 2014 Test Data released
  • May 18, 2014 Last day to register for participation
  • May 19, 2014 Challenge Data released
  • June 13, 2014 Provenance Reconstruction Challenge Event at Provenance Week – Cologne Germany

From the post:

While the use of version control systems, workflow engines, provenance aware filesystems and databases, is growing there is still a plethora of data that lacks associated data provenance. To help solve this problem, a number of research groups have been looking at reconstructing the provenance of data using the computational environment in which it resides. This research however is still very new in the community. Thus, the aim the Provenance Reconstruction Challenge is to help spur research into the reconstruction of provenance by providing a common task and datasets for experimentation.

The Challenge

Challenge participants will receive an open data set and corresponding provenance graphs (in W3C PROV formant). They will then have several months to work with the data trying to reconstruct the provenance graphs from the open data set. 3 weeks before the challenge face-2-face event the participants will receive a new data set and a gold standard provenance graph. Participants are asked to register before the challenge dataset is released and to prepare a short description of their system to be placed online after the event.

The Event

At the event, we will have presentations of the results and the systems as well as a group conversation around the techniques used. The event will result in a joint report about techniques for reproducing provenance and paths forward.

For further information on the W3C PROV format:

Provenance Working Group

PROV at Semantic Web Wiki.

PROV Implementation Report (60 implementations as of 30 April 2013)

I first saw this in a tweet by Paul Groth.

Hash-URIs for Verifiable, Immutable, and Permanent Digital Artifacts

Filed under: Identification,Identifiers,RDF,Semantic Web — Patrick Durusau @ 11:52 am

Hash-URIs for Verifiable, Immutable, and Permanent Digital Artifacts by Tobias Kuhn and Michel Dumontier.

Abstract:

To make digital resources on the web verifiable, immutable, and permanent, we propose a technique to include cryptographic hash values in URIs. We show how such hash-URIs can be used for approaches like nanopublications to make not only specific resources but their entire reference trees verifiable. Digital resources can be identified not only on the byte level but on more abstract levels, which means that resources keep their hash values even when presented in a different format. Our approach sticks to the core principles of the web, namely openness and decentralized architecture, is fully compatible with existing standards and protocols, and can therefore be used right away. Evaluation of our reference implementations shows that these desired properties are indeed accomplished by our approach, and that it remains practical even for very large files.

I rather like the author’s summary of their approach:

our proposed approach boils down to the idea that references can be made completely unambiguous and veri able if they contain a hash value of the referenced digital artifact.

Hash-URIs (assuming proper generation) would be completely unambiguous and verifiable for digital artifacts.

However, the authors fail to notice two important issues with Hash-URIs:

  1. Hash-URIs are not human readable.
  2. Not being human readable means that mappings between Hash-URIs and other references to digital artifacts will be fragile and hard to maintain.

For example,

In prose an author will not say, “As found by “http://example.org/r1.RA5AbXdpz5DcaYXCh9l3eI9ruBosiL5XDU3rxBbBaUO70” (from the article).

In some publishing styles, authors will say: “…as a new way of scientifi c publishing [8].”

In other styles, authors will say: “Computable functions are therefore those “calculable by finite means” (Turing, 1936: 230).”

That is to say of necessity there will be a mapping between the unambiguous and verifiable reference (UVR) and the ones used by human authors/readers.

Moreover, should the mapping between UVRs and their human consumable equivalents be lost, recovery is possible but time consuming.

The author’s go to some lengths to demonstrate the use of Hash-URIs with RDF files. RDF is one approach among many to digital artifacts.

If the mapping issues between Hash-URIs and other identifiers can be addressed, a more general approach to digital artifacts would make this proposal more viable.

I first saw this in a tweet by Tobias Kuhn.

January 22, 2014

Easy data maps with R: the choroplethr package

Filed under: Maps,R — Patrick Durusau @ 8:16 pm

Easy data maps with R: the choroplethr package by David Smith.

From the post:

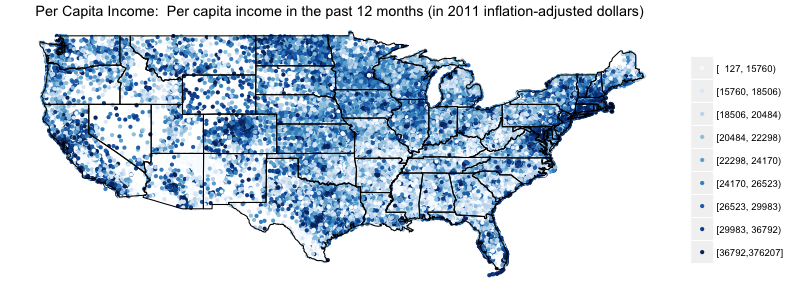
Choropleth maps are a popular way of representing spatial or geographic data, where a statistic of interest (say, income, voting results or crime rate) are color-coded by region. R includes all of the necessary tools for creating choropleth maps, but Trulia's Ari Lamstein has made the process even easier with the new choroplethr package now available on github. With couple of lines of code, you can easily convert a data frame of values coded by country, state, county or zip code into a choropleth like this:

us map

This sounds like a great tool for the General Social Survey data in Social Science Dataset Prize!

Build Your Own Custom Lucene Query And Scorer

Filed under: Lucene,Search Engines — Patrick Durusau @ 8:03 pm

Build Your Own Custom Lucene Query And Scorer by Doug Turnbull.

From the post:

Every now and then we’ll come across a search problem that can’t simply be solved with plain Solr relevancy. This usually means a customer knows exactly how documents should be scored. They may have little tolerance for close approximations of this scoring through Solr boosts, function queries, etc. They want a Lucene-based technology for text analysis and performant data structures, but they need to be extremely specific in how documents should be scored relative to each other.

Well for those extremely specialized cases we can prescribe a little out-patient surgery to your Solr install – building your own Lucene Query.

This Is The Nuclear Option

Before we dive in, a word of caution. Unless you just want the educational experience, building a custom Lucene Query should be the “nuclear option” for search relevancy. It’s very fiddly and there are many ins-and-outs. If you’re actually considering this to solve a real problem, you’ve already gone down the following paths:

Not for the faint of heart!

On the other hand, Doug’s list of options to try before writing a custom Lucene query and scorer makes a great checklist of tweaking options.

You could stop there and learn a great deal. Or you can opt to continue for what Doug calls “the educational experience.”

My Mind

Filed under: Maps,Mind Maps — Patrick Durusau @ 7:52 pm

My Mind by Ondřej Žára.

From the webpage:

My Mind is a web application for creating and managing Mind maps. It is free to use and you can fork its source code. It is distributed under the terms of the MIT license.

Be sure to check out the Mind map features version. (Check out the documentation for basic commands.)

I first saw this in Nat Torkington’s Four short links: 22 January 2014.

Google shows missing search terms

Filed under: Search Engines,Searching — Patrick Durusau @ 7:40 pm

Google shows missing search terms by Karen Blakeman.

From the post:

Several weeks ago I noticed that Google was displaying the terms it had dropped from your search as ‘Missing’. Google started routinely ignoring selected search terms towards the end of 2011 (see http://www.rba.co.uk/wordpress/2011/11/08/dear-google-stop-messing-with-my-search/). Google’s response to the outcry from searchers was to introduce the Verbatim search option. However, there was no way of checking whether all of your terms appeared in a result other than viewing the whole page. Irritating, to say the least, if you found that the top 10 results did not include all of your keywords.

Fast forward to December 2013, and some people started seeing results lists that showed missing keywords as strikethroughs. I saw them for a few days and then, just as I was preparing a blog posting on the feature, they disappeared! I assumed that they were one of Google’s live experiments never to be seen again but it seems they are back. Two people contacted me today to say that they are seeing strikethroughs on missing terms. I ran my test searches again and, yes, I’m seeing them as well.

I ran the original search that prompted my November 2011 article (parrots heron island Caversham UK) and included -site:rba.co.uk in the strategy to exclude my original blog postings. Sure enough, the first two results were missing parrots and had “Missing parrots” underneath their entry in the list.

At least as of today, try: parrots heron island Caversham UK -site:rba.co.uk in Google and you will see the same result.

A welcome development, although more transparency would be very welcome.

A non-transparent search process isn’t searching. It’s guessing.

Want to win $1,000,000,000 (yes, that’s one billion dollars)?

Want to win $1,000,000,000 (yes, that’s one billion dollars)? by Ann Drobnis.

The offer is one billion dollars for picking the winners of every game in the NCAA men’s basketball tournament in the Spring of 2014.

Unfortunately, none of the news stories I saw had links back to any authentic information from Quicken Loans and Berkshire Hathaway about the offer.

After some searching I found: Win a Billion Bucks with the Quicken Loans Billion Dollar Bracket Challenge by Clayton Closson, on January 21, 2014 on the Quicken Loans blog. (As far as I can tell it is an authentic post on the QL website.)

From that post:

You could be America’s next billionaire if you’re the grand prize winner of the Quicken Loans Billion Dollar Bracket Challenge. You read that right: one billion. Not one million. Not one hundred million. Not five hundred million. One billion U.S. dollars.

All you have to do is pick a perfect tournament bracket for the upcoming 2014 tournament. That’s it. Guess all the winners of all the games correctly, and Quicken Loans, along with Berkshire Hathaway, will make you a billionaire. The official press release is below. The contest starts March 3, 2014, so we’ll soon have all the info on how and when to enter your perfect bracket.

Good luck, my friends. This is your chance to play in perhaps the biggest sweepstakes in U.S. history. It’s your chance for a billion.

Oh, and by the way, the 20 closest imperfect brackets will win a cool hundred grand to put toward their home (or new home). Plus, in conjunction with the sweepstakes, Quicken Loans will donate $1 million to Detroit and Cleveland nonprofits to help with education of inner city youth.

So, to recap: If you’re perfect, you’ll win a billion. If you’re not perfect, you could win $100,000. The entry period begins Monday, March 3, 2014 and runs until Wednesday, March 19, 2014. Stay tuned on how to enter.

Contest updates at: Facebook.com/QuickenLoans.

The odds against winning are absurd but this has all the markings of a big data project. Historical data, current data on the teams and players, models, prior outcomes to test your models, etc.

I wonder if Watson likes basketball?

Social Science Dataset Prize!

Filed under: Contest,Dataset,Social Sciences,Socioeconomic Data,Statistics — Patrick Durusau @ 5:49 pm

Statwing is awarding $1,500 for the best insights from its massive social science dataset by Derrick Harris.

All submissions are due through the form on this page by January 30 at 11:59pm PST.

From the post:

Statistics startup Statwing has kicked off a competition to find the best insights from a 406-variable social science dataset. Entries will be voted on by the crowd, with the winner getting $1,000, second place getting $300 and third place getting $200. (Check out all the rules on the Statwing site.) Even if you don’t win, though, it’s a fun dataset to play with.

The data comes from the General Social Survey and dates back to 1972. It contains variables ranging from sex to feelings about education funding, from education level to whether respondents think homosexual men make good parents. I spent about an hour slicing and dicing variable within the Statwing service, and found some at least marginally interesting stuff. Contest entries can use whatever tools they want, and all 79 megabytes and 39,662 rows are downloadable from the contest page.

Time is short so you better start working.

The rules page, where you make your submission, emphasizes:

Note that this is a competition for the most interesting finding(s), not the best visualization.

Use any tool or method, just find the “most interesting finding(s)” as determined by crowd vote.

On the dataset:

Every other year since 1972, the General Social Survey (GSS) has asked thousands of Americans 90 minutes of questions about religion, culture, beliefs, sex, politics, family, and a lot more. The resulting dataset has been cited by more than 14,000 academic papers, books, and dissertations—more than any except the U.S. Census.

I can’t decide if Americans have more odd opinions now than before. 😉

Maybe some number crunching will help with that question.

Optimizing Cypher Queries in Neo4j

Filed under: Cypher,Graphs,Neo4j — Patrick Durusau @ 5:33 pm

Optimizing Cypher Queries in Neo4j by Mark Needham and Wes Freeman.

Thursday January 23 10:00 PST / 19:00 CET

Description:

Mark and Wes will talk about Cypher optimization techniques based on real queries as well as the theoretical underlying processes. They’ll start from the basics of “what not to do”, and how to take advantage of indexes, and continue to the subtle ways of ordering MATCH/WHERE/WITH clauses for optimal performance as of the 2.0.0 release.

OK, I’m registered. But this is at 7 AM on the East Coast of the US. I will bring my own coffee but have high expectations. Just saying. 😉

Correction: East Coast today at 1:00 P.M. local. I’m not a very good clock. 😉

Empowering Half a Billion Users For Free –
Would You?

Filed under: Excel,Hadoop YARN,Hortonworks,Microsoft — Patrick Durusau @ 5:24 pm

How To Use Microsoft Excel to Visualize Hadoop Data by Saptak Sen.

From the post:

Microsoft and Hortonworks have been working together for over two years now with the goal of bringing the power of Big Data to a billion people. As a result of that work, today we announced the General Availability of HDP 2.0 for Windows with the full power of YARN.

There are already over half a billion Excel users on this planet.

So, we have put together a short tutorial on the Hortonworks Sandbox where we walk through the end-to-end data pipeline using HDP and Microsoft Excel in the shoes of a data analyst at a financial services firm where she:

  • Cleans and aggregates 10 years of raw stock tick data from NYSE
  • Enriches the data model by looking up additional attributes from Wikipedia
  • Creates an interactive visualization on the model

You can find the tutorial here.

As part of this process you will experience how simple it is to integrate HDP with the Microsoft Power BI platform.

This integration is made possible by the community work to design and implement WebHDFS, an open REST API in Apache Hadoop. Microsoft used the API from Power Query for Excel to make the integration to Microsoft Business Intelligence platform seamless.

Happy Hadooping!!!

Opening up Hadoop to a half of billion users can’t do anything but drive the development of the Hadoop ecosystem.

Which will in turn return more benefits to the Excel user community, which will drive usage of Excel.

That’s what I call a smart business strategy.

You?

PS: Where are there similar strategies possible for subject identity?

Composable languages for bioinformatics: the NYoSh experiment

Filed under: Open Access,Publishing — Patrick Durusau @ 4:35 pm

Composable languages for bioinformatics: the NYoSh experiment by Manuele Simi, Fabien Campagne​. (Simi M, Campagne F. (2014) Composable languages for bioinformatics: the NYoSh experiment. PeerJ 2:e241 http://dx.doi.org/10.7717/peerj.241)

Abstract:

Language WorkBenches (LWBs) are software engineering tools that help domain experts develop solutions to various classes of problems. Some of these tools focus on non-technical users and provide languages to help organize knowledge while other workbenches provide means to create new programming languages. A key advantage of language workbenches is that they support the seamless composition of independently developed languages. This capability is useful when developing programs that can benefit from different levels of abstraction. We reasoned that language workbenches could be useful to develop bioinformatics software solutions. In order to evaluate the potential of language workbenches in bioinformatics, we tested a prominent workbench by developing an alternative to shell scripting. To illustrate what LWBs and Language Composition can bring to bioinformatics, we report on our design and development of NYoSh (Not Your ordinary Shell). NYoSh was implemented as a collection of languages that can be composed to write programs as expressive and concise as shell scripts. This manuscript offers a concrete illustration of the advantages and current minor drawbacks of using the MPS LWB. For instance, we found that we could implement an environment-aware editor for NYoSh that can assist the programmers when developing scripts for specific execution environments. This editor further provides semantic error detection and can be compiled interactively with an automatic build and deployment system. In contrast to shell scripts, NYoSh scripts can be written in a modern development environment, supporting context dependent intentions and can be extended seamlessly by end-users with new abstractions and language constructs. We further illustrate language extension and composition with LWBs by presenting a tight integration of NYoSh scripts with the GobyWeb system. The NYoSh Workbench prototype, which implements a fully featured integrated development environment for NYoSh is distributed at http://nyosh.campagnelab.org.

In the discussion section of the paper the authors concede:

We expect that widespread use of LWB will result in a multiplication of small languages, but in a manner that will increase language reuse and interoperability, rather than in the historical language fragmentation that has been observed with traditional language technology.

Whenever I hear projections about the development of languages I am reminded the inventors of “SCSI” thought it should be pronounced “sexy,” whereas others preferred “scuzzi.” Doesn’t have the same ring to it does it?

I am all in favor of domain specific languages (DSLs), but at the same time, am mindful that undocumented languages are in danger of becoming “dead” languages.

Wikidata in 2014 [stable identifiers]

Filed under: Identifiers,Merging,Wikidata — Patrick Durusau @ 3:00 pm

Wikidata in 2014

From the development plans for Wikidata in 2014, it looks like a busy year.

There are a number of interesting work items but one in particular caught my attention:

Merges and redirects

bugzilla:57744 and bugzilla:38664

When two different items about the same topic are created they can be merged. Labels, descriptions, aliases, sitelinks and statements are merged if they do not conflict. The item that is left empty can then be turned into a redirect to the other. This way, Wikidata IDs can be regarded as stable identifiers by 3rd-parties.

As more data sets come online, preserving “stable identifiers” from each data set is going to be important. You can’t know in advance which data set a particular researcher may have used as a source of identifiers.

Here of course they are talking about “stable identifiers” inside of Wikidata.

In principle though, I don’t see any reason we can treat “foreign” identifiers as stable.

You?

January 21, 2014

…Desperately Seeking Data Integration

Filed under: Data Integration,Government,Government Data,Marketing,Topic Maps — Patrick Durusau @ 8:30 pm

Why the US Government is Desperately Seeking Data Integration by David Linthicum.

From the post:

“When it comes to data, the U.S. federal government is a bit of a glutton. Federal agencies manage on average 209 million records, or approximately 8.4 billion records for the entire federal government, according to Steve O’Keeffe, founder of the government IT network site, MeriTalk.”

Check out these stats, in a December 2013 MeriTalk survey of 100 federal records and information management professionals. Among the findings:

  • Only 18 percent said their agency had made significant progress toward managing records and email in electronic format, and are ready to report.
  • One in five federal records management professionals say they are “completely prepared” to handle the growing volume of government records.
  • 92 percent say their agency “has a lot of work to do to meet the direction.”
  • 46 percent say they do not believe or are unsure about whether the deadlines are realistic and obtainable.
  • Three out of four say the Presidential Directive on Managing Government Records will enable “modern, high-quality records and information management.”

I’ve been working with the US government for years, and I can tell that these facts are pretty accurate. Indeed, the paper glut is killing productivity. Even the way they manage digital data needs a great deal of improvement.

I don’t doubt a word of David’s post. Do you?

What I do doubt is the ability of the government to integrate its data. At least unless and until it makes some fundamental choices about the route it will take to data integration.

First, replacement of existing information systems is a non-goal. Unless that is an a prioriassumption, the politics, both on Capital Hill and internal to any agency, program, etc. will doom a data integration effort before it begins.

The first non-goal means that the ROI of data integration must be high enough to be evident even with current systems in place.

Second, integration of the most difficult cases is not the initial target for any data integration project. It would be offensive to cite all the “boil the ocean” projects that have failed in Washington, D.C. Let’s just agree that judicious picking of high value and reasonable effort integration cases are a good proving ground.

Third, the targets and costs for meeting those targets of data integration, along with expected ROI, will be agreed upon by all parties before any work starts. Avoidance of mission creep is essential to success. Not to mention that public goals and metrics will enable everyone to decide if the goals have been meet.

Fourth, employment of traditional vendors, unemployed programmers, geographically dispersed staff, etc. are also non-goals of the project. With the money that can be saved by robust data integration, departments can feather their staffs as much as they like.

If you need proof of the fourth requirement, consider the various Apache projects that are now the the underpinnings for “big data” in its many forms.

It is possible to solve the government’s data integration issues. But not without some hard choices being made up front about the project.

Sorry, forgot one:

Fifth, the project leader should seek a consensus among the relevant parties but ultimately has the authority to make decisions for the project. If every dispute can have one or more parties running to their supervisor or congressional backer, the project is doomed before it starts. The buck stops with the project manager and no where else.
Berkeley Ecoinformatics Engine

Filed under: Ecoinformatics,Environment — Patrick Durusau @ 7:58 pm

Berkeley Ecoinformatics Engine – An open API serving UC Berkeley’s Natural History Data

From the News page:

We are thrilled to release an early version of the Berkeley Ecoinformatics Engine API! We have a lot of data and tools that we’ll be pushing out in future releases so keep an eye out as we are just getting started.

To introduce eco-minded developers to this new resource, we are serving up two key data sets that will be available for this weekend’s EcoHackSF:

For this hackathon, we are encouraging participants to help us document our changing environment. Here’s the abstract:

Wieslander Vegetation Mapping Project – Data from the 1920s needs an update

During the 1920’s and 30’s Albert Everett Wieslander and his team at USGS compiled an amazing and comprehensive dataset known as the Wieslander Vegetation Mapping Project. The data collected includes landscape photos, species inventories, plot maps, and vegetation maps covering most of California. Several teams have been digitizing this valuable historic data over the last ten years, and much of it is now complete. We will be hosting all of the finalized data in our Berkeley Ecoinformatics Engine.

Our task for the EcoHack community will be to develop a web/mobile application that will allow people to view and find the hundreds of now-geotagged landscape photos, and reshoot the same scene today. These before and after images will provide scientists and enthusiasts with an invaluable view of how these landscapes have changed over the last century.

Though this site is focused on the development of the EcoEngine, this project is a part of a larger effort to address the challenge of identifying the interactions and feedbacks between different species and their environment. It will promote the type of multi-disciplinary building that will lead to breakthroughs in our understanding of the biotic input and response to global change. The EcoEngine will serve to unite previously disconnected perspectives from paleo-ecologists, population biologists, and ecologists and make possible the testing of predictive models of global change, a critical advance in making the science more rigorous. Visit globalchange.berkeley.edu to learn more.

Hot damn! Another project trying to reach across domain boundaries and vocabularies to address really big problems.

Maybe the original topic maps effort was just a little too early.

Geospatial (distance) faceting…

Filed under: Facets,Geographic Data,Georeferencing,Lucene — Patrick Durusau @ 7:32 pm

Geospatial (distance) faceting using Lucene’s dynamic range facets by Mike McCandless.

From the post:

There have been several recent, quiet improvements to Lucene that, taken together, have made it surprisingly simple to add geospatial distance faceting to any Lucene search application, for example:

  < 1 km (147)
  < 2 km (579)
  < 5 km (2775)

Such distance facets, which allow the user to quickly filter their search results to those that are close to their location, has become especially important lately since most searches are now from mobile smartphones.

In the past, this has been challenging to implement because it’s so dynamic and so costly: the facet counts depend on each user’s location, and so cannot be cached and shared across users, and the underlying math for spatial distance is complex.

But several recent Lucene improvements now make this surprisingly simple!

As always, Mike is right on the edge so wait for Lucene 4.7 to try his code out or download the current source.

Distance might not be the only consideration. What if you wanted the shortest distance that did not intercept a a known patrol? Or known patrol within some window of variation.

Distance is still going to be a factor but the search required maybe more complex than just distance.

“May I?” on the Google Cloud Platform

Filed under: Cloud Computing,Google Cloud — Patrick Durusau @ 7:17 pm

Learn about Permissions on Google Cloud Platform by Jeff Peck.

From the post:

Do your co-workers ask you “How should I set up Google Cloud Platform projects for my developers?” Have you wondered about the difference between the Project Id, the Project Number and the App Id? Do you know what a service account is and why you need one? Find the answers to these and many other questions in a newly published guide to understanding permissions, projects and accounts on Google Cloud Platform.

Especially if you are just getting started, and are still sorting out the various concepts and terminology, this is the guide for you. The article includes explanations, definitions, best practices and links to the relevant documentation for more details. It’s a good place to start when learning to use Cloud Platform.

It’s not exciting reading, but it may keep you from looking real dumb when the bill for Google cloud services comes in. Kinda hard to argue that Google configured your permissions incorrectly.

Be safe, read about permissions before your potential successor does.

HDP 2.0 for Windows is GA

Filed under: Hadoop YARN,Hortonworks — Patrick Durusau @ 7:05 pm

HDP 2.0 for Windows is GA by John Kreisa.

From the post:

We are excited to announce that the Hortonworks Data Platform 2.0 for Windows is publicly available for download. HDP 2 for Windows is the only Apache Hadoop 2.0 based platform that is certified for production usage on Windows Server 2008 R2 and Windows Server 2012 R2.

With this release, the latest in community innovation on Apache Hadoop is now available across all major Operating Systems. HDP 2.0 provides Hadoop coverage for more than 99% of the enterprises in the world, offering the most flexible deployment options from On-Premise to a variety of cloud solutions.

Unleashing YARN and Hadoop 2 on Windows

HDP 2.0 for Windows is a leap forward as it brings the power of Apache Hadoop YARN to Windows. YARN enables a user to interact with all data in multiple ways simultaneously – for instance making use of both realtime and batch processing – making Hadoop a true multi-use data platform and allowing it to take its place in a modern data architecture.

Excellent!

BTW, Microsoft is working with Hortonworks to make sure Apache Hadoop works seamlessly with Microsoft Windows and Azure.

I think they call that interoperability. Or something like that. 😉

Why Clojure?

Filed under: Clojure,Programming — Patrick Durusau @ 6:55 pm

Why Clojure?

From the post:

On 1/14 Brandon Bloom stopped by Axial HQ to teach us all a little bit about his favorite functional language: Clojure. Brandon’s “slides” are available via github.

One of the coolest parts of the Lyceum was Brandon’s discussion of Clojure’s entirely immutable data-structures through structural sharing, along with his practical shopping cart demonstration. This type of data-structure seems particularly adept for modeling problems with many possible trees, such as constraint satisfaction problems.

If you’re ready to start using structural sharing in your own programming language, check out Brandon’s thread on StackOverflow.

Have you ever thought about “merging” as a constraint satisfaction problem? 😉

Bring strong coffee and find a comfortable seat.

Wellcome Images

Filed under: Data,Data Integration,Library,Museums — Patrick Durusau @ 5:47 pm

Thousands of years of visual culture made free through Wellcome Images

From the post:

We are delighted to announce that over 100,000 high resolution images including manuscripts, paintings, etchings, early photography and advertisements are now freely available through Wellcome Images.

Drawn from our vast historical holdings, the images are being released under the Creative Commons Attribution (CC-BY) licence.

This means that they can be used for commercial or personal purposes, with an acknowledgement of the original source (Wellcome Library, London). All of the images from our historical collections can be used free of charge.

The images can be downloaded in high-resolution directly from the Wellcome Images website for users to freely copy, distribute, edit, manipulate, and build upon as you wish, for personal or commercial use. The images range from ancient medical manuscripts to etchings by artists such as Vincent Van Gogh and Francisco Goya.

The earliest item is an Egyptian prescription on papyrus, and treasures include exquisite medieval illuminated manuscripts and anatomical drawings, from delicate 16th century fugitive sheets, whose hinged paper flaps reveal hidden viscera to Paolo Mascagni’s vibrantly coloured etching of an ‘exploded’ torso.

Other treasures include a beautiful Persian horoscope for the 15th-century prince Iskandar, sharply sketched satires by Rowlandson, Gillray and Cruikshank, as well as photography from Eadweard Muybridge’s studies of motion. John Thomson’s remarkable nineteenth century portraits from his travels in China can be downloaded, as well a newly added series of photographs of hysteric and epileptic patients at the famous Salpêtrière Hospital

Semantics or should I say semantic confusion is never far away. While viewing an image of Gladstone as Scrooge:

Gladstone

When “search by keyword” offered “colonies,” I assumed either the colonies of the UK at the time.

Imagine my surprise when among other images, Wellcome Images offered:

petri dish

The search by keywords had found fourteen petri dish images, three images of Batavia, seven maps of India (salt, leporsy), one half naked woman being held down, and the Gladstone image from earlier.

About what one expects from search these days but we could do better. Much better.

I first saw this in a tweet by Neil Saunders.

Extracting Insights – FBO.Gov

Filed under: Government Data,Hadoop,NLTK,Pig,Python — Patrick Durusau @ 3:20 pm

Extracting Insights from FBO.Gov data – Part 1

Extracting Insights from FBO.Gov data – Part 2

Extracting Insights from FBO.Gov data – Part 3

Dave Fauth has written a great three part series on extracting “insights” from large amounts of data.

From the third post in the series:

Earlier this year, Sunlight foundation filed a lawsuit under the Freedom of Information Act. The lawsuit requested solication and award notices from FBO.gov. In November, Sunlight received over a decade’s worth of information and posted the information on-line for public downloading. I want to say a big thanks to Ginger McCall and Kaitlin Devine for the work that went into making this data available.

In the first part of this series, I looked at the data and munged the data into a workable set. Once I had the data in a workable set, I created some heatmap charts of the data looking at agencies and who they awarded contracts to. In part two of this series, I created some bubble charts looking at awards by Agency and also the most popular Awardees.

In the third part of the series, I am going to look at awards by date and then displaying that information in a calendar view. Then we will look at the types of awards.

For the date analysis, we are going to use all of the data going back to 2000. We have six data files that we will join together, filter on the ‘Notice Type’ field, and then calculate the counts by date for the awards. The goal is to see when awards are being made.

The most compelling lesson from this series is that data doesn’t always easily give up its secrets.

If you make it to the end of the series, you will find the government, on occasion, does the right thing. I’ll admit it, I was very surprised. 😉

Topincs Videos

Filed under: Topic Map Software,Topic Maps,Topincs — Patrick Durusau @ 2:48 pm

Robert Cerny is creating a series of videos on using Topincs.

For best results you will need a copy of Topincs: download.

Videos include:

If you are not familiar with the interface, it may take a little while to become comfortable with it, but the videos should help in that regard.

In particular I like length of the videos. Show one thing and one thing only.

That allows a new user to gain confidence with that one thing and then to move onto another.

The videos would be even more useful if there was a set order with test data for the first ones. So that people would not have to guess at random which one they should see first.

Update: How to setup the PHP programming interface in Topincs Added 22 Jan. 2014

Yet Another Giant List of Digitised Manuscript Hyperlinks

Filed under: British Library,Digital Library,Manuscripts — Patrick Durusau @ 11:41 am

Yet Another Giant List of Digitised Manuscript Hyperlinks

From the post:

A new year, a newly-updated list of digitised manuscript hyperlinks! This master list contains everything that has been digitised up to this point by the Medieval and Earlier Manuscripts department, complete with hyperlinks to each record on our Digitised Manuscripts site. We’ll have another list for you in three months; you can download the current version here: Download BL Medieval and Earlier Digitised Manuscripts Master List 14.01.13. Have fun!

I count 921 digitized manuscripts, with more on the way!

A highly selective sampling:

That leaves 917 manuscripts for you to explore! With more on the way!

CAUTION! When I try to use Chrome on Ubuntu to access these links, I get: “This webpage has a redirect loop.” The same links work fine in Firefox. I have posted a comment about this issue to the post. Will update when I have more news. If your experience is same/different let me know. Just curious.

Enjoy!

PS:

Vote by midnight January 26, 2014 to promote the Medieval Manuscripts Blog.

Vote for Medieval Manuscripts Blog in the UK Blog Awards

VisIVO Contest 2014

Filed under: Astroinformatics,Visualization — Patrick Durusau @ 10:14 am

VisIVO Contest 2014

Entries accepted: January 1st through April 30th 2014.

From the post:

This competition is an international call to use technologies provided by the VisIVO Science Gateway to produce images and movies from multi-dimensional datasets coming either from observations or numerical simulations. The competition is open to scientists and citizens alike who are investigating datasets related to astronomy or other fields, e.g., life sciences or physics. Entries will be accepted from January 1st ­ April 30th 2014 and prizes will be awarded! More information is available at http://visivo.oact.inaf.it:8080/visivo-contest or https://www.facebook.com/visivocontest2014.

Prizes:

  • 1st prize : 2500 €
  • 2nd prize : 500 €

There are basic and advanced tutorials.

The detailed rules.

You won’t be able to quite your day job if you win, but even entering may bring your visualization skills some needed attention.

January 20, 2014

Timeline of the Far Future

Filed under: Graphics,History,Timelines,Visualization — Patrick Durusau @ 6:37 pm

Timeline of the Far Future Randy Krum.

Randy has uncovered a timeline from the BBC that predicts the future in 1,000, 10,000, one million years and beyond.

It’s big and will take time to read.

I suspect the accuracy of the predictions are on par with a similar time line pointing backwards. 😉

But it’s fun to speculate about history, past, future, alternative, or fantasy histories.

Data with a Soul…

Filed under: Data,Social Networks,Social Sciences — Patrick Durusau @ 5:33 pm

Data with a Soul and a Few More Lessons I Have Learned About Data by Enrico Bertini.

From the post:

I don’t know if this is true for you but I certainly used to take data for granted. Data are data, who cares where they come from. Who cares how they are generated. Who cares what they really mean. I’ll take these bits of digital information and transform them into something else (a visualization) using my black magic and show it to the world.

I no longer see it this way. Not after attending a whole three days event called the Aid Data Convening; a conference organized by the Aid Data Consortium (ARC) to talk exclusively about data. Not just data in general but a single data set: the Aid Data, a curated database of more than a million records collecting information about foreign aid.

The database keeps track of financial disbursements made from donor countries (and international organizations) to recipient countries for development purposes: health and education, disasters and financial crises, climate change, etc. It spans a time range between 1945 up to these days and includes hundreds of countries and international organizations.

Aid Data users are political scientists, economists, social scientists of many sorts, all devoted to a single purpose: understand aid. Is aid effective? Is aid allocated efficiently? Does aid go where it is more needed? Is aid influenced by politics (the answer is of course yes)? Does aid have undesired consequences? Etc.

Isn’t that incredibly fascinating? Here is what I have learned during these few days I have spent talking with these nice people.
….

This fits quite well with the resources I mention in Lap Dancing with Big Data.

Making the Aid data your own data, will require time, effort and personal effort to understand and master it.

By that point, however, you may care about the data and the people it represents. Just be forewarned.

Zooming Through Historical Data…

Filed under: S4,Storm,Stream Analytics,Visualization — Patrick Durusau @ 5:12 pm

Zooming Through Historical Data with Streaming Micro Queries by Alex Woodie.

From the post:

Stream processing engines, such as Storm and S4, are commonly used to analyze real-time data as it flows into an organization. But did you know you can use this technology to analyze historical data too? A company called ZoomData recently showed how.

In a recent YouTube presentation, Zoomdata Justin Langseth demonstrated his company’s technology, which combines open source stream processing engines like Apache with data connection and visualization libraries based on D3.js.

“We’re doing data analytics and visualization a little differently than it’s traditionally done,” Langseth says in the video. “Legacy BI tools will generate a big SQL statement, run it against Oracle or Teradata, then wait for two to 20 to 200 seconds before showing it to the user. We use a different approach based on the Storm stream processing engine.”

Once hooked up to a data source–such as Cloudera Impala or Amazon Redshift–data is then fed into the Zoomdata platform, which performs calculations against the data as it flows in, “kind of like continues event processing but geared more toward analytics,” Langseth says.

From the video description:

In this hands-on webcast you’ll learn how LivePerson and Zoomdata perform stream processing and visualization on mobile devices of structured site traffic and unstructured chat data in real-time for business decision making. Technologies include Kafka, Storm, and d3.js for visualization on mobile devices. Byron Ellis, Data Scientist for LivePerson will join Justin Langseth of Zoomdata to discuss and demonstrate the solution.

After watching the video, what do you think the concept of “micro queries?”

I ask because I don’t know of any technical reason why a “large” query could not stream out interim results and display those as more results were arriving.

Visualization isn’t usually done that way but that brings me to my next question: Assuming we have interim results visualized, how useful are interim results? Being actionable on interim results really depends on the domain.

I rather like Zoomdata’s emphasis on historical data and the video is impressive.

You can download a VM at Zoomdata.

If you can think of upsides/downsides to the interim results issue, please give a shout!

« Newer PostsOlder Posts »

Powered by WordPress