Another Word For It Patrick Durusau on Topic Maps and Semantic Diversity

November 15, 2013

Shrinking the Haystack with Solr and NLP

Filed under: BigData,Natural Language Processing,Solr — Patrick Durusau @ 8:39 pm

Shrinking the Haystack with Solr and NLP by Wes Caldwell.

A very high level view of using Solr and NLP to shrink a data haystack but a useful one none the less.

If you think of this in the context of Chuck Hollis’ “modest data,” you begin to realize that the inputs may be “big data” but to be useful to a human analyst, it needs to be pared down to “modest data.”

Or even further to “actionable data.”

There’s an interesting contrast: Big data vs. Actionable data.

Ask your analyst if they prefer five terabytes of raw data or five pages of actionable data?

Adjust your deliverables accordingly.

In Praise of “Modest Data”

Filed under: BigData,Data Mining,Hadoop — Patrick Durusau @ 8:22 pm

From Big Data to Modest Data by Chuck Hollis.

Mea culpa.

Several years ago, I became thoroughly enamored with the whole notion of Big Data.

I, like many, saw a brave new world of petabyte-class data sets, gleaned through by trained data science professionals using advanced algorithms — all in the hopes of bringing amazing new insights to virtually every human endeavor.

It was pretty heady stuff — and still is.

While that vision has certainly is coming to pass in many ways, there’s an interesting distinct and separate offshoot: use of big data philosophies and toolsets — but being applied to much smaller use cases with far less ambitious goals.

Call it Modest Data for lack of a better term.

No rockstars, no glitz, no glam, no amazing keynote speeches — just ordinary people getting closer to their data more efficiently and effectively than before.

That’s the fun part about technology: you put the tools in people’s hands, and they come up with all sorts of interesting ways to use it — maybe quite differently than originally intended.

Master of the metaphor, Chuck manages to talk about “big data,” “teenage sex,” “rock stars,” “Hadoop,” “business data,” and “modest data,” all in one entertaining and useful post.

While the Hadoop eco-system can handle “big data,” it also brings new capabilities to processing less than “big data,” or what Chuck calls “modest data.”

Very much worth your while to read Chuck’s post and see if your “modest” data can profit from “big data” tools.

rocksdb

Filed under: Key-Value Stores,leveldb — Patrick Durusau @ 8:09 pm

rocksdb by Facebook.

Just in case you can’t wait for OhmDB to appear, Facebook has open sourced rocksdb.

From the readme file:

rocksdb: A persistent key-value store for flash storage
Authors: * The Facebook Database Engineering Team
         * Build on earlier work on leveldb by Sanjay Ghemawat
           (sanjay@google.com) and Jeff Dean (jeff@google.com)

This code is a library that forms the core building block for a fast
key value server, especially suited for storing data on flash drives.
It has a Log-Structured-Merge-Database (LSM) design with flexible tradeoffs
between Write-Amplification-Factor(WAF), Read-Amplification-Factor (RAF)
and Space-Amplification-Factor(SAF). It has multi-threaded compactions,
making it specially suitable for storing multiple terabytes of data in a
single database.

The core of this code has been derived from open-source leveldb.

The code under this directory implements a system for maintaining a
persistent key/value store.

See doc/index.html for more explanation.
See doc/impl.html for a brief overview of the implementation.

The public interface is in include/*.  Callers should not include or
rely on the details of any other header files in this package.  Those
internal APIs may be changed without warning.
...

Something to keep in mind to use with that multi-terabyte drive you are eyeing as a present to yourself. 😉

OhmDB

Filed under: Database,Graphs,Joins,NoSQL,SQL,Traversal — Patrick Durusau @ 7:52 pm

OhmDB

Billed as:

The Irresistible Database for Java Combining Great RDBMS and NoSQL Features.

Supposed to appear by the end of November 2013 so it isn’t clear if SQL, NoSQL are about to be joined by Irresistable as a database category or not. 😉

The following caught my eye:

Very fast joins with graph-based relations

A single join has O(1) time complexity. A combination of multiple joins is internally processed as graph traversal with smart query optimization.

Without details, “very fast” has too wide a range of meanings to be very useful.

I don’t agree with the evaluation of Performance for RDBMS as “Limited.” People keep saying that as a truism when performance of any data store depends upon the architecture, data model, caching, etc.

I saw a performance test recently that depended upon (hopefully) a mis-understanding of one of the subjects of comparison. No surprise that it did really poorly in the comparison.

On the other hand, I am looking forward to the release of OhmDB as an early holiday surprise!

PS: I did subscribe to the newsletter on the theory that enough legitimate email might drown out the spam I get.

Thinking, Fast and Slow (Review) [And Subject Identity]

A statistical review of ‘Thinking, Fast and Slow’ by Daniel Kahneman by Patrick Burns.

From the post:

We are good intuitive grammarians — even quite small children intuit language rules. We can see that from mistakes. For example: “I maked it” rather than the irregular “I made it”.

In contrast those of us who have training and decades of experience in statistics often get statistical problems wrong initially.

Why should there be such a difference?

Our brains evolved for survival. We have a mind that is exquisitely tuned for finding things to eat and for avoiding being eaten. It is a horrible instrument for finding truth. If we want to get to the truth, we shouldn’t start from here.

A remarkable aspect of your mental life is that you are rarely stumped. … you often have answers to questions that you do not completely understand, relying on evidence that you can neither explain nor defend.

The review focuses mainly on statistical issues in “Thinking Fast and Slow” but I think you will find it very entertaining.

I deeply appreciate Patrick’s quoting of:

A remarkable aspect of your mental life is that you are rarely stumped. … you often have answers to questions that you do not completely understand, relying on evidence that you can neither explain nor defend.

In particular:

…relying on evidence that you can neither explain nor defend.

which resonates with me on subject identification.

Think about how we search for subjects, which of necessity involves some notion of subject identity.

What if a colleague asks if they should consult the records of the Order of the Garter to find more information on “Lady Gaga?”

Not entirely unreasonable since “Lady” is conferred upon female recipients of the Order of the Garter.

No standard search technique would explain why your colleague should not start with the Order of the Garter records.

Although I think most of us would agree such a search would be far afield. 😉

Every search starts with a searcher relying upon what they “know,” suspect or guess to be facts about a “subject” to search on.

At the end of the search, the characteristics of the subject as found, turn out to be the characteristics we were searching for all along.

I say all that to suggest that we need not bother users to say how in fact to identity the objects of their searches.

Rather the question should be:

What pointers or contexts are the most helpful to you when searching? (May or may not be properties of the search objective.)

Recalling that properties of the search objective are how we explain successful searches, not how we perform them.

Calling upon users to explain or make explicit what they themselves don’t understand, seems like a poor strategy for adoption of topic maps.

Capturing what “works” for a user, without further explanation or difficulty seems like the better choice.


PS: Should anyone ask about “Lady Gaga,” you can mention that Glamour magazine featured her on its cover, naming her Woman of the Year (December 2013 issue). I know that only because of a trip to the local drug store for a flu shot.

Promised I would be “in and out” in minutes. Literally true I suppose, it only took 50 minutes with four other people present when I arrived.

I have a different appreciation of “minutes” from the pharmacy staff. 😉
BARTOC launched : A register for vocabularies

Filed under: Classification,EU,Ontology,Thesaurus — Patrick Durusau @ 2:49 pm

BARTOC launched : A register for vocabularies by Sarah Dister

From the post:

Looking for a classification system, controlled vocabulary, ontology, taxonomy, thesaurus that covers the field you are working in? The University Library of Basel in Switzerland recently launched a register containing the metadata of 600 controlled and structured vocabularies in 65 languages. Its official name: the Basel Register of Thesauri, Ontologies and Classifications (BARTOC).

High quality search

All items in BARTOC are indexed with Eurovoc, EU’s multilingual thesaurus, and classified using Dewey Decimal Classification (DDC) numbers down to the third level, allowing a high quality subject search. Other search characteristics are:

  • The search interface is available in 20 languages.
  • A Boolean operators field is integrated into the search box.
  • The advanced search allows you to refine your search by Field type, Language, DDC, Format and Access.
  • In the results page you can refine your search further by using the facets on the right side.

A great step towards bridging vocabularies but at a much higher (more general) level than any enterprise or government department.

November 14, 2013

Global Forest Change

Filed under: Climate Data,Environment,Mapping,Maps,Visualization — Patrick Durusau @ 7:46 pm

The first detailed maps of global forest change by Matt Hansen and Peter Potapov, University of Maryland; Rebecca Moore and Matt Hancher, Google.

From the post:

Most people are familiar with exploring images of the Earth’s surface in Google Maps and Earth, but of course there’s more to satellite data than just pretty pictures. By applying algorithms to time-series data it is possible to quantify global land dynamics, such as forest extent and change. Mapping global forests over time not only enables many science applications, such as climate change and biodiversity modeling efforts, but also informs policy initiatives by providing objective data on forests that are ready for use by governments, civil society and private industry in improving forest management.

In a collaboration led by researchers at the University of Maryland, we built a new map product that quantifies global forest extent and change from 2000 to 2012. This product is the first of its kind, a global 30 meter resolution thematic map of the Earth’s land surface that offers a consistent characterization of forest change at a resolution that is high enough to be locally relevant as well. It captures myriad forest dynamics, including fires, tornadoes, disease and logging.

Global map of forest change: http://earthenginepartners.appspot.com/science-2013-global-forest

If you are curious to learn more, tune in next Monday, November 18 to a live-streamed, online presentation and demonstration by Matt Hansen and colleagues from UMD, Google, USGS, NASA and the Moore Foundation:

Live-stream Presentation: Mapping Global Forest Change
Live online presentation and demonstration, followed by Q&A
Monday, November 18, 2013 at 1pm EST, 10am PST
Link to live-streamed event: http://goo.gl/JbWWTk
Please submit questions here: http://goo.gl/rhxK5X

For further results and details of this study, see High-Resolution Global Maps of 21st-Century Forest Cover Change in the November 15th issue of the journal Science.

These maps make it difficult to ignore warnings about global forest change. Forests not as abstractions but living areas that recede before your eyes.

The enhancement I would like to see to these maps is the linking of the people responsible with name, photo and last known location.

Deforestation doesn’t happen because of “those folks in government,” or “people who work for timber companies,” or “economic forces,” although all those categories of anonymous groups are used to avoid moral responsibility.

No, deforestation happens because named individuals in government, business, manufacturing, farming, have made individual decisions to exploit the forests.

With enough data on the individuals who made those decisions, the rest of us could make decisions too.

Such as how to treat people guilty of committing and conspiring to commit ecocide.

The Historical Thesaurus of English

Filed under: Dictionary,Thesaurus — Patrick Durusau @ 7:20 pm

The Historical Thesaurus of English

From the webpage:

The Historical Thesaurus of English project was initiated by the late Professor Michael Samuels in 1965 and completed in 2008. It contains almost 800,000 word meanings from Old English onwards, arranged in detailed hierarchies within broad conceptual categories such as Thought or Music. It is based on the second edition of the Oxford English Dictionary and its Supplements, with additional materials from A Thesaurus of Old English, and was published in print as the Historical Thesaurus of the OED by Oxford University Press on 22 October 2009.

This electronic version enables users to pinpoint the range of meanings of a word throughout its history, their synonyms, and their relationship to words of more general or more specific meaning. In addition to providing hitherto unavailable information for linguistic and textual scholars, the Historical Thesaurus online is a rich resource for students of social and cultural history, showing how concepts developed through the words that refer to them. Links to Oxford English Dictionary headwords are provided for subscribers to the online OED, which also links the two projects on its own site.

Take particular note of:

This electronic version enables users to pinpoint the range of meanings of a word throughout its history, their synonyms, and their relationship to words of more general or more specific meaning.

Ooooh, that means that words don’t have fixed meanings. Or that everyone reads them the same way.

Want to improve your enterprise search results? A maintained domain/enterprise specific thesaurus would be a step in that direction.

Not to mention a thesaurus could reduce the 42% of people who use the wrong information to make decisions to a lesser number. (Findability As Value Proposition)

Unless you are happy with the 60/40 Rule, where 40% of your executives are making decisions based on incorrect information.

I wouldn’t be.

Data Repositories…

Filed under: Data,Data Repositories,Dataset — Patrick Durusau @ 6:00 pm

Data Repositories – Mother’s Milk for Data Scientists by Jerry A. Smith.

From the post:

Mothers are life givers, giving the milk of life. While there are so very few analogies so apropos, data is often considered the Mother’s Milk of Corporate Valuation. So, as a data scientist, we should treat dearly all those sources of data, understanding their place in the overall value chain of corporate existence.

A Data Repository is a logical (and sometimes physical) partitioning of data where multiple databases which apply to specific applications or sets of applications reside. For example, several databases (revenues, expenses) which support financial applications (A/R, A/P) could reside in a single financial Data Repository. Data Repositories can be found both internal (e.g., in data warehouses) and external (see below) to an organization. Here are a few repositories from KDnuggets that are worth taking a look at: (emphasis in original)

I count sixty-four (64) collections of data sets as of today.

What I haven’t seen, perhaps you have, is an index across the most popular data set collections that dedupes data sets and has thumb-nail information for each one.

Suggested indexes across data set collections?

DeleteDuplicates based on crawlDB only [Nutch-656]

Filed under: Nutch,Search Engines — Patrick Durusau @ 5:37 pm

DeleteDuplicates based on crawlDB only [Nutch-656]

As of today, Nutch, well, the nightly build after tonight, will have the ability to delete duplicate URLs.

Step in the right direction!

Now if duplicates could be declared on more than duplicate URLs and relationships maintained across deletions. 😉

BirdReader

Filed under: News,RSS — Patrick Durusau @ 3:49 pm

BirdReader by Glynn Bird.

From the webpage:

In March 2013, Google announced that Google Reader was to be closed. I used Google Reader every day so I set out to find a replacement. I started with other online offerings, but then I thought “I could build one”. So I created BirdReader which I have released to the world in its unpolished “alpha”.

BirdReader is designed to be installed on your own webserver or laptop, running Node.js. e.g.

  • import your old Google Reader subscriptions
  • fetches RSS every 5 minutes
  • web-based aggregated newsfeed
  • – mark articles as read
  • – delete articles without reading
  • – ‘star’ articles
  • – add a new feed
  • – sorted in newest-first order
  • – bootstrap-based, responsive layout
  • – tagging/untagging of feeds
  • – Twitter/Facebook sharing
  • – basic HTTP authentication (optional)
  • – filter read/unread/starred streams by tag
  • – filter read/unread/starred streams by feed
  • – full-text search (only works when using Cloudant as the CouchDB storage engine)
  • – icons for feeds and articles
  • – expand all
  • – browse-mode – go through unread articles one-by-one, full screen
  • API
  • – live stats via WebSockets (NEW!)

Not that you need another RSS reader but consider this an opportunity to create a topic map-based RSS reader.

You can subscribe to feeds or even searches of feeds.

But do you know of an RSS reader that:

  • maps authors across feeds?
  • maps subjects across feeds and produces histories of subjects?
  • maps relationships between authors and subjects?
  • dedupes aggregator content that appeared months ago but is re-dated to make it appear “new?”
  • etc.

Free Access to EU Satellite Data

Filed under: EU,Government Data,Public Data — Patrick Durusau @ 2:49 pm

Free Access to EU Satellite Data (Press Release, Brussels, 13 November 2013).

From the release:

The European Commission will provide free, full and open access to a wealth of important environmental data gathered by Copernicus, Europe’s Earth observation system. The new open data dissemination regime, which will come into effect next month, will support the vital task of monitoring the environment and will also help Europe’s enterprises, creating new jobs and business opportunities. Sectors positively stimulated by Copernicus are likely to be services for environmental data production and dissemination, as well as space manufacturing. Indirectly, a variety of other economic segments will see the advantages of accurate earth observation, such as transport, oil and gas, insurance and agriculture. Studies show that Copernicus – which includes six dedicated satellite missions, the so-called Sentinels, to be launched between 2014 and 2021 – could generate a financial benefit of some € 30 billion and create around 50.000 jobs by 2030. Moreover, the new open data dissemination regime will help citizens, businesses, researchers and policy makers to integrate an environmental dimension into all their activities and decision making procedures.

To make maximum use of this wealth of information, researchers, citizens and businesses will be able to access Copernicus data and information through dedicated Internet-based portals. This free access will support the development of useful applications for a number of different industry segments (e.g. agriculture, insurance, transport, and energy). Other examples include precision agriculture or the use of data for risk modelling in the insurance industry. It will fulfil a crucial role, meeting societal, political and economic needs for the sustainable delivery of accurate environmental data.

More information on the Copernicus web site at: http://copernicus.eu

The “€ 30 billion” financial benefit seems a bit soft after looking at the study reports on the economic value of Copernicus.

For example, if Copernicus is used to monitor illegal dumping (D. Drimaco, Waste monitoring service to improve waste management practices and detect illegal landfills), how is a financial benefit calculated for illegal dumping prevented?

If you are the Office of Management and Budget (U.S.), you could simply make up the numbers and report them in near indecipherable documents. (Free Sequester Data Here!)

I don’t doubt there will be economic benefits from Copernicus but questions remain: how much and for who?

I first saw this in a tweet by Stefano Bertolo.

Cloudera + Udacity = Hadoop MOOC!

Filed under: Cloudera,Hadoop,MapReduce — Patrick Durusau @ 1:54 pm

Cloudera and Udacity partner to offer Data Science training courses by Lauren Hockenson.

From the post:

After launching the Open Education Alliance with some of the biggest tech companies in Silicon Valley, Udacity has forged a partnership with Cloudera to bring comprehensive Data Science curriculum to a massively open online course (MOOC) format in a program called Cloudera University — allowing anyone to learn the intricacies of Hadoop and other Data Science methods.

“Recognizing the growing demand for skilled data professionals, more students are seeking instruction in Hadoop and data science in order to prepare themselves to take advantage of the rapidly expanding data economy,” said Sebastian Thun, founder of Udacity, in a press release. “As the leader in Hadoop solutions, training, and services, Cloudera’s insights and technical guidance are in high demand, so we are pleased to be leveraging that experience and expertise as their partner in online open courseware,”

The first offering to come via Cloudera University will be “Introduction to Hadoop and MapReduce,” a three-lesson course that serves a precursor to the program’s larger, track-based training already in place. While Cloudera already offers many of these courses in Data Science, as well as intensive certificate training programs, in an in-person setting, it seems that the partnership with Udacity will translate curriculum that Cloudera has developed into a more palatable format for online learning.

Looking forward to Cloudera University reflecting all of the Hadoop eco-system.

In the mean time, there are a number of online training resources already available at Cloudera.

Fair Use Prevails!

Filed under: Authoring Topic Maps,Fair Use,Topic Maps — Patrick Durusau @ 11:46 am

Google wins book-scanning case: judge finds “fair use,” cites many benefits by Jeff John Roberts.

From the post:

Google has won a resounding victory in its eight-year copyright battle with the Authors Guild over the search giant’s controversial decision to scan more than 20 million library and make the available on the internet.

In a ruling issued Thursday morning in New York, US Circuit Judge Denny Chin said the book scanning amounted to fair use because it was “highly transformative” and because it didn’t harm the market for the original work.

“Google Books provides significant public benefits,” writes Chin, describing it as “an essential research tool” and noting that the scanning service has expanded literary access for the blind and helped preserve the text of old books from physical decay.

Chin also rejected the theory that Google was depriving authors of income, noting that the company does not sell the scans or make whole copies of books available. He concluded, instead, that Google Books served to help readers discover new books and amounted to “new income from authors.”

Excellent!

In case you are interested in “why” Google prevailed: The Authors Guild, Inc., et. al. vs. Google, Inc..

Sets an important precedent for topic maps that extract small portions of print or electronic works for presentation to users.

Especially works that sit on library shelves, waiting for their copyright imprisonment to end.

Querying rich text with Lux

Filed under: Lucene,Query Language,XML,XQuery — Patrick Durusau @ 11:17 am

Querying rich text with Lux – XQuery for Lucene by Michael Sokolov.

Slide deck that highlights features of Lux, which is billed at its homepage as:

The XML Search Engine Lux is an open source XML search engine formed by fusing two excellent technologies: the Apache Lucene/Solr search index and the Saxon XQuery/XSLT processor.

Not surprisingly, I am in favor of using XML to provide context for data.

You can get a better feel for Lux by:

Reading Indexing Queries in Lux by Michael Sokolov (Balisage 2013)

Visiting the Lux homepage: http://luxdb.org

Downloading Lux Source: http://github.com/msokolov/lux

BTW, Michael does have experience with XML based content: safaribooksonline.com, oed.com, degruyter.com, oxfordreference.com and others.

PS: Remember any comments on XQuery 3.0 are due by November 19, 2013.

Somthing Very Big Is Coming… [Wolfram Language]

Filed under: Homoiconic,Lisp,Mathematica,Wolfram Language — Patrick Durusau @ 10:51 am

Something Very Big Is Coming: Our Most Important Technology Project Yet by Stephen Wolfram.

From the post:

Computational knowledge. Symbolic programming. Algorithm automation. Dynamic interactivity. Natural language. Computable documents. The cloud. Connected devices. Symbolic ontology. Algorithm discovery. These are all things we’ve been energetically working on—mostly for years—in the context of Wolfram|Alpha, Mathematica, CDF and so on.

But recently something amazing has happened. We’ve figured out how to take all these threads, and all the technology we’ve built, to create something at a whole different level. The power of what is emerging continues to surprise me. But already I think it’s clear that it’s going to be profoundly important in the technological world, and beyond.

At some level it’s a vast unified web of technology that builds on what we’ve created over the past quarter century. At some level it’s an intellectual structure that actualizes a new computational view of the world. And at some level it’s a practical system and framework that’s going to be a fount of incredibly useful new services and products.

A crucial building block of all this is what we’re calling the Wolfram Language.

In a sense, the Wolfram Language has been incubating inside Mathematica for more than 25 years. It’s the language of Mathematica, and CDF—and the language used to implement Wolfram|Alpha. But now—considerably extended, and unified with the knowledgebase of Wolfram|Alpha—it’s about to emerge on its own, ready to be at the center of a remarkable constellation of new developments.

We call it the Wolfram Language because it is a language. But it’s a new and different kind of language. It’s a general-purpose knowledge-based language. That covers all forms of computing, in a new way.

There are plenty of existing general-purpose computer languages. But their vision is very different—and in a sense much more modest—than the Wolfram Language. They concentrate on managing the structure of programs, keeping the language itself small in scope, and relying on a web of external libraries for additional functionality. In the Wolfram Language my concept from the very beginning has been to create a single tightly integrated system in which as much as possible is included right in the language itself.

And so in the Wolfram Language, built right into the language, are capabilities for laying out graphs or doing image processing or creating user interfaces or whatever. Inside there’s a giant web of algorithms—by far the largest ever assembled, and many invented by us. And there are then thousands of carefully designed functions set up to use these algorithms to perform operations as automatically as possible.

It’s not possible to evaluate the claims that Stephen makes in this post without access to the Wolfram language.

But, given his track record, I do think it is important that people across CS begin to prepare to evaluate it upon release.

For example, Stephen says:

In most languages there’s a sharp distinction between programs, and data, and the output of programs. Not so in the Wolfram Language. It’s all completely fluid. Data becomes algorithmic. Algorithms become data. There’s no distinction needed between code and data. And everything becomes both intrinsically scriptable, and intrinsically interactive. And there’s both a new level of interoperability, and a new level of modularity.

Languages that don’t distinguish between programs and are called homoiconic languages.

One example of a homoiconic language is Lisp, first specified in 1958.

I would not call homoiconicity a “new” development, particularly with a homoiconic language from 1958.

Still, I have signed up for early notice of the Wolfram language release and suggest you do the same.

November 13, 2013

PowerLyra

Filed under: GraphLab,Graphs,Networks — Patrick Durusau @ 8:36 pm

PowerLyra by Danny Bickson.

Danny has posted an email from Rong Chen, Shanghai Jiao Tong University, which reads in part:

We argued that skewed distribution in natural graphs also calls for differentiated processing of high-degree and low-degree vertices. We then developed PowerLyra, a new graph analytics engine that embraces the best of both worlds of existing frameworks, by dynamically applying different computation and partition strategies for different vertices. PowerLyra uses Pregel/GraphLab like computation models for process low-degree vertices to minimize computation, communication and synchronization overhead, and uses PowerGraph-like computation model for process high-degree vertices to reduce load imbalance and contention. To seamless support all PowerLyra application, PowerLyra further introduces an adaptive unidirectional graph communication.

PowerLyra additionally proposes a new hybrid graph cut algorithm that embraces the best of both worlds in edge-cut and vertex-cut, which adopts edge-cut for low-degree vertices and vertex-cut for high-degree vertices. Theoretical analysis shows that the expected replication factor of random hybrid-cut is always better than both random vertex-cut and edge-cut. For skewed power-law graph, empirical validation shows that random hybrid-cut also decreases the replication factor of current default heuristic vertex-cut (Grid) from 5.76X to 3.59X and from 18.54X to 6.76X for constant 2.2 and 1.8 of synthetic graph respectively. We also develop a new distributed greedy heuristic hybrid-cut algorithm, namely Ginger, inspired by Fennel (a greedy streaming edge-cut algorithm for a single machine). Compared to Gird vertex-cut, Ginger can reduce the replication factor by up to 2.92X (from 2.03X) and 3.11X (from 1.26X) for synthetic and real-world graphs accordingly.

Finally, PowerLyra adopts locality-conscious data layout optimization in graph ingress phase to mitigate poor locality during vertex communication. we argue that a small increase of graph ingress time (less than 10% for power-law graph and 5% for real-world graph) is more worthwhile for an often larger speedup in execution time (usually more than 10% speedup, specially 21% for Twitter follow graph).

Right now, PowerLyra is implemented as an execution engine and graph partitions of GraphLab, and can seamlessly support all GraphLab applications. A detail evaluation on 48-node cluster using three different graph algorithms (PageRank, Approximate Diameter and Connected Components) show that PowerLyra outperforms current synchronous engine with Grid partition of PowerGraph (Jul. 8, 2013. commit:fc3d6c6) by up to 5.53X (from 1.97X) and 3.26X (from 1.49X) for real-world (Twitter, UK-2005, Wiki, LiveJournal and WebGoogle) and synthetic (10-million vertex power-law graph ranging from 1.8 to 2.2) graphs accordingly, due to significantly reduced replication factor, less communication cost and improved load balance.

The website of PowerLyra: http://ipads.se.sjtu.edu.cn/projects/powerlyra.html
….

Pass this along if you are interested in cutting edge graph software development.

Testing ETL Processes

Filed under: ETL,Topic Maps — Patrick Durusau @ 8:22 pm

Testing ETL Processes by Gary Sieling.

From the post:

ETL (“extract, transform, load”) come in many shapes, sizes, and product types, and occur under many names – “data migration” projects, business intelligence software, analytics, reporting, scraping, database upgrades, and so on. I’ve collected some notes, attempting to classify these projects by their principal attributes, so that you can estimate the risks and plan the testing process for similar projects- if you have other additions to this list, please add comments below.

I count twenty-six (26) distinct risks and there may be others.

Are you in the eternal cycle of ETL?

For data to be improved, it’s ETL time?

There are alternatives.

Such as annotating data in place.

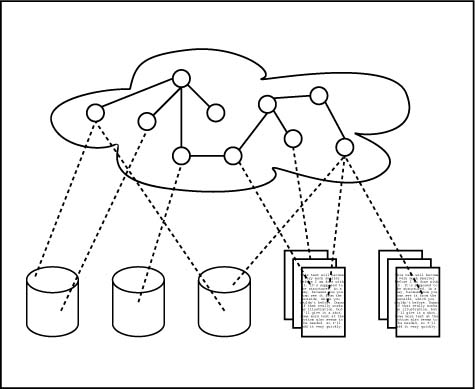
If you have ever seen the graphic of a topic map hovering over an infospace, you know what I am talking about.

Topic Map

(Image by Lars Marius Garshol)

Questions?

New Data Standard May Save Billions [Danger! Danger! Will Robinson]

Filed under: Standards,W3C — Patrick Durusau @ 7:56 pm

New Data Standard May Save Billions by Isaac Lopez.

When I read:

The international World Wide Web Consortium (W3C) is finalizing a new data standard that could lead to $3 billion of savings each year for the global web industry. The new standard, called the Customer Experience Digital Data Acquisition standard, aims to simplify and standardize data for such endeavors as marketing, analytics, and personalization across websites worldwide.

“At the moment, every technology ingests and outputs information about website visitors in a dizzying array of different formats,” said contributing company Qubit in a statement. “Every time a site owner wants to deploy a new customer experience technology such as web analytics, remarketing or web apps, overstretched development teams have to build a bespoke set of data interfaces to make it work, meaning site owners can’t focus on what’s important.”

The new standard aims to remove complexity by unifying the language that is used by marketing, analytics, and other such tools that are being used as part of the emerging big data landscape. According to the initial figures from customer experience management platform company (and advocate of the standard), Qubit, the savings from the increased efficiency could reach the equivalent of 0.1% of the global internet economy.

Of those benefitting the most from the standard, the United States comes in a clear winner, with savings that reach into the billions, with average savings per business in the tens of thousands of dollars.

I thought all my news feeds from, on and about the W3C had failed. I couldn’t recall any W3C standard work that resembled what was being described.

I did find it hosted at the W3C: Customer Experience Digital Data Community Group, where you will read:

The Customer Experience Digital Data Community Group will work on reviewing and upgrading the W3C Member Submission in Customer Experience Digital Data, starting with the Customer Experience Digital Data Acquisition submission linked here (http://www.w3.org/Submission/2012/04/). The group will also focus on developing connectivity between the specification and the Data Privacy efforts in the industry, including the W3C Tracking Protection workgroup. The goal is to upgrade the Member Submission specification via this Community Group and issue a Community Group Final Specification.

Where you will also read:

Note: Community Groups are proposed and run by the community. Although W3C hosts these conversations, the groups do not necessarily represent the views of the W3C Membership or staff. (emphasis added)

So, The international World Wide Web Consortium (W3C) is [NOT] finalizing a new data standard….

The W3C should not be attributed work it has not undertaken or approved.

Amazon Hosting 20 TB of Climate Data

Filed under: Amazon Web Services AWS,Climate Data,NASA — Patrick Durusau @ 7:37 pm

Amazon Hosting 20 TB of Climate Data by Isaac Lopez.

From the post:

Looking to save the world through data? Amazon, in conjunction with the NASA Earth Exchange (NEX) team, today released over 20 terabytes of NASA-collected climate data as part of its OpenNEX project. The goal, they say, is to make important datasets accessible to a wide audience of researchers, students, and citizen scientists in order to facilitate discovery.

“Up until now, it has been logistically difficult for researchers to gain easy access to this data due to its dynamic nature and immense size,” writes Amazon’s Jeff Barr in the Amazon blog. “Limitations on download bandwidth, local storage, and on-premises processing power made in-house processing impractical. Today we are publishing an initial collection of datasets available (over 20 TB), along with Amazon Machine Images (AMIs), and tutorials.”

The OpenNEX project aims to give open access to resources to aid earth science researchers, including data, virtual labs, lectures, computing and more.

Excellent!

Isaac also reports that NASA will be hosting workshops on the data.

Anyone care to wager on the presence of semantic issues in the data sets? 😉

BioCreative Resources (and proceedings)

Filed under: Bioinformatics,Curation,Text Mining — Patrick Durusau @ 7:25 pm

BioCreative Resources (and proceedings)

From the Overview page:

The growing interest in information retrieval (IR), information extraction (IE) and text mining applied to the biological literature is related to the increasing accumulation of scientific literature (PubMed has currently (2005) over 15,000,000 entries) as well as the accelerated discovery of biological information obtained through characterization of biological entities (such as genes and proteins) using high-through put and large scale experimental techniques [1].

Computational techniques which process the biomedical literature are useful to enhance the efficient access to relevant textual information for biologists, bioinformaticians as well as for database curators. Many systems have been implemented which address the identification of gene/protein mentions in text or the extraction of text-based protein-protein interactions and of functional annotations using information extraction and text mining approaches [2].

To be able to evaluate performance of existing tools, as well as to allow comparison between different strategies, common evaluation standards as well as data sets are crucial. In the past, most of the implementations have focused on different problems, often using private data sets. As a result, it has been difficult to determine how good the existing systems were or to reproduce the results. It is thus cumbersome to determine whether the systems would scale to real applications, and what performance could be expected using a different evaluation data set [3-4].

The importance of assessing and comparing different computational methods have been realized previously by both, the bioinformatics and the NLP communities. Researchers in natural language processing (NLP) and information extraction (IE) have, for many years now, used common evaluations to accelerate their research progress, e.g., via the Message Understanding Conferences (MUCs) [5] and the Text Retrieval Conferences (TREC) [6]. This not only resulted in the formulation of common goals but also made it possible to compare different systems and gave a certain transparency to the field. With the introduction of a common evaluation and standardized evaluation metrics, it has become possible to compare approaches, to assess what techniques did and did not work, and to make progress. This progress has resulted in the creation of standard tools available to the general research community.

The field of bioinformatics also has a tradition of competitions, for example, in protein structure prediction (CASP [7]) or gene predictions in entire genomes (at the “Genome Based Gene Structure Determination” symposium held on the Wellcome Trust Genome Campus).

There has been a lot of activity in the field of text mining in biology, including sessions at the Pacific Symposium of Biocomputing (PSB [8]), the Intelligent Systems for Molecular Biology (ISMB) and European Conference on Computational Biology (ECCB) conferences [9] as well workshops and sessions on language and biology in computational linguistics (the Association of Computational Linguistics BioNLP SIGs).

A small number of complementary evaluations of text mining systems in biology have been recently carried out, starting with the KDD cup [10] and the genomics track at the TREC conference [11]. Therefore we decided to set up the first BioCreAtIvE challenge which was concerned with the identification of gene mentions in text [12], to link texts to actual gene entries, as provided by existing biological databases, [13] as well as extraction of human gene product (Gene Ontology) annotations from full text articles [14]. The success of this first challenge evaluation as well as the lessons learned from it motivated us to carry out the second BioCreAtIvE, which should allow us to monitor improvements and build on the experience and data derived from the first BioCreAtIvE challenge. As in the previous BioCreAtIvE, the main focus is on biologically relevant tasks, which should result in benefits for the biomedical text mining community, the biology and biological database community, as well as the bioinformatics community.

A gold mine of resources if you are interested in bioinformatics, curation or IR in general.

Including the BioCreative Proceedings for 2013:

BioCreative IV Proceedings vol. 1

BioCreative IV Proceedings vol. 2

CoIN: a network analysis for document triage

Filed under: Bioinformatics,Curation,Entities,Entity Extraction — Patrick Durusau @ 7:16 pm

CoIN: a network analysis for document triage by Yi-Yu Hsu and Hung-Yu Kao. (Database (2013) 2013 : bat076 doi: 10.1093/database/bat076)

Abstract:

In recent years, there was a rapid increase in the number of medical articles. The number of articles in PubMed has increased exponentially. Thus, the workload for biocurators has also increased exponentially. Under these circumstances, a system that can automatically determine in advance which article has a higher priority for curation can effectively reduce the workload of biocurators. Determining how to effectively find the articles required by biocurators has become an important task. In the triage task of BioCreative 2012, we proposed the Co-occurrence Interaction Nexus (CoIN) for learning and exploring relations in articles. We constructed a co-occurrence analysis system, which is applicable to PubMed articles and suitable for gene, chemical and disease queries. CoIN uses co-occurrence features and their network centralities to assess the influence of curatable articles from the Comparative Toxicogenomics Database. The experimental results show that our network-based approach combined with co-occurrence features can effectively classify curatable and non-curatable articles. CoIN also allows biocurators to survey the ranking lists for specific queries without reviewing meaningless information. At BioCreative 2012, CoIN achieved a 0.778 mean average precision in the triage task, thus finishing in second place out of all participants.

Database URL: http://ikmbio.csie.ncku.edu.tw/coin/home.php

From the introduction:

Network analysis concerns the relationships between processing entities. For example, the nodes in a social network are people, and the links are the friendships between the nodes. If we apply these concepts to the ACT, PubMed articles are the nodes, while the co-occurrences of gene–disease, gene–chemical and chemical–disease relationships are the links. Network analysis provides a visual map and a graph-based technique for determining co-occurrence relationships. These graphical properties, such as size, degree, centralities and similar features, are important. By examining the graphical properties, we can gain a global understanding of the likely behavior of the network. For this purpose, this work focuses on two themes concerning the applications of biocuration: using the co-occurrence–based approach to obtain a normalized co-occurrence score and using the network-based approach to measure network properties, e.g. betweenness and PageRank. CoIN integrates co-occurrence features and network centralities when curating articles. The proposed method combines the co-occurrence frequency with the network construction from text. The co-occurrence networks are further analyzed to obtain the linking and shortest path features of the network centralities.

The authors’ ultimately conclude that the network-based approaches perform better than collocation-based approaches.

If this post sounds hauntingly familiar, you may be thinking about Prioritizing PubMed articles for the Comparative Toxicogenomic Database utilizing semantic information, which was the first place finisher at BioCreative 2012 with a mean average precision (MAP) score of 0.8030.

Exploring football …[with]… Clojure and friends

Filed under: Clojure,Graphs,Neo4j — Patrick Durusau @ 5:44 pm

Exploring football data & ranking teams using Clojure and friends by Mark Needham.

U.S. readers be forewarned that Mark doesn’t use the term “football” as you might expect. Think soccer.

A slide deck on transforming sports data with Clojure and using Neo4j (graph database) for storage and queries.

Sports are popular topic so the results could ease others into Clojure and Neo4j.

How Did Snowden Do It?

Filed under: Cybersecurity,NSA,Security — Patrick Durusau @ 4:40 pm

How Did Snowden Do It? by Kelly Jackson Higgins.

From the post:

The full story of just how the now-infamous systems administrator Edward Snowden was able to grab highly classified documents from the world’s most secretive spy agency and expose its controversial spying practices may never be public, but some clues have emerged that provide a clearer picture of how the most epic insider leak in history may have transpired.

Snowden, the former Booz Allen contractor working as a low-level systems admin for the NSA at its Hawaii post, reportedly coerced several of his colleagues to provide him with their credentials, according to a report by Reuters late last week. He may have convinced up to 25 staffers at the NSA regional operations center there to hand over their usernames and passwords under the pretext that he needed them for his job, according to the report.

Did you notice the shifting description of Snowden’s actions in the second paragraph?

At first Snowden “coerced several of his colleagues.” Then Snowden “convinced up to 25 staffers.” If you jump to the Reuters story, Snowden “persuaded other NSA workers to give up passwords….”

Persuasion is a long way from coercion, at least as I understand those terms.

Unfortunately, Congress is considering a variety of technical fixes to what is ultimately a user problem.

The user problem? Sharing of admin logins and passwords.

Sharing among privileged and admin account holders is fairly commonplace. More than half of organizations surveyed earlier this year by CyberArk said their “approved” users share their admin and privileged account passwords.

Snowden’s social-engineering of his colleagues to get their credentials played off of an environment of trust. “Employees want to please their co-workers, so if he said, ‘hey, I need your help because I’ve gotta get something done’ … there a trust that can be taken advantage of,” says John Worrall, chief marketing officer at CyberArk.

“What’s troubling is there are a couple of basic tenets of security that you never want to screw around with, [including] you never share your credentials,” Worrall says. “The whole access control model is based on identity and then the access model is useless and it blows up.”

None of the remedies being discussed/funded by Congress address that fundamental breakdown in security.

I’m sure it would be harder right now to obtain a login/password at the NSA but give it six (or fewer) months.

A better solution than the “throw money at our contractor friends” used by Congress is to have regular internal security testing.

Offer a bounty to staff who get other staff to share their login/password.

What happens to those who share logins/passwords should depend on their level of access and potential for harm.

Computational Topology and Data Analysis

Filed under: Data Analysis,Topological Data Analysis,Topology — Patrick Durusau @ 3:06 pm

Computational Topology and Data Analysis by Tamal K Dey.

Course syllabus:

Computational topology has played a synergistic role in bringing together research work from computational geometry, algebraic topology, data analysis, and many other related scientific areas. In recent years, the field has undergone particular growth in the area of data analysis. The application of topological techniques to traditional data analysis, which before has mostly developed on a statistical setting, has opened up new opportunities. This course is intended to cover this aspect of computational topology along with the developments of generic techniques for various topology-centered problems.

A course outline on computational topology with a short reading list, papers and notes on various topics.

I found this while looking up references on Tackling some really tough problems….

Tackling some really tough problems…

Filed under: Machine Learning,Topological Data Analysis,Topology — Patrick Durusau @ 2:56 pm

Tackling some really tough problems with machine learning by Derrick Harris.

From the post:

Machine learning startup Ayasdi is partnering with two prominent institutions — Lawrence Livermore National Laboratory and the Texas Medical Center — to help advance some of their complicated data challenges. At LLNL, the company will collaborate on research in energy, climate change, medical technology, and national security, while its work with the Texas Medical Center will focus on translational medicine, electronic medical records and finding new uses for existing drugs.

Ayasdi formally launched in January after years researching its core technology, called topological data analysis. Essentially, the company’s software, called Iris, uses hundreds of machine learning algorithms to analyze up to tens of billions of data points and identify the relationships among them. The topological part comes from the way the results of this analysis are visually mapped into a network that places similar or tightly connected points near one another so users can easily spot collections of variables that appear to affect each other.

Tough problems:

At LLNL, the company will collaborate on research in energy, climate change, medical technology, and national security, while its work with the Texas Medical Center will focus on translational medicine, electronic medical records and finding new uses for existing drugs.

I would say so but that wasn’t the “tough” problem I was expecting.

The “tough” problem I had in mind was taking data with no particular topology and mapping it to a topology.

I ask because “similar or tightly connected points” depend upon a notion of “similarity” that is not inherent in most data points.

For example, how “similar” are you from a leaker by working in the same office? How does that “similarity” compare to the “similarity” of other relationships?


Original text (which I have corrected above):

I ask because “similar or tightly connected points” depend upon a notion of “distance” that is not inherent in most data points.

For example, how “near” or “far” are you from a leaker by working in the same office? How does that “near” or “far” compare to the nearness or farness of other relationships?

I corrected the original post to remove the implication of a metric distance.

November 12, 2013

Oryx [Alphaware]

Filed under: Cloudera,Machine Learning — Patrick Durusau @ 4:29 pm

Oryx [Alphaware] (Cloudera)

From the webpage:

The Oryx open source project provides simple, real-time large-scale machine learning infrastructure. It implements a few classes of algorithm commonly used in business applications: collaborative filtering / recommendation, classification / regression, and clustering. It can continuously build models from a stream of data at large scale using Apache Hadoop‘s MapReduce. It also serves queries of those models in real-time via an HTTP REST API, and can update models approximately in response to new data. Models are exchanged in PMML format.

It is not a library, visualization tool, exploratory analytics tool, or environment. Oryx represents a unified continuation of the Myrrix and cloudera/ml projects.

Oryx should be considered alpha software; it may have bugs and will change in incompatible ways.

I’m sure management has forgotten about that incident where you tanked the production servers. Not to mention those beady-eyed government agents that slowly track you in a car when you grab lunch. 😉

Just teasing. Keep Oryx off the production servers and explore!

Sorry, no advice for the beady-eyed government agents.

Advantages of Different Classification Algorithms

Filed under: Classification,Machine Learning — Patrick Durusau @ 4:18 pm

What are the advantages of different classification algorithms? (Question on Quora.)

Useful answers follow.

Not a bad starting place for a set of algorithms you are likely to encounter on a regular basis. Either to become familiar with them and/or to work out stock criticisms of their use.

Enjoy!

I first saw this link at myNoSQL by Alex Popescu.

Using Solr to Search and Analyze Logs

Filed under: Hadoop,Log Analysis,logstash,Lucene,Solr — Patrick Durusau @ 4:07 pm

Using Solr to Search and Analyze Logs by Radu Gheorghe.

From the description:

Since we’ve added Solr output for Logstash, indexing logs via Logstash has become a possibility. But what if you are not using (only) Logstash? Are there other ways you can index logs in Solr? Oh yeah, there are! The following slides are from Lucene Revolution conference that just took place in Dublin where we talked about indexing and searching logs with Solr.

Slides but a very good set of slides.

Radu’s post reminds me I over looked logs in the Hadoop eco-system when describing semantic diversity (Hadoop Ecosystem Configuration Woes?).

Or for that matter, how do you link up the logs with particular configuration or job settings?

Emails to the support desk and sticky notes don’t seem equal to the occasion.

« Newer PostsOlder Posts »

Powered by WordPress