Another Word For It Patrick Durusau on Topic Maps and Semantic Diversity

November 21, 2014

Deep Visual-Semantic Alignments for Generating Image Descriptions

Filed under: Identification,Image Processing,Image Recognition,Image Understanding — Patrick Durusau @ 7:52 pm

Deep Visual-Semantic Alignments for Generating Image Descriptions by Andrej Karpathy and Li Fei-Fei.

From the webpage:

We present a model that generates free-form natural language descriptions of image regions. Our model leverages datasets of images and their sentence descriptions to learn about the inter-modal correspondences between text and visual data. Our approach is based on a novel combination of Convolutional Neural Networks over image regions, bidirectional Recurrent Neural Networks over sentences, and a structured objective that aligns the two modalities through a multimodal embedding. We then describe a Recurrent Neural Network architecture that uses the inferred alignments to learn to generate novel descriptions of image regions. We demonstrate the effectiveness of our alignment model with ranking experiments on Flickr8K, Flickr30K and COCO datasets, where we substantially improve on the state of the art. We then show that the sentences created by our generative model outperform retrieval baselines on the three aforementioned datasets and a new dataset of region-level annotations.

Excellent examples with generated text. Code and other predictions “coming soon.”

For the moment you can also read the research paper: Deep Visual-Semantic Alignments for Generating Image Descriptions

Serious potential in any event but even more so if the semantics of the descriptions could be captured and mapped across natural languages.
November 1, 2014

Guess the Manuscript XVI

Filed under: British Library,Image Processing,Image Recognition,Image Understanding — Patrick Durusau @ 7:55 pm

Guess the Manuscript XVI

From the post:

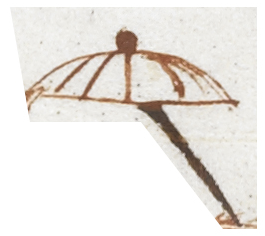
Welcome to the sixteenth instalment of our popular Guess the Manuscript series. The rules are simple: we post an image of part of a manuscript that is on the British Library’s Digitised Manuscripts site, you guess which one it’s taken from!

bl mss XVI

Are you as surprised as we are to find an umbrella in a medieval manuscript? The manuscript from which this image was taken will feature in a blogpost in the near future.

In the meantime, answers or guesses please in the comments below, or via Twitter @BLMedieval.

Caution! The Medieval Period lasted from five hundred (500) C.E. until fifteen hundred (1500) C.E. Google NGrams records the first use of “umbrella” at or around sixteen-sixty (1660). Is this an “umbrella” or something else?

Using Google’s reverse image search found only repostings of the image search challenge, no similar images. Not sure that helps but was worth a try.

On the bright side, there are only two hundred and fifty-seven (257) manuscripts in the digitized collection dated between five hundred (500) C.E. until fifteen hundred (1500) C.E.

What stories or information can be found in those volumes that might be accompanied by such an image? Need to create a list of the classes of those manuscripts.

Suggestions? Is there an image processor in the house?

Enjoy!

October 24, 2014

50 Face Recognition APIs

Filed under: Face Detection,Image Processing,Image Recognition,Image Understanding — Patrick Durusau @ 1:44 pm

50 Face Recognition APIs by Mirko Krivanek.

Interesting listing published on Mashape. Only the top 12 are listed below. It would be nice to have a separate blog for voice recognition APIs. I’ve been thinking at using voice rather than passport or driving license, as a more secure ID. The voice has a texture unique to each individual.

Subjects that are likely to be of interest!

Mirko mentions voice but then lists face recognition APIs.

Voice comes up in a mixture of APIs in: 37 Recognition APIS: AT&T SPEECH, Moodstocks and Rekognition by Matthew Scott.

I first saw this in a tweet by Andrea Mostosi

September 1, 2014

Extracting images from scanned book pages

Filed under: Data Mining,Image Processing,Image Recognition — Patrick Durusau @ 7:14 pm

Extracting images from scanned book pages by Chris Adams.

From the post:

I work on a project which has placed a number of books online. Over the years we’ve improved server performance and worked on a fast, responsive viewer for scanned books to make our books as accessible as possible but it’s still challenging to help visitors find something of interest out of hundreds of thousands of scanned pages.

Trevor and I have discussed various ways to improve the situation and one idea which seemed promising was seeing how hard it would be to extract the images from digitized pages so we could present a visual index of an item. Trevor’s THATCamp CHNM post on Freeing Images from Inside Digitized Books and Newspapers got a favorable reception and since it kept coming up at work I decided to see how far I could get using OpenCV.

Everything you see below is open-source and comments are highly welcome. I created a book-illustration-detection branch in my image mining project (see my previous experiment reconstructing higher-resolution thumbnails from the masters) so feel free to fork it or open issues.

Just in case you are looking for a Fall project. 😉

Consider capturing the images and their contents in associations with authors, publishers, etc. To enable mining those associations for patterns.

August 22, 2014

Imaging Planets and Disks [Not in our Solar System]

Filed under: Astroinformatics,Image Processing — Patrick Durusau @ 5:53 pm

Videos From the 2014 Sagan Summer Workshop On-line

From the post:

The NASA Exoplanet Science Center (NEXScI) hosts the Sagan Workshops, annual themed conferences aimed at introducing the latest techniques in exoplanet astronomy to young researchers. The workshops emphasize interaction with data, and include hands-on sessions where participants use their laptops to follow step-by-step tutorials given by experts. This year’s conference topic was “Imaging Planets and Disks”. It covered topics such as

  • Properties of Imaged Planets
  • Integrating Imaging and RV Datasets
  • Thermal Evolution of Planets
  • The Challenges and Science of Protostellar And Debris Disks…

You can see the agenda and the presentations here, and the videos have been posted here. Some of the talks are also on youtube at https://www.youtube.com/channel/UCytsRiMvdj5VTZWfj6dBadQ

The presentations showcase the extraordinary richness of exoplanet research. If you are unfamiliar with NASA’s exoplanet program, Gary Lockwood provides an introduction (not available for embedding – visit the web page). My favorite talk, of many good ones, was Travis Barman speaking on the “Crown Jewels of Young Exoplanets.”

Looking to expand you data processing horizons? 😉

Enjoy!

July 28, 2014

Cat Dataset

Filed under: Data,Image Processing,Image Recognition,Image Understanding — Patrick Durusau @ 12:14 pm

Cat Dataset

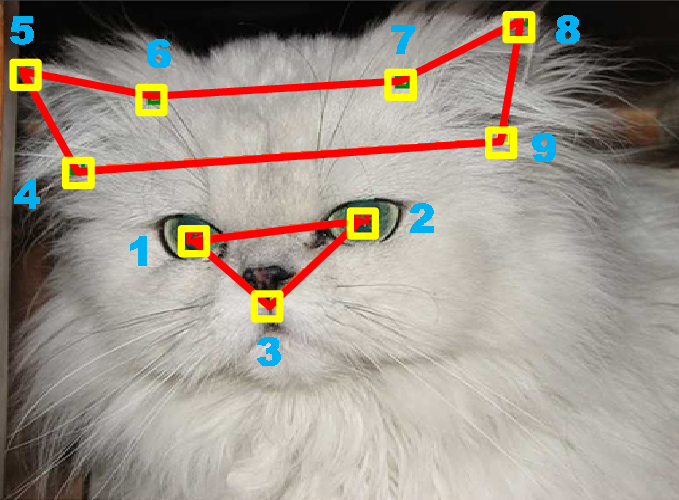
cat

From the description:

The CAT dataset includes 10,000 cat images. For each image, we annotate the head of cat with nine points, two for eyes, one for mouth, and six for ears. The detail configuration of the annotation was shown in Figure 6 of the original paper:

Weiwei Zhang, Jian Sun, and Xiaoou Tang, “Cat Head Detection – How to Effectively Exploit Shape and Texture Features”, Proc. of European Conf. Computer Vision, vol. 4, pp.802-816, 2008.

A more accessible copy: Cat Head Detection – How to Effectively Exploit Shape and Texture Features

Prelude to a cat filter for Twitter feeds? 😉

I first saw this in a tweet by Basile Simon.

June 25, 2014

One Hundred Million…

Filed under: Data,Image Processing,Image Understanding,Yahoo! — Patrick Durusau @ 7:29 pm

One Hundred Million Creative Commons Flickr Images for Research by David A. Shamma.

From the post:

Today the photograph has transformed again. From the old world of unprocessed rolls of C-41 sitting in a fridge 20 years ago to sharing photos on the 1.5” screen of a point and shoot camera 10 years back. Today the photograph is something different. Photos automatically leave their capture (and formerly captive) devices to many sharing services. There are a lot of photos. A back of the envelope estimation reports 10% of all photos in the world were taken in the last 12 months, and that was calculated three years ago. And of these services, Flickr has been a great repository of images that are free to share via Creative Commons.

On Flickr, photos, their metadata, their social ecosystem, and the pixels themselves make for a vibrant environment for answering many research questions at scale. However, scientific efforts outside of industry have relied on various sized efforts of one-off datasets for research. At Flickr and at Yahoo Labs, we set out to provide something more substantial for researchers around the globe.

[image omitted]

Today, we are announcing the Flickr Creative Commons dataset as part of Yahoo Webscope’s datasets for researchers. The dataset, we believe, is one of the largest public multimedia datasets that has ever been released—99.3 million images and 0.7 million videos, all from Flickr and all under Creative Commons licensing.

The dataset (about 12GB) consists of a photo_id, a jpeg url or video url, and some corresponding metadata such as the title, description, title, camera type, title, and tags. Plus about 49 million of the photos are geotagged! What’s not there, like comments, favorites, and social network data, can be queried from the Flickr API.

The good news doesn’t stop there, the 100 million photos have been analyzed for standard features as well!

Enjoy!

June 20, 2014

Processing satellite imagery

Filed under: Image Processing,Mapping,Maps — Patrick Durusau @ 7:06 pm

Processing satellite imagery

From the post:

Need to add imagery to your map? This tutorial will teach you the basics of image processing for mapping, including an introduction to raster data, and how to acquire, publish and process raster imagery of our world.

Open-source and at your fingertips. Let’s dive in.

From Mapbox and very cool!

It’s not short so get a fresh cup of coffee and enjoy the tour!

May 8, 2014

Creating Maps From Drone Imagery

Filed under: Image Processing,Mapping — Patrick Durusau @ 2:31 pm

Creating Maps From Drone Imagery by Bobby Sudekum.

From the post:

Here is an end to end walkthrough showing how to process drone imagery into maps and then share it online, all using imagery we collected on a recent flight with the 3D Robotics team and their Aero drone.

Whether you are pulling data from someone else’s drone or your own, imagery will need post-capture processing.

One way to prevent illegal use of drones would be to require imagery transmission to include identifying codes and on open channels. Reasoning that if you were doing something illegal, you would not put your ID on it and transmit on an open channel. I may be wrong about that.

We have littered the ocean, land, space and now it appears we are going to litter the sky with drones.

More data to be sure but what use cases justify degradation of the sky?

March 17, 2014

Office Lens Is a Snap (Point and Map?)

Office Lens Is a Snap

From the post:

The moment mobile-phone manufacturers added cameras to their devices, they stopped being just mobile phones. Not only have lightweight phone cameras made casual photography easy and spontaneous, they also have changed the way we record our lives. Now, with help from Microsoft Research, the Office team is out to change how we document our lives in another way—with the Office Lens app for Windows Phone 8.

Office Lens, now available in the Windows Phone Store, is one of the first apps to use the new OneNote Service API. The app is simple to use: Snap a photo of a document or a whiteboard, and upload it to OneNote, which stores the image in the cloud. If there is text in the uploaded image, OneNote’s cloud-based optical character-recognition (OCR) software turns it into editable, searchable text. Office Lens is like having a scanner in your back pocket. You can take photos of recipes, business cards, or even a whiteboard, and Office Lens will enhance the image and put it into your OneNote Quick Notes for reference or collaboration. OneNote can be downloaded for free.

Less than five (5) years ago, every automated process in Office Lens would have been a configurable setting.

Today, it’s just point and shoot.

There is an interface lesson for topic maps in the Office Lens interface.

Some people will need the Office Lens API. But, the rest of us, just want to take a picture of the whiteboard (or some other display). Automatic storage and OCR are welcome added benefits.

What about a topic map authoring interface that looks a lot like MS Word™ or Open Office. A topic map is loaded much like a spelling dictionary. When the user selects “map-it,” links are inserted that point into the topic map.

Hover over such a link and data from the topic map is displayed. Can be printed, annotated, etc.

One possible feature would be “subject check” which displays the subjects “recognized” in the document. To enable the author to correct any recognition errors.

In case you are interested, I can point you to some open source projects that have general authoring interfaces. 😉

PS: If you have a Windows phone, can you check out Office Lens for me? I am still sans a cellphone of any type. Since I don’t get out of the yard a cellphone doesn’t make much sense. But I do miss out on the latest cellphone technology. Thanks!

February 20, 2014

Free FORMOSAT-2 Satellite Imagery

Filed under: Data,Image Processing — Patrick Durusau @ 2:22 pm

Free FORMOSAT-2 Satellite Imagery

Proposals due by March 31, 2014.

From the post:

ISPRS WG VI/5 is delighted to announce the call for proposals for free FORMOSAT-2 satellite data. Sponsored by the National Space Organization, National Applied Research Laboratories (NARLabs-NSPO) and jointly supported by the Chinese Taipei Society of Photogrammetry and Remote Sensing and the Center for Space and Remote Sensing Research (CSRSR), National Central University (NCU) of Taiwan, this research announcement provides an opportunity for researchers to carry out advanced researches and applications in their fields of interest using archived and/or newly acquired FORMOSAT-2 satellite images.

FORMOSAT-2 has a unique daily-revisiting capability to acquire images at a nominal ground resolution of 2 meters (panchromatic) or 8 meters (multispectral). The images are suitable for different researches and applications, such as land-cover and environmental monitoring, agriculture and natural resources studies, oceanography and coastal zone researches, disaster investigation and mitigation support, and others. Basic characteristics of FORMOSAT-2 are listed in Section III of this document and detailed information about FORMOSAT-2 is available at
<http://www.nspo.org.tw>.

Interested individuals are invited to submit a proposal according to the guidelines listed below. All topics and fields of application are welcome, especially proposals aiming for addressing issues related to the Societal Beneficial Areas of GEO/GEOSS (Group on Earth Observations/Global Earth Observation System of Systems, Figure 1). Up to 10 proposals will be selected by a reviewing committee. Each selected proposal will be granted 10 archived images (subject to availability) and/or data acquisition requests (DAR) free of charge. Proposals that include members of ISPRS Student Consortium or other ISPRS affiliated personnels as principal investigator (PI) or coinvestigators (CI) will be given higher priorities, so be sure to indicate ISPRS affiliations in the cover sheet of the proposal.

Let’s see, 2 meters, that’s smaller than the average Meth lab. Yes? I have read of trees dying from long term meth labs, those should be more than 2 meters. Other environmental clues to the production of Methamphetamine?

Has your locality thought about data crunching to supplement its traditional law enforcement efforts?

A better investment than small towns buying tanks.

I first saw this in a tweet by TH Schee.

January 28, 2014

Open Microscopy Environment

Filed under: Biology,Data,Image Processing,Microscopy — Patrick Durusau @ 5:23 pm

Open Microscopy Environment

From the webpage:

OME develops open-source software and data format standards for the storage and manipulation of biological microscopy data. It is a joint project between universities, research establishments, industry and the software development community.

Where you will find:

OMERO: OMERO is client-server software for visualization, management and analysis of biological microscope images.

Bio-Formats: Bio-Formats is a Java library for reading and writing biological image files. It can be used as an ImageJ plugin, Matlab toolbox, or in your own software.

OME-TIFF Format: A TIFF-based image format that includes the OME-XML standard.

OME Data Model: A common specification for storing details of microscope set-up and image acquisition.

More data formats for sharing of information. And for integration with other data.

Not only does data continue to expand but so does the semantics associated with it.

We have “big data” tools for the data per se. Have you seen any tools capable of managing the diverse semantics of “big data?”

Me neither.

I first saw this in a tweet by Paul Groth.

December 10, 2013

How to analyze 100 million images for $624

Filed under: Hadoop,Image Processing,OpenCV — Patrick Durusau @ 3:47 pm

How to analyze 100 million images for $624 by Pete Warden.

From the post:

Jetpac is building a modern version of Yelp, using big data rather than user reviews. People are taking more than a billion photos every single day, and many of these are shared publicly on social networks. We analyze these pictures to discover what they can tell us about bars, restaurants, hotels, and other venues around the world — spotting hipster favorites by the number of mustaches, for example.

[photo omitted]

Treating large numbers of photos as data, rather than just content to display to the user, is a pretty new idea. Traditionally it’s been prohibitively expensive to store and process image data, and not many developers are familiar with both modern big data techniques and computer vision. That meant we had to cut a path through some thick underbrush to get a system working, but the good news is that the free-falling price of commodity servers makes running it incredibly cheap.

I use m1.xlarge servers on Amazon EC2, which are beefy enough to process two million Instagram-sized photos a day, and only cost $12.48! I’ve used some open source frameworks to distribute the work in a completely scalable way, so this works out to $624 for a 50-machine cluster that can process 100 million pictures in 24 hours. That’s just 0.000624 cents per photo! (I seriously do not have enough exclamation points for how mind-blowingly exciting this is.)
….

There are a couple of other components that are necessary to reach the same results as Pete.

Seek HIPI for processing photos on Hadoop and OpenCV and the rest of Pete’s article for some very helpful tips.

September 13, 2013

Hypergraph-Based Image Retrieval for Graph-Based Representation

Filed under: Graphs,Hypergraphs,Image Processing — Patrick Durusau @ 4:26 pm

Hypergraph-Based Image Retrieval for Graph-Based Representation by Salim Jouili and Salvatore Tabbone.

Abstract:

In this paper, we introduce a novel method for graph indexing. We propose a hypergraph-based model for graph data sets by allowing cluster overlapping. More precisely, in this representation one graph can be assigned to more than one cluster. Using the concept of the graph median and a given threshold, the proposed algorithm detects automatically the number of classes in the graph database. We consider clusters as hyperedges in our hypergraph model and we index the graph set by the hyperedge centroids. This model is interesting to traverse the data set and efficient to retrieve graphs.

(Salim Jouili and Salvatore Tabbone, Hypergraph-based image retrieval for graph-based representation. Journal of the Pattern Recognition Society, April 2012. © 2012 Elsevier Ltd.)

From the introduction:

In the present work, we address the problematic of graph indexing using directly the graph domain. We provide a new approach based on the hypergraph model. The main idea of this contribution is first to re-organize the graph space (domain) into a hypergraph structure. In this hypergraph, each vertex is a graph and each hyperedge corresponds to a set of similar graphs. Second, our method uses this hypergraph structure to index the graph set by making use of the centroids of the hyperedges as index entries. By this way, our method does not need to store additional information about the graph set. In fact, our method creates an index that contains only pointers to some selected graphs from the dataset which is an interesting feature, especially, in the case of large datasets. Besides indexing, our method addresses also the navigation problem in a database of images represented by graphs. Thanks to the hypergraph structure, the navigation through the data set can be performed by a classical traversal algorithm. The experimental results show that our method provides good performance in term of indexing for tested image databases as well as for a chemical database containing about 35,000 graphs, which points out that the proposed method is scalable and can be applied in different domains to retrieve graphs including clustering, indexing and navigation steps.

Sounds very exciting until I think about the difficulty of constructing a generalized “semantic centroid.”

For example, what is the semantic distance between black and white?

Was disambiguation of black and white a useful thing. Yes/No?

Suggestions on how to develop domain specific “semantic centroids?”

August 12, 2013

Photographic Proof of a Subject?

Filed under: Graphics,Image Processing — Patrick Durusau @ 2:36 pm

Digitial photography brought photo manipulation within the reach of anyone with a computer. Not to mention lots of free publicity for Adobe’s Photoshop, as in the term photoshopping.

New ways to detect photoshopping are being developed.

Abstract:

We describe a geometric technique to detect physically inconsistent arrangements of shadows in an image. This technique combines multiple constraints from cast and attached shadows to constrain the projected location of a point light source. The consistency of the shadows is posed as a linear programming problem. A feasible solution indicates that the collection of shadows is physically plausible, while a failure to find a solution provides evidence of photo tampering. (Eric Kee, James F. O’Brien, and Hany Farid. “Exposing Photo Manipulation with Inconsistent Shadows“. ACM Transactions on Graphics, 32(4):28:1–12, September 2013. Presented at SIGGRAPH 2013.)

If your experience has been with “photoshopped” images of political candidates and obvious “gag” photos, consider that photo manipulation has a darker side:

Recent advances in computational photography, computer vision, and computer graphics allow for the creation of visually compelling photographic fakes. The resulting undermining of trust in photographs impacts law enforcement, national security, the media, advertising, e-commerce, and more. The nascent field of photo forensics has emerged to help restore some trust in digital photographs [Farid 2009] (from the introduction)

Beyond simple provenance, it could be useful to establish and associate with a photograph, analysis that supports its authenticity.

Exposing Photo Manipulation with Inconsistent Shadows. Webpage with extra resources.

Paper.

In case you had doubts, the technique is used by the authors to prove the Apollo lunar landing photo is not a fake.

PS: If images are now easy to use to misrepresent information, how much easier is it for textual data to be manipulated?

Thinking of those click-boxes, “yes, I agree to the terms of ….” on most websites.

August 7, 2013

Visualizing Astronomical Data with Blender

Filed under: Astroinformatics,Image Processing,Visualization — Patrick Durusau @ 6:42 pm

Visualizing Astronomical Data with Blender by Brian R. Kent.

From the post:

Astronomy is a visually stunning science. From wide-field multi-wavelength images to high-resolution 3D simulations, astronomers produce many kinds of important visualizations. Astronomical visualizations have the potential for generating aesthetically appealing images and videos, as well as providing scientists with the ability to inspect phase spaces not easily explored in 2D plots or traditional statistical analysis. A new paper is now available in the Publications of the Astronomical Society of the Pacific (PASP) entitled “Visualizing Astronomical Data with Blender.” The paper discusses:
(…)

Don’t just skip to the paper, Brian’s post has a video demo of Blender that you will want to see!

August 6, 2013

Lire

Filed under: Image Processing,Image Recognition,Searching — Patrick Durusau @ 6:29 pm

Lire

From the webpage:

LIRE (Lucene Image Retrieval) is an open source library for content based image retrieval, which means you can search for images that look similar. Besides providing multiple common and state of the art retrieval mechanisms LIRE allows for easy use on multiple platforms. LIRE is actively used for research, teaching and commercial applications. Due to its modular nature it can be used on process level (e.g. index images and search) as well as on image feature level. Developers and researchers can easily extend and modify Lire to adapt it to their needs.

The developer wiki & blog are currently hosted on http://www.semanticmetadata.net

An online demo can be found at http://demo-itec.uni-klu.ac.at/liredemo/

Lire will be useful if you start collecting images of surveillance cameras or cars going into or out of known alphabet agency parking lots.

July 26, 2013

Fingerprinting Data/Relationships/Subjects?

Filed under: Image Processing,Security — Patrick Durusau @ 2:58 pm

Virtual image library fingerprints data

From the post:

It’s inevitable. Servers crash. Applications misbehave. Even if you troubleshoot and figure out the problem, the process of problem diagnosis will likely involve numerous investigative actions to examine the configurations of one or more systems—all of which would be difficult to describe in any meaningful way. And every time you encounter a similar problem, you could end up repeating the same complex process of problem diagnosis and remediation.

As someone who deals with just such scenarios in my role as manager of the Scalable Datacenter Analytics Department at IBM Research, my team and I realized we needed a way to “fingerprint” known bad configuration states of systems. This way, we could reduce the problem diagnosis time by relying on fingerprint recognition techniques to narrow the search space.

Project Origami was thus born from this desire to develop an easier-to-use problem diagnosis system to troubleshoot misconfiguration problems in the data center. Origami, today a collaboration between IBM Open Collaborative Research, Carnegie Mellon University, the University of Toronto, and the University of California at San Diego, is a collection of tools for fingerprinting, discovering, and mining configuration information on a data center-wide scale. It uses public domain virtual image library, Olive, an idea created under this Open Collaborative Research a few years ago.

It even provides an ad-hoc interface to the users, as there is no rule language for them to learn. Instead, users give Origami an example of what they deem to be a bad configuration, which Origami fingerprints and adds to its knowledge base. Origami then continuously crawls systems in the data center, monitoring the environment for configuration patterns that match known bad fingerprints in its knowledge base. A match triggers deeper analytics that then examine those systems for problematic configuration settings.

Identifications of data, relationships and subjects could be expressed as “fingerprints.”

Searching by “fingerprints” would be far easier than any query language.

Reasoning that searching challenges users to bridge the semantic gap between them and content authors.

Query languages add another semantic gap, between users and query language designers.

Why useful results are obtained at all using query languages remains unexplained.

June 24, 2013

GraphLab Image Processing Toolkit – Image Stitching

Filed under: GraphLab,Graphs,Image Processing — Patrick Durusau @ 1:25 pm

GraphLab Image Processing Toolkit – Image Stitching by Danny Bickson.

From the post:

We got some exciting news from Dhruv Batra from Virginia Tech:

Dear Graphlab team,

As most of you know, I was working on the Graphlab computer vision toolbox last summer. The motivation behind it was to provide distributed implementations of computer vision algorithms as a service.

In that spirit, I am happy to announce that that my students and I have a produced a first version of CloudCV.

— In the first version, the only implemented algorithm is image stitching
— The front-end allows you to upload a collection of images, which will be stitched to create a panorama.

— The back-end is a server in my lab running our local repository of graphlab
— We are currently running stitching in shared-memory parallel mode with ncpus = 3.

— The ‘terminal’ in the webpage will show you familiar looking messages from graphlab.

Cheers,
Dhruv

Danny includes some images to try out.

Or, you can try some images from your favorite image repository. 😉

April 2, 2013

STScI’s Engineering and Technology Colloquia

Filed under: Astroinformatics,GPU,Image Processing,Knowledge Management,Visualization — Patrick Durusau @ 5:49 am

STScI’s Engineering and Technology Colloquia Series Webcasts by Bruce Berriman.

From the post:

Last week, I wrote a post about Michelle Borkin’s presentation on Astronomical Medicine and Beyond, part of the Space Telescope Science Institute’s (STScI) Engineering and Technology Colloquia Series. STScI archives and posts on-line all the presentations in this series. The talks go back to 2008 (with one earlier one dating to 2001), are generally given monthly or quarterly, and represent a rich source of information on many aspects of engineering and technology. The archive includes, where available, abstracts, Power Point Slides, videos for download, and for the more recent presentations, webcasts.

Definitely a astronomy/space flavor but also includes:

Scientific Data Visualization by Adam Bly (Visualizing.org, Seed Media Group).

Knowledge Retention & Transfer: What You Need to Know by Jay Liebowitz (UMUC).

Fast Parallel Processing Using GPUs for Accelerating Image Processing by Tom Reed (Nvidia Corporation).

Every field is struggling with the same data/knowledge issues, often using different terminologies or examples.

We can all struggle separately or we can learn from others.

Which approach do you use?

October 18, 2012

A Glance at Information-Geometric Signal Processing

Filed under: Image Processing,Image Recognition,Semantics — Patrick Durusau @ 2:18 pm

A Glance at Information-Geometric Signal Processing by Frank Nielsen.

Slides from the MAHI workship (Methodological Aspects of Hyperspectral Imaging)

From the workshop homepage:

The scope of the MAHI workshop is to explore new pathways that can potentially lead to breakthroughs in the extraction of the informative content of hyperspectral images. It will bring together researchers involved in hyperspectral image processing and in various innovative aspects of data processing.

Images, their informational content and the tools to analyze them have semantics too.

September 29, 2012

Visual Clues: A Brain “feature,” not a “bug”

You will read in When Your Eyes Tell Your Hands What to Think: You’re Far Less in Control of Your Brain Than You Think that:

You’ve probably never given much thought to the fact that picking up your cup of morning coffee presents your brain with a set of complex decisions. You need to decide how to aim your hand, grasp the handle and raise the cup to your mouth, all without spilling the contents on your lap.

A new Northwestern University study shows that, not only does your brain handle such complex decisions for you, it also hides information from you about how those decisions are made.

“Our study gives a salient example,” said Yangqing ‘Lucie’ Xu, lead author of the study and a doctoral candidate in psychology at Northwestern. “When you pick up an object, your brain automatically decides how to control your muscles based on what your eyes provide about the object’s shape. When you pick up a mug by the handle with your right hand, you need to add a clockwise twist to your grip to compensate for the extra weight that you see on the left side of the mug.

“We showed that the use of this visual information is so powerful and automatic that we cannot turn it off. When people see an object weighted in one direction, they actually can’t help but ‘feel’ the weight in that direction, even when they know that we’re tricking them,” Xu said. (emphasis added)

I never quite trusted my brain and now I have proof that it is untrustworthy. Hiding stuff indeed! 😉

But that’s the trick of subject identification/identity isn’t it?

That our brains “recognize” all manner of subjects without any effort on our part.

Another part of the effortless features of our brains. But it hides the information we need to integrate information stores from ourselves and others.

Or rather, making it more work than we are usually willing to devote to digging it out.

When called upon to be “explicit” about subject identification, or even worse, to imagine how other people identify subjects, we prefer to stay at home consuming passive entertainment.

Two quick points:

First, need to think about how to incorporate this “feature” into delivery interfaces for users.

Second, what subjects would users pay others to mine/collate/identify for them? (Delivery being a separate issue.)

September 1, 2012

“What Makes Paris Look Like Paris?”

Filed under: Geo Analytics,Geographic Data,Image Processing,Image Recognition — Patrick Durusau @ 3:19 pm

“What Makes Paris Look Like Paris?” by Erwin Gianchandani.

From the post:

We all identify cities by certain attributes, such as building architecture, street signage, even the lamp posts and parking meters dotting the sidewalks. Now there’s a neat study by computer graphics researchers at Carnegie Mellon University — presented at SIGGRAPH 2012 earlier this month — that develops novel computational techniques to analyze imagery in Google Street View and identify what gives a city its character….

From the abstract:

Given a large repository of geotagged imagery, we seek to automatically find visual elements, e.g. windows, balconies, and street signs, that are most distinctive for a certain geo-spatial area, for example the city of Paris. This is a tremendously difficult task as the visual features distinguishing architectural elements of different places can be very subtle. In addition, we face a hard search problem: given all possible patches in all images, which of them are both frequently occurring and geographically informative? To address these issues, we propose to use a discriminative clustering approach able to take into account the weak geographic supervision. We show that geographically representative image elements can be discovered automatically from Google Street View imagery in a discriminative manner. We demonstrate that these elements are visually interpretable and perceptually geo-informative. The discovered visual elements can also support a variety of computational geography tasks, such as mapping architectural correspondences and influences within and across cities, finding representative elements at different geo-spatial scales, and geographically-informed image retrieval.

The video and other resources are worth the time to review/read.

What features do you rely on to “recognize” a city?

The potential to explore features within a city or between cities looks particularly promising.

August 3, 2012

Halide Wins Image Processing Gold Medal!

Filed under: Graphics,Halide,Image Processing,Programming — Patrick Durusau @ 5:01 am

OK, the real title is: Decoupling Algorithms from Schedules for Easy Optimization of Image Processing Pipelines (Jonathan Ragan-Kelley, Andrew Adams, Sylvain Paris, Marc Levoy, Saman Amarasinghe, and Frédo Durand.)

And there is no image processing gold medal. (To avoid angry letters from the big O folks.)

Still, when an abstract says:

Using existing programming tools, writing high-performance image processing code requires sacrificing readability, portability, and modularity. We argue that this is a consequence of conflating what computations define the algorithm, with decisions about storage and the order of computation. We refer to these latter two concerns as the schedule, including choices of tiling, fusion, recomputation vs. storage, vectorization, and parallelism.

We propose a representation for feed-forward imaging pipelines that separates the algorithm from its schedule, enabling high-performance without sacrificing code clarity. This decoupling simplifies the algorithm specification: images and intermediate buffers become functions over an infinite integer domain, with no explicit storage or boundary conditions. Imaging pipelines are compositions of functions. Programmers separately specify scheduling strategies for the various functions composing the algorithm, which allows them to efficiently explore different optimizations without changing the algorithmic code.

We demonstrate the power of this representation by expressing a range of recent image processing applications in an embedded domain specific language called Halide, and compiling them for ARM, x86, and GPUs. Our compiler targets SIMD units, multiple cores, and complex memory hierarchies. We demonstrate that it can handle algorithms such as a camera raw pipeline, the bilateral grid, fast local Laplacian filtering, and image segmentation. The algorithms expressed in our language are both shorter and faster than state-of-the-art implementations.

Some excitement is understandable.

Expect programmers will generalize this decoupling of algorithms from storage and order.

What did Grace Slick say? “It’s a new dawn, people.”

Paper (12 MB PDF)

Code: http://halide-lang.org/

July 29, 2012

SAOImage DS9

Filed under: Astroinformatics,Image Processing — Patrick Durusau @ 2:00 pm

SAOImage DS9

From the webpage:

SAOImage DS9 is an astronomical imaging and data visualization application. DS9 supports FITS images and binary tables, multiple frame buffers, region manipulation, and many scale algorithms and colormaps. It provides for easy communication with external analysis tasks and is highly configurable and extensible via XPA and SAMP.

DS9 is a stand-alone application. It requires no installation or support files. All versions and platforms support a consistent set of GUI and functional capabilities.

DS9 supports advanced features such as 2-D, 3-D and RGB frame buffers, mosaic images, tiling, blinking, geometric markers, colormap manipulation, scaling, arbitrary zoom, cropping, rotation, pan, and a variety of coordinate systems.

The GUI for DS9 is user configurable. GUI elements such as the coordinate display, panner, magnifier, horizontal and vertical graphs, button bar, and color bar can be configured via menus or the command line.

New in Version 7

3-D Data Visualization

Previous versions of SAOImage DS9 would allow users to load 3-D data into traditional 2-D frames, and would allow users to step through successive z-dimension pixel slices of the data cube. To visualize 3-D data in DS9 v. 7.0, a new module, encompassed by the new Frame 3D option, allows users to load and view data cubes in multiple dimensions.

The new module implements a simple ray-trace algorithm. For each pixel on the screen, a ray is projected back into the view volume, based on the current viewing parameters, returning a data value if the ray intersects the FITS data cube. To determine the value returned, there are 2 methods available, Maximum Intensity Projection (MIP) and Average Intensity Projection (AIP). MIP returns the maximum value encountered, AIP returns an average of all values encountered. At this point, normal DS9 operations are applied, such as scaling, clipping and applying a color map.

Color Tags

The purpose of color tags are to highlight (or hide) certain values of data, regardless of the color map selected. The user creates, edits, and deletes color tags via the GUI. From the color parameters dialog, the user can load, save, and delete all color tags for that frame.

Cropping

DS9 now supports cropping the current image, via the GUI, command line, or XPA/SAMP in both 2-D and 3-D. The user may specify a rectangular region of the image data as a center and width/height in any coordinate system via the Crop Dialog, or can interactively select the region of the image to display by clicking and dragging while in Crop Mode.

I encountered SAOImage DS9 in the links section of an astroinformatics blog.

Good example of very high end image/data cube exploration/processing application.

You are likely to encounter a number of subjects worthy of comment using this application.

July 28, 2012

Montage: An Astronomical Image Mosaic Engine

Filed under: Astroinformatics,Image Processing — Patrick Durusau @ 7:56 pm

Montage An Astronomical Image Mosaic Engine

From the webpage:

Montage is a toolkit for assembling Flexible Image Transport System (FITS) images into custom mosaics.

Since I mentioned astronomical data earlier today I thought about including this for your weekend leisure time!

June 22, 2012

Sage Bionetworks and Amazon SWF

Sage Bionetworks and Amazon SWF

From the post:

Over the past couple of decades the medical research community has witnessed a huge increase in the creation of genetic and other bio molecular data on human patients. However, their ability to meaningfully interpret this information and translate it into advances in patient care has been much more modest. The difficulty of accessing, understanding, and reusing data, analysis methods, or disease models across multiple labs with complimentary expertise is a major barrier to the effective interpretation of genomic data. Sage Bionetworks is a non-profit biomedical research organization that seeks to revolutionize the way researchers work together by catalyzing a shift to an open, transparent research environment. Such a shift would benefit future patients by accelerating development of disease treatments, and society as a whole by reducing costs and efficacy of health care.

To drive collaboration among researchers, Sage Bionetworks built an on-line environment, called Synapse. Synapse hosts clinical-genomic datasets and provides researchers with a platform for collaborative analyses. Just like GitHub and Source Forge provide tools and shared code for software engineers, Synapse provides a shared compute space and suite of analysis tools for researchers. Synapse leverages a variety of AWS products to handle basic infrastructure tasks, which has freed the Sage Bionetworks development team to focus on the most scientifically-relevant and unique aspects of their application.

Amazon Simple Workflow Service (Amazon SWF) is a key technology leveraged in Synapse. Synapse relies on Amazon SWF to orchestrate complex, heterogeneous scientific workflows. Michael Kellen, Director of Technology for Sage Bionetworks states, “SWF allowed us to quickly decompose analysis pipelines in an orderly way by separating state transition logic from the actual activities in each step of the pipeline. This allowed software engineers to work on the state transition logic and our scientists to implement the activities, all at the same time. Moreover by using Amazon SWF, Synapse is able to use a heterogeneity of computing resources including our servers hosted in-house, shared infrastructure hosted at our partners’ sites, and public resources, such as Amazon’s Elastic Compute Cloud (Amazon EC2). This gives us immense flexibility is where we run computational jobs which enables Synapse to leverage the right combination of infrastructure for every project.”

The Sage Bionetworks case study (above) and another one, NASA JPL and Amazon SWF, will get you excited about reaching out to the documentation on Amazon Simple Workflow Service (Amazon SWF).

In ways that presentations that consist of reading slides about management advantages to Amazon SWF simply can’t reach. At least not for me.

Take the tip and follow the case studies, then onto the documentation.

Full disclosure: I have always been fascinated by space and really hard bioinformatics problems. And have < 0 interest in DRM antics on material if piped to /dev/null would raise a user's IQ.

June 16, 2012

Does She or Doesn’t She?

Filed under: Image Processing,Image Understanding,Information Integration,Topic Maps — Patrick Durusau @ 2:57 pm

Information Processing: Adding a Touch of Color

From the post:

An innovative computer program brings color to grayscale images.

Creating a high-quality realistic color image from a grayscale picture can be challenging. Conventional methods typically require the user’s input, either by using a scribbling tool to color the image manually or by using a color transfer. Both options can result in poor colorization quality limited by the user’s degree of skill or the range of reference images available.

Alex Yong-Sang Chia at the A*STAR’s Institute for Infocomm Research and co-workers have now developed a computer program that utilizes the vast amount of imagery available on the internet to find suitable color matches for grayscale images. The program searches hundreds of thousands of online color images, cross-referencing their key features and objects in the foreground with those of grayscale pictures.

“We have developed a method that takes advantage of the plentiful supply of internet data to colorize gray photos,” Chia explains. “The user segments the image into separate major foreground objects and adds semantic labels naming these objects in the gray photo. Our program then scans the internet using these inputs for suitable object color matches.”

If you think about it for a moment, it appears that subject recognition in images is being performed here. As the researchers concede, its not 100% but then it doesn’t need to be. They have human users in the loop.

I wonder if the human users have to correct the coloration for an image more than once for a source of color image? That is does the system “remember” earlier choices?

The article doesn’t say so I will follow up with an email.

Keeping track of user-corrected subject recognition would create a bread crumb trail for other users confronted with the same images. (In other words, a topic map.)

May 20, 2012

Finding Waldo, a flag on the moon and multiple choice tests, with R

Filed under: Graphics,Image Processing,Image Recognition,R — Patrick Durusau @ 6:28 pm

Finding Waldo, a flag on the moon and multiple choice tests, with R by Arthur Charpentier.

From the post:

I have to admit, first, that finding Waldo has been a difficult task. And I did not succeed. Neither could I correctly spot his shirt (because actually, it was what I was looking for). You know, that red-and-white striped shirt. I guess it should have been possible to look for Waldo’s face (assuming that his face does not change) but I still have problems with size factor (and resolution issues too). The problem is not that simple. At the http://mlsp2009.conwiz.dk/ conference, a price was offered for writing an algorithm in Matlab. And one can even find Mathematica codes online. But most of the those algorithms are based on the idea that we look for similarities with Waldo’s face, as described in problem 3 on http://www1.cs.columbia.edu/~blake/‘s webpage. You can find papers on that problem, e.g. Friencly & Kwan (2009) (based on statistical techniques, but Waldo is here a pretext to discuss other issues actually), or more recently (but more complex) Garg et al. (2011) on matching people in images of crowds.

Not sure how often you will want to find Waldo but then you may not be looking for Waldo.

Tipped off to this post by Simply Statistics.

April 2, 2012

SAXually Explicit Images: Data Mining Large Shape Databases

Filed under: Data Mining,Image Processing,Image Recognition,Shape — Patrick Durusau @ 5:46 pm

SAXually Explicit Images: Data Mining Large Shape Databases by Eamonn Keogh.

ABSTRACT

The problem of indexing large collections of time series and images has received much attention in the last decade, however we argue that there is potentially great untapped utility in data mining such collections. Consider the following two concrete examples of problems in data mining.

Motif Discovery (duplication detection): Given a large repository of time series or images, find approximately repeated patterns/images.

Discord Discovery: Given a large repository of time series or images, find the most unusual time series/image.

As we will show, both these problems have applications in fields as diverse as anthropology, crime…

Ancient history in the view of some, this is a Google talk from 2006!

But, it is quite well done and I enjoyed the unexpected application of time series representation to shape data for purposes of evaluating matches. It is one of those insights that will stay with you and that seems obvious after they say it.

I think topic map authors (semantic investigators generally) need to report such insights for the benefit of others.

« Newer PostsOlder Posts »

Powered by WordPress