Another Word For It Patrick Durusau on Topic Maps and Semantic Diversity

July 23, 2014

An A to Z of…D3 force layout

Filed under: D3,Graphics,Graphs,Visualization — Patrick Durusau @ 1:01 pm

An A to Z of extra features for the D3 force layout by Simon Raper.

From the post:

Since d3 can be a little inaccessible at times I thought I’d make things easier by starting with a basic skeleton force directed layout (Mike Bostock’s original example) and then giving you some blocks of code that can be plugged in to add various features that I have found useful.

The idea is that you can pick the features you want and slot in the code. In other words I’ve tried to make things sort of modular. The code I’ve taken from various places and adapted so thank you to everyone who has shared. I will try to provide the credits as far as I remember them!

A great read and an even greater bookmark for graph layouts.

In Simon’s alphabet:

A is for arrows.

B is for breaking links.

C is for collision detection.

F is for fisheye.

H is for highlighting.

L is for labels.

P is for pinning down nodes.

S is for search.

T is for tooltip.

Not only does Simon show the code, he also shows the result of the code.

A model of how to post useful information on D3.

July 21, 2014

Graffeine

Filed under: D3,Graphs,Neo4j,Visualization — Patrick Durusau @ 4:37 pm

Graffeine by Julian Browne

From the webpage:

Caffeinated Graph Exploration for Neo4J

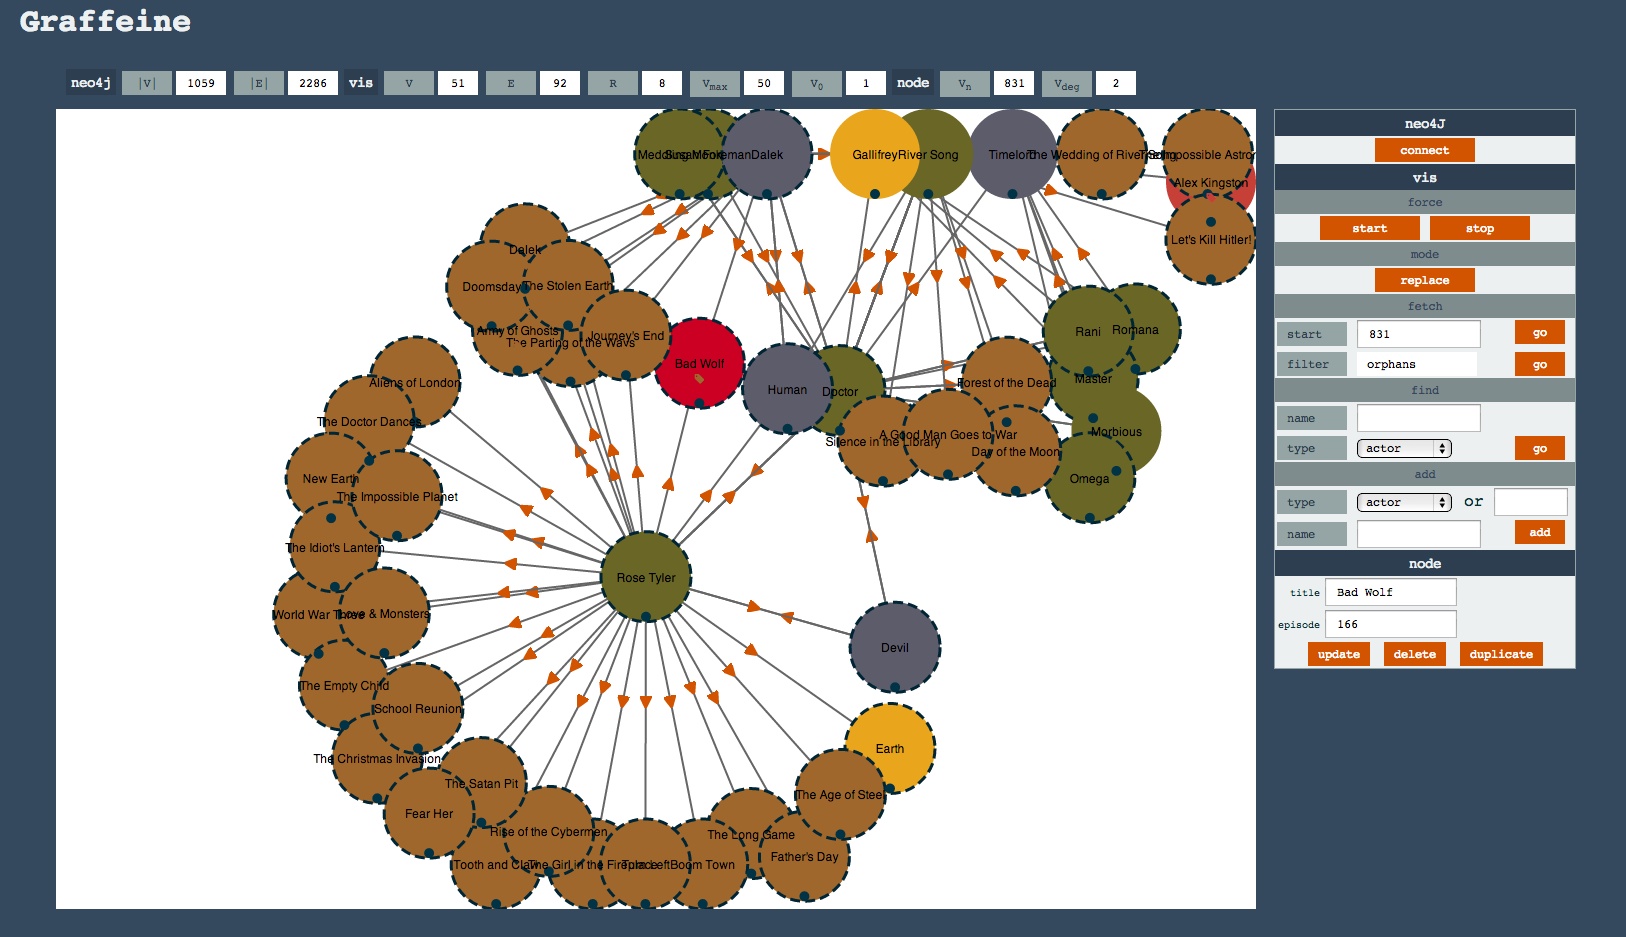
Graffeine is both a useful interactive demonstrator of graph capability and a simple visual administration interface for small graph databases.

Here it is with the, now canonical, Dr Who graph loaded up:

Dr. Who graph

From the description:

Graffeine plugs into Neo4J and renders nodes and relationships as an interactive D3 SVG graph so you can add, edit, delete and connect nodes. It’s not quite as easy as a whiteboard and a pen, but it’s close, and all interactions are persisted in Neo4J.

You can either make a graph from scratch or browse an existing one using search and paging. You can even “fold” your graph to bring different aspects of it together on the same screen.

Nodes can be added, updated, and removed. New relationships can be made using drag and drop and existing relationships broken.

It’s by no means phpmyadmin for Neo4J, but one day it could be (maybe).

A great example of D3 making visual editing possible.

July 15, 2014

Graph Classes and their Inclusions

Filed under: Graphs,Mathematics — Patrick Durusau @ 4:25 pm

Information System on Graph Classes and their Inclusions

From the webpage:

What is ISGCI?

ISGCI is an encyclopaedia of graphclasses with an accompanying java application that helps you to research what’s known about particular graph classes. You can:

  • check the relation between graph classes and get a witness for the result
  • draw clear inclusion diagrams
  • colour these diagrams according to the complexity of selected problems
  • find the P/NP boundary for a problem
  • save your diagrams as Postscript, GraphML or SVG files
  • find references on classes, inclusions and algorithms

As of 214-07-06, the database contains 1497 classes and 176,888 inclusions.

If you are past the giddy stage of “Everything’s a graph!,” you may find this site useful.

July 9, 2014

Publication Quality Graphs With LaTeX

Filed under: Graphs,TeX/LaTeX — Patrick Durusau @ 3:50 pm

The question was asked on the Tex-LaTex Stack Exchange: How to draw graphs in LaTeX?

If you want professional quality graphs, see the answer and resources cited.

Enjoy!

July 6, 2014

The Zen of Cypher

Filed under: Cypher,Graphs,Neo4j — Patrick Durusau @ 2:53 pm

The Zen of Cypher by Nigel Small.

The original “Zen” book, Zen and the art of motorcycle maintenance: an inquiry into values runs four hundred and eighteen pages.

Nigel has a useful summary for Cypher but I would estimate it runs about a page.

Not really the in depth sort of treatment that qualifies for a “Zen” title.

Yes?

Graph Hairballs, Impressive but Not Informative

Filed under: Graphs,Visualization — Patrick Durusau @ 2:35 pm

Large-Scale Graph Visualization and Analytics by Kwan-Liu Ma and Chris W. Muelder. (Computer, June 2013)

Abstract:

Novel approaches to network visualization and analytics use sophisticated metrics that enable rich interactive network views and node grouping and filtering. A survey of graph layout and simplification methods reveals considerable progress in these new directions.

We have all seen large graph hairballs that are as impressive as they are informative. Impressive to someone who has recently discovered “…everything is a graph…” but not to anyone else.

Ma and Muelder do an excellent job of constrasting traditional visualizations that result in “…an unintelligible hairball—a tangled mess of lines” versus more informative techniques.

Among the methods touched upon are:

References at the end of the article should get you started towards useful visualizations of large scale graphs.

PS: I assume the article is based in part on C.W. Muelder’s “Advanced Visualization Techniques for Abstract Graphs and Computer Networks,” PhD dissertation, Dept. Computer Science, University of Calif., Davis, 2011. It is cited among the references. Published by ProQuest which means the 130 page dissertation runs $62.10 in paperback.

Let me know if you run across a more reasonably accessible copy.

I first saw this in a tweet by Paul Blaser.

June 30, 2014

Quick Play with Cayley Graph DB…

Filed under: Cayley,Graphs — Patrick Durusau @ 4:20 pm

Quick Play with Cayley Graph DB and Ordnance Survey Linked Data by John Goodwin.

From the post:

Earlier this month Google announced the release of the open source graph database/triplestore Cayley. This weekend I thought I would have a quick look at it, and try some simple queries using the Ordnance Survey Linked Data.

Just unpack to install.

Loading data is almost that easy, except that the examples are limited to n-triple format and the documentation doesn’t address importing other data types.

Has a Gremlin-“inspired” query language, which makes me wonder what shortcoming in Gremlin is addressed by this new query language?

If there is, that isn’t apparent from the documentation which is rather sparse at the moment.

It will be interesting to see if Cayley goes beyond the capabilities of the average graph db or not.

June 29, 2014

Snark Hunting: Force Directed Graphs in D3

Filed under: D3,Graphs,Visualization — Patrick Durusau @ 7:13 pm

Snark Hunting: Force Directed Graphs in D3 by Stephen Hall.

From the post:

Is it possible to write a blog post that combines d3.js, pseudo-classical JavaScript, graph theory, and Lewis Carroll? Yes, THAT Lewis Carroll. The one who wrote Alice in Wonderland. We are going to try it here. Graphs can be pretty boring so I thought I would mix in some fun historical trivia to keep it interesting as we check out force directed graphs in D3. In this post we are going to develop a tool to load up, display, and manipulate multiple graphs for exploration using the pseudo-classical pattern in JavaScript. We’ll add in some useful features, a bit of style, and some cool animations to make a finished product (see the examples below).

As usual, the demos presented here use a minimal amount of code. There’s only about 250 lines of JavaScript (if you exclude the comments) in these examples. So it’s enough to be a good template for your own project without requiring a ton of time to study and understand. The code includes some useful lines to keep the visualization responsive (without requiring JQuery) and methods that do things like remove or add links or nodes.

There’s also a fun “shake” method to help minimize tangles when the graph is displayed by agitating the nodes a little. I find it annoying when the graph doesn’t display correctly when it loads, so we’ll take care of that. Additionally, the examples incorporate a set of controls to help understand and explore the effect of the various D3 force layout parameters using the awesome dat.gui library from Google. You can see a picture of the controls above. We’ll cover the controls in depth below, but first I’ll introduce the examples and talk a little bit about the data.

I don’t think graphs are boring at all but must admit that adding Lewis Carroll to the mix doesn’t hurt a bit.

Great way to start off the week!

PS: The Hunting of the Snark (An Agony in 8 Fits) (PDF, 1876 edition)

June 25, 2014

Gremlin and Visualization with Gephi [Death of Import/Export?]

Filed under: Gephi,Graphs,Gremlin,TinkerPop — Patrick Durusau @ 6:55 pm

Gremlin and Visualization with Gephi by Stephen Mallette.

From the post:

We are often asked how to go about graph visualization in TinkerPop. We typically refer folks to Gephi or Cytoscape as the standard desktop data visualization tools. The process of using those tools involves: getting your graph instance, saving it to GraphML (or the like) then importing it to those tools

TinkerPop3 now does two things to help make that process easier:

  1. A while back we introduced the “subgraph” step which allows you to pop-off a Graph instance from a Traversal, which help greatly simplify the typical graph visualization process with Gremlin, where you are trying to get a much smaller piece of your large graph to focus the visualization effort.
  2. Today we introduce a new :remote command in the Console. Recall that :remote is used to configure a different context where Gremlin will be evaluated (e.g. Gremlin Server). For visualization, that remote is called “gephi” and it configures the :submit command to take any Graph instance and push it through to the Gephi Streaming API. No more having to import/export files!

This rocks!

How do you imagine processing your data when import/export goes away?

Of course, this doesn’t have anything on *nix pipes but it is nice to see good ideas come back around.

Cayley

Filed under: Cayley,Graph Databases,Graphs — Patrick Durusau @ 6:45 pm

Cayley – An open-source graph database

From the webpage:

Cayley is an open-source graph inspired by the graph database behind Freebase and Google’s Knowledge Graph.

Its goal is to be a part of the developer’s toolbox where Linked Data and graph-shaped data (semantic webs, social networks, etc) in general are concerned.

Features

  • Written in Go
  • Easy to get running (3 or 4 commands, below)
  • RESTful API
    • or a REPL if you prefer
  • Built-in query editor and visualizer
  • Multiple query languages:
    • Javascript, with a Gremlin-inspired* graph object.
    • (simplified) MQL, for Freebase fans
  • Plays well with multiple backend stores:
  • Modular design; easy to extend with new languages and backends
  • Good test coverage
  • Speed, where possible.

Rough performance testing shows that, on consumer hardware and an average disk, 134m triples in LevelDB is no problem and a multi-hop intersection query — films starring X and Y — takes ~150ms.

If you are seriously thinking about a graph database, see also these comments. Not everything you need to know but useful comments none the less.

I first saw this in a tweet from Hacker News.

June 24, 2014

UbiGraph WARNING: Out Dated Software

Filed under: Graphs,Neo4j — Patrick Durusau @ 3:45 pm

Rendering a Neo4j Database in UbiGraph by Michael Hunger.

Michael covers loading and visualizing data with UbiGraph.

The UbiGraph pages document UbiGraph alpha-0.2.4 and it dates from June 2008. That build is targeted at Ubuntu 8.04 x86_64.

Without the source code, I’m not sure you need to spend a lot of effort on UbiGraph.

The year 2008 was what, twenty web-years ago?

June 18, 2014

Time-Based Versioned Graphs

Filed under: Graphs,Neo4j,Versioning — Patrick Durusau @ 5:02 pm

Time-Based Versioned Graphs

From the post:

Many graph database applications need to version a graph so as to see what it looked like at a particular point in time. Neo4j doesn’t provide intrinsic support either at the level of its labelled property graph or in the Cypher query language for versioning. Therefore, to version a graph we need to make our application graph data model and queries version aware.

Separate Structure From State

The key to versioning a graph is separating structure from state. This allows us to version the graph’s structure independently of its state.

To help describe how to design a version-aware graph model, I’m going to introduce some new terminology: identity nodes, state nodes, structural relationships and state relationships.

Identity Nodes

Identity nodes are used to represent the positions of entities in a domain-meaningful graph structure. Each identity node contains one or more immutable properties, which together constitute an entity’s identity. In a version-free graph (the kind of graph we build normally) nodes tend to represent both an entity’s position and its state. Identity nodes in a version-aware graph, in contrast, serve only to identify and locate an entity in a network structure.

Structural Relationships

Identity nodes are connected to one another using timestamped structural relationships. These structural relationships are similar to the domain relationships we’d include in a version-free graph, except they have two additional properties, from and to, both of which are timestamps.

State Nodes and Relationships

Connected to each identity node are one or more state nodes. Each state node represents a snapshot of an entity’s state. State nodes are connected to identity nodes using timestamped state relationships.

Great modeling example but you have to wonder about a graph implementation that doesn’t support versioning out of the box.

It can be convenient to treat data as though it were stable, but we all know that isn’t true.

Don’t we?

GPS: A Graph Processing System

Filed under: Giraph,Graphs,Green-Mari,Pregel — Patrick Durusau @ 2:25 pm

GPS: A Graph Processing System

From the post:

GPS is an open-source system for scalable, fault-tolerant, and easy-to-program execution of algorithms on extremely large graphs. GPS is similar to Google’s proprietary Pregel system, and Apache Giraph.GPS is a distributed system designed to run on a cluster of machines, such as Amazon’s EC2.

In systems such as GPS and Pregel, the input graph (directed, possibly with values on edges) is distributed across machines and vertices send each other messages to perform a computation. Computation is divided into iterations called supersteps. Analogous to the map() and reduce() functions of the MapReduce framework, in each superstep a user-defined function called vertex.compute() is applied to each vertex in parallel. The user expresses the logic of the computation by implementing vertex.compute(). This design is based on Valiant’s Bulk Synchronous Parallel model of computation. A detailed description can be found in the original Pregel paper.

There are five main differences between Pregel and GPS:

  • GPS is open-source.
  • GPS extends Pregel’s API with a master.compute() function, which enables easy and efficient implementation of algorithms that are composed of multiple vertex-centric computations, combined with global computations
  • GPS has an optional dynamic repartitioning scheme, which reassigns vertices to different machines during graph computation to improve performance, based on observing communication patterns.
  • GPS has an optimization called LALP that reduces the network I/O in when running certain algorithms on real-world graphs that have skewed degree distributions.
  • GPS programs can be implemented using a higher-level domain specific language called Green-Marl, and automatically compiled into native GPS code. Green-Marl is a traditional imperative language with several graph-specific language constructs that enable intuitive and simple expression of complicated algorithms.

We have completed an initial version of GPS, which is available to download. We have run GPS on up to 100 Amazon EC2 large instances and on graphs of up to 250 million vertices and 10 billion edges. (emphasis added)

In light of the availability and performance statement, I suppose we can overlook the choice of a potentially confusing acronym. 😉

The Green-Marl compiler can be used to implement algorithms for GPS. Consult the Green-Marl paper before deciding its assumptions about processing will fit your use cases.

The team also wrote: Optimizing Graph Algorithms on Pregel-like Systems, due to appear in VLDB 2014.

I first saw this in a tweet by James Thornton.

June 13, 2014

SecureGraph Slides!

Filed under: Accumulo,Graphs,SecureGraph — Patrick Durusau @ 3:10 pm

Open Source Graph Analysis and Visualization by Jeff Kunkle.

From the description:

Lumify is a relatively new open source platform for big data analysis and visualization, designed to help organizations derive actionable insights from the large volumes of diverse data flowing through their enterprise. Utilizing popular big data tools like Hadoop, Accumulo, and Storm, it ingests and integrates many kinds of data, from unstructured text documents and structured datasets, to images and video. Several open source analytic tools (including Tika, OpenNLP, CLAVIN, OpenCV, and ElasticSearch) are used to enrich the data, increase its discoverability, and automatically uncover hidden connections. All information is stored in a secure graph database implemented on top of Accumulo to support cell-level security of all data and metadata elements. A modern, browser-based user interface enables analysts to explore and manipulate their data, discovering subtle relationships and drawing critical new insights. In addition to full-text search, geospatial mapping, and multimedia processing, Lumify features a powerful graph visualization supporting sophisticated link analysis and complex knowledge representation.

The full story of SecureGraph isn’t here but the slides are enough to tempt me into finding out more.

You?

I first saw this in a tweet by Stephen Mallette.

June 12, 2014

Importing CSV data into Neo4j…

Filed under: CSV,Graphs,Neo4j — Patrick Durusau @ 7:44 pm

Importing CSV data into Neo4j to make a graph by Samantha Zeitlin.

From the post:

Thanks to a friend who wants to help more women get into tech careers, last year I attended Developer Week, where I was impressed by a talk about Neo4j.

Graph databases excited me right away, since this is a concept I’ve used for brainstorming since 3rd grade, when my teachers Mrs. Nysmith and Weaver taught us to draw webbings as a way to take notes and work through logic puzzles.

Samantha is successful at importing CSV data into Neo4j but only after encountering an out-dated blog post, a stack overflow example and then learning there is a new version of the importer available.

True, many of us learned *nix from the man pages but while effective, I can’t really say it was an efficient way to learn *nix.

Most people have a task for your software. They are not seeking to mind meld with it or to take it up as a new religion.

Emphasize the ease of practical use of your software and you will gain devotees despite it being easy to use.

SecureGraph

Filed under: Accumulo,Blueprints,ElasticSearch,Graphs,SecureGraph — Patrick Durusau @ 6:56 pm

SecureGraph

From the webpage:

SecureGraph is an API to manipulate graphs, similar to Blueprints. Unlike Blueprints, every Secure graph method requires authorizations and visibilities. SecureGraph also supports multivalued properties as well as property metadata.

The SecureGraph API was designed to be generic, allowing for multiple implementations. The only implementation provided currently is built on top of Apache Accumulo for data storage and Elasticsearch for indexing.

According to the readme file, definitely “beta” software but interesting software none the less.

Are you using insecure graph software?

Might be time to find out!

I first saw this in a tweet by Marko A. Rodriguez

June 11, 2014

Network Data (And Merging Graphs)

Filed under: Data,Graphs,Networks — Patrick Durusau @ 7:20 pm

Network Data by Mark Newman.

From the webpage:

This page contains links to some network data sets I’ve compiled over the years. All of these are free for scientific use to the best of my knowledge, meaning that the original authors have already made the data freely available, or that I have consulted the authors and received permission to the post the data here, or that the data are mine. If you make use of any of these data, please cite the original sources.

The data sets are in GML format. For a description of GML see here. GML can be read by many network analysis packages, including Gephi and Cytoscape. I’ve written a simple parser in C that will read the files into a data structure. It’s available here. There are many features of GML not supported by this parser, but it will read the files in this repository just fine. There is a Python parser for GML available as part of the NetworkX package here and another in the igraph package, which can be used from C, Python, or R. If you know of or develop other software (Java, C++, Perl, R, Matlab, etc.) that reads GML, let me know.

I count sixteen (16) data sets and seven (7) collections of data sets.

Reminded me of a tweet I saw today:

Glimpse Conference

It’s used to be the social graph, then the interest-graph. Now, w/ social shopping it’s all about the taste graph. (emphasis added)

That’s three very common graphs and we all belong to networks or have interests that could be represented as still others.

After all the labor that goes into the composition of a graph, Mr. Normalization Graph would say we have to re-normalize these graphs to use them together.

That sounds like a bad plan. To me, reduplicating work that has already been done is always a bad plan.

If we could merge nodes and edges of two or more graphs together, then we can leverage the prior work on both graphs.

Not to mention that after merging, the unified graph could be searched, visualized and explored with less capable graph software and techniques.

Something to keep in mind.

I first saw this in a tweet by Steven Strogatz.

Sparksee Mobile Graph DB for iOS/Android

Filed under: Graphs,Smart-Phones — Patrick Durusau @ 4:58 pm

Graph Databases power in-device analytical appplications: Sparksee Mobile, the first graph database available for iOS and Android.

From the post:

Mobile device data analytics is going to be an important issue in the next few years. Hardware improvements like more efficient batteries, larger memories and more conscious energy consumption will be crucial to allow for complex computations in such devices. Added to that, the analytics capability analytical engines embedded in a mobile device will also allow the users to gather and manage their own private data with analytic objectives at the tip of their fingers.

Graph databases will be important in that area with situations where the mobile device will have to solve different problems like the management of the mobile data, social network analytics, mobile device security, geo-localized medical surveillance and real time geo-localized travel companion services.

Sparksee 5 mobile is an important provider player for mobile analytics applications, being the first graph database for Android and iOS. Sparksee small footprint of less that 50Kbytes* makes it especially attractive for mobile devices along with its high performance capabilities and the compact storage space required. Sparksee is powered by a research-based technology that makes an intensive use of bitmaps allowing for the use of simple logic operations and remarkable data locality to solve graph analytics.

Do you want to be among the first applications making real use of the device hardware possibilities? Have you considered resolving your analytical operations in the device, storing & querying the information in a graph database instead of having an external server? Let us know what do you think about this new possibilities and which applications do you think will benefit more of having an in-device real time process.

Download Sparksee graph database mobile for free at: http://sparsity-technologies.com/#download

You know, we used to talk about how to deliver topic maps to cellphones.

If merging were handled server-side, delivery of a topic map as a graph to a smartphone, that could be all the navigation capability that a smartphone user would need.

Something to think about, very seriously.

June 6, 2014

Offshore Leaks:…Azerbaijan

Filed under: Graphs,Neo4j — Patrick Durusau @ 2:26 pm

How to use Neo4j to analyse the Offshore Leaks : the case of Azerbaijan by Jean Villedieu.

From the post:

Introduction to Problem

The Offshore Leaks released in 2013 by the ICIJ is a rarity. It is a big dataset of real information about some of the most secret places on earth : the offshore financial centers. The investigation of the ICIJ brought to the surface many interesting stories including the suspicious activities of the President of Azerbaijan. We are going to see how graph technologies can help us make sense of the complex data in the Offshore Leaks.

Our data model for the Offshore Leaks

We want to know how the President of Azerbaijan is connected to offshore accounts. This means that we will need to focus on the network he uses to control his assets stored in offshore entities. These networks includes family members and a complex set of intermediaries or partners. We want to see how things are connected so we are going to have to represent each of these entities as distinct nodes in a graph.

A good tutorial on Neo4j, Cypher (query language) and modeling data.

Notice I didn’t say “modeling data with graphs.” That is the result in this case but modeling data should inform your choice of storage or analytical solutions. Saying that graphs can model any data is a truism that doesn’t lead to informed IT choices.

In this particular case I would suggest using graphs, in part because the relationships between actors and their types aren’t known in advance. Some aspects of stock trading systems would not present the same issues.

Graphs don’t have this as an inherent limitation but if several groups were gathering information about President Ilham Aliyev and quite easily using different names/identifiers, how would you merge those graphs together? Would you have to re-create the relationships between actors if new nodes had to replace old ones?

Graphs are very good for some data. Distributed and collaborative graphs are even better.

Further information on Offshore Leaks.

I first saw this in a tweet by GraphemeDB.

June 3, 2014

The Rise of Gremlitron

Filed under: Graphs,Gremlin — Patrick Durusau @ 1:48 pm

TinkerPop3 RFClease — The Rise of Gremlitron by Marko A. Rodriguez.

From the post:

TinkerPop3’s SNAPSHOT release is now ready for review, comments, and brave souls wishing to do implementations.
CODE: https://github.com/tinkerpop/tinkerpop3
DOCS: http://tinkerpop.com/docs/current/

There are lots of new things about TinkerPop3 and I would like to take the time to review some of the best parts here:

1. Blueprints, Frames, Pipes, Furnace, and Rexster are no longer terms…
– Blueprints => Gremlin Structure
– Blueprints/Pipes => Gremlin Process
– Frames => Gremlin DSLs
– Furnace => Gremlin OLAP (GraphComputer)
– Rexster => Gremlin Server

…..

Gremlitron

Marko has always had a way with images!

In order to appreciate all the changes in this release of Gremlin, you will need to take the test drive. Reading the short descriptions or kicking the wheels is no substitute for trying it against your existing or anticipated graphs.

I would call out the obvious topic map issue, that of changing the traditional names to “Gremlin + (some string).”

I rather doubt anyone is going to hunt down existing email, documentation, notes, presentations, etc. and clean up all the references to Blueprints, Frames, Pipes, Furnace and Rexster. How important is that? Hard to say right now but it is the sort of issue that topic maps were designed to solve.

Could be important in terms of researching prior art, assuming that U.S. patent law continues to deteriorate. I’m thinking about patenting numerical order. Opps! Should not have said that! 😉

Enjoy!

June 2, 2014

Powers of Ten – Part II

Filed under: Faunus,Graphs,Gremlin,Titan — Patrick Durusau @ 6:54 pm

Powers of Ten – Part II by Stephen Mallette.

From the post:

“‘Curiouser and curiouser!’ cried Alice (she was so much surprised, that for the moment she quite forgot how to speak good English); ‘now I’m opening out like the largest telescope that ever was!”
    — Lewis CarrollAlice’s Adventures in Wonderland

It is sometimes surprising to see just how much data is available. Much like Alice and her sudden increase in height, in Lewis Carroll’s famous story, the upward growth of data can happen quite quickly and the opportunity to produce a multi-billion edge graph becomes immediately present. Luckily, Titan is capable of scaling to accommodate such size and with the right strategies for loading this data, the development efforts can more rapidly shift to the rewards of massive scale graph analytics.

This article represents the second installment in the two part Powers of Ten series that discusses bulk loading data into Titan at varying scales. For purposes of this series, the “scale” is determined by the number of edges to be loaded. As it so happens, the strategies for bulk loading tend to change as the scale increases over powers of ten, which creates a memorable way to categorize different strategies. “Part I” of this series, looked at strategies for loading millions and tens of millions of edges and focused on usage of Gremlin to do so. This part of the series will focus on hundreds of millions and billions of edges and will focus on the usage of Faunus as the loading tool.

Note: By Titan 0.5.0, Faunus will be pulled into the Titan project under the name Titan/Hadoop.

Scaling to graph processing to hundreds of millions and billions of edges.

Deeply interesting work but I am left with multiple questions:

  • Hundreds of millions and billions of edges, to load. Any other graph metrics? Traversal for example?
  • Does loading performance scale with more servers? Instead of m2.4xlarge EC2 instances, what is the performance with 8x?
  • What kind of knob tuning was useful with a social network dataset?

I am sure there are other questions but those are the first ones that came to mind.

June 1, 2014

OrientDB 1.7 is out!

Filed under: Graphs,OrientDB — Patrick Durusau @ 7:05 pm

OrientDB 1.7 is out!

From the post:

Breaking news: OrientDB 1.7 is out! We made OrientDB faster than before and with new exciting features like Distributed Sharding, the support for Lucene indexes (Full-Text and GEO-Spatial), SSL connections, Parallel queries and more.

To download OrientDB 1.7 go to: http://www.orientechnologies.com/download/

What’s new?

Core

  • New “minimumclusters” to auto-create X clusters per class
  • New cluster strategy to pick the cluster. Available round-robin, default and balanced
  • Added record locking via API
  • Removed rw/locks on schema and index manager
  • Cached most used users and roles in RAM (configurable)

See the full listing of new features at the announcement or better yet, download OrientDB 1.7 and try the new features out!

May 31, 2014

Rneo4j

Filed under: Graphs,Neo4j,R — Patrick Durusau @ 9:37 am

Nicole White has authored an R driver for Neo4j known as Rneo4j.

To tempt one or more people into trying Rneo4j, two posts have appeared:

Demo of Rneo4j Part 1: Building a Database

Covers installation of the necessary R packages and the creation of a Twitter database for tweets containing “neo4j.”

Demo of Rneo4j Part 2: Plotting and Analysis

Uses Cypher results as an R data frame, which opens the data up to the full range of R analysis and display capabilities.

R users will find this a useful introduction to Neo4j and Neo4j users will be introduced to a new level of post-graph creation possibilities.

May 29, 2014

Neo4j 2.1 – Graph ETL for Everyone

Filed under: Graphs,Neo4j — Patrick Durusau @ 6:42 pm

Neo4j 2.1 – Graph ETL for Everyone

From the post:

It’s an exciting time for Neo4j users and, of course, the Neo4j team as we’re releasing the 2.1 version of Neo4j! You’ve probably already seen the amazing strides we’ve taken when releasing our 2.0 version at the start of the year, and Neo4j 2.1 continues to improve the user experience while delivering some impressive under-the-hood improvements, and some interesting work on boosting Cypher too.

Easy import with ETL features directly in Cypher

Graphs are everywhere, but sometimes they’re buried in other systems and legacy databases. You need to extract the data then bring it into Neo4j to experience its true graph form. To help you do this, we’ve brought bulk load functionality directly into Cypher. The new LOAD CSV clause makes that a pleasant and simple task, optimized for graphs around millions scale – the kind of size that folks typically encounter when getting started with Neo4j.

Err, but the line:

You need to extract the data then bring it into Neo4j to experience its true graph form.

isn’t really true is it?

In other words, to process a graph with Neo4j, you have to extract, transform and load the date into Neo4j. Yes?

That is if I could address the data in situ (in its original place) and add the properties I need to process it as a graph, no extraction, transformation and loading are necessary.

Yes?

Not to downplay the usefulness of better importing, if your software requires it, but we do need to be precise about what is being described.

There are other new features and improvements so download a copy of Neo4j 2.1 today!

May 27, 2014

Bigdata and Blueprints

Filed under: bigdata®,Blueprints,Graphs,Gremlin,Rexster,TinkerPop — Patrick Durusau @ 4:04 pm

Bigdata and Blueprints

From the webpage:

Blueprints is an open-source property graph model interface useful for writing applications on top of a graph database. Gremlin is a domain specific language for traversing property graphs that comes with an excellent REPL useful for interacting with a Blueprints database. Rexster exposes a Blueprints database as a web service and comes with a web-based workbench application called DogHouse.

To get started with bigdata via Blueprints, Gremlin, and Rexster, start by getting your bigdata server running per the instructions here.

Then, go and download some sample GraphML data. The Tinkerpop Property Graph is a good starting point.

Just in case you aren’t familiar with bigdata(R):

bigdata(R) is a scale-out storage and computing fabric supporting optional transactions, very high concurrency, and very high aggregate IO rates. The bigdata RDF/graph database can load 1B edges in under one hour on a 15 node cluster. Bigdata operates in both a single machine mode (Journal), highly available replication cluster mode (HAJournalServer), and a horizontally sharded cluster mode (BigdataFederation). The Journal provides fast scalable ACID indexed storage for very large data sets, up to 50 billion edges. The HAJournalServer adds replication, online backup, horizontal scaling of query, and high availability. The federation provides fast scalable shard-wise parallel indexed storage using dynamic sharding and shard-wise ACID updates and incremental cluster size growth. Both platforms support fully concurrent readers with snapshot isolation. (http://sourceforge.net/projects/bigdata/)

So, this is a major event for Blueprints.

I first saw this in a tweet by Marko A. Rodriguez.

May 23, 2014

Neo4j 2.0: Creating adjacency matrices

Filed under: Cypher,Graphs,Neo4j — Patrick Durusau @ 7:11 pm

Neo4j 2.0: Creating adjacency matrices by Mark Needham.

From the post:

About 9 months ago I wrote a blog post showing how to export an adjacency matrix from a Neo4j 1.9 database using the cypher query language and I thought it deserves an update to use 2.0 syntax.

I’ve been spending some of my free time working on an application that runs on top of meetup.com’s API and one of the queries I wanted to write was to find the common members between 2 meetup groups.

The first part of this query is a cartesian product of the groups we want to consider which will give us the combinations of pairs of groups:

I can imagine several interesting uses for the adjacency matrices that Mark describes.

One of which is common membership in groups as the post outlines.

Another would be a common property or sharing a value within a range.

Yes?

May 20, 2014

Community Detection in Graphs — a Casual Tour

Filed under: Graphs,Networks,Social Networks — Patrick Durusau @ 4:43 pm

Community Detection in Graphs — a Casual Tour by Jeremy Kun.

From the post:

Graphs are among the most interesting and useful objects in mathematics. Any situation or idea that can be described by objects with connections is a graph, and one of the most prominent examples of a real-world graph that one can come up with is a social network.

Recall, if you aren’t already familiar with this blog’s gentle introduction to graphs, that a graph G is defined by a set of vertices V, and a set of edges E, each of which connects two vertices. For this post the edges will be undirected, meaning connections between vertices are symmetric.

One of the most common topics to talk about for graphs is the notion of a community. But what does one actually mean by that word? It’s easy to give an informal definition: a subset of vertices C such that there are many more edges between vertices in C than from vertices in C to vertices in V - C (the complement of C). Try to make this notion precise, however, and you open a door to a world of difficult problems and open research questions. Indeed, nobody has yet come to a conclusive and useful definition of what it means to be a community. In this post we’ll see why this is such a hard problem, and we’ll see that it mostly has to do with the word “useful.” In future posts we plan to cover some techniques that have found widespread success in practice, but this post is intended to impress upon the reader how difficult the problem is.

Thinking that for some purposes, communities of nodes could well be a subject in a topic map. But we would have to be able to find them. And Jeremy says that’s a hard problem.

Looking forward to more posts on communities in graphs from Jeremy.

May 8, 2014

Large-Scale Graph Computation on Just a PC

Filed under: GraphChi,Graphs — Patrick Durusau @ 4:38 pm

Large-Scale Graph Computation on Just a PC: Aapo Kyrola Ph.D. thesis defense by Aapo Kyroa.

If you are looking for an overview of Kyroa’s work, this is the resource for you.

Slide 8: “Benefits of single machine systems Assuming it can handle your big problems…”, currently reads:

  1. Programmer productivity – Global state, debuggers…
  2. Inexpensive to install, administer, less power.
  3. Scalability – Use cluster of single-machine systems to solve many tasks in parallel. Idea: Trade latency for throughput < 32K bits/sec 8

I would add:

  1. A single machine forces creation of efficient data structures.

Think of it as using computation resources more effectively as opposed to scaling out to accommodate a problem.

April 22, 2014

Titan 0.4.4 / Faunus 0.4.4

Filed under: Faunus,Graphs,Titan — Patrick Durusau @ 7:04 pm

I saw a tweet earlier today from aurelius that Titan 0.44 and Faunus 0.4.4 are available.

Grab your copy at:

Faunus Downloads

Titan Downloads

Enjoy!

April 21, 2014

Plato, Shiva and A Social Graph

Filed under: Graphs,Gremlin,Titan — Patrick Durusau @ 4:44 pm

The Social Graph of the Los Alamos National Laboratory by Marko A. Rodriguez.

From the post:

The web is composed of numerous web sites tailored to meet the information, consumption, and social needs of its users. Within many of these sites, references are made to the same platonic “thing” though different facets of the thing are expressed. For example, in the movie industry, there is a movie called John Carter by Disney. While the movie is an abstract concept, it has numerous identities on the web (which are technically referenced by a URI).

Aurelius collaborated with the Digital Library Research and Prototyping Group of the Los Alamos National Laboratory (LANL) to develop EgoSystem atop the distributed graph database Titan. The purpose of this system is best described by the introductory paragraph of the April 2014 publication on EgoSystem.

I heavily commend Marko’s post and the Egosystem publication for your reading. That despite my cautions concerning some of the theoretical aspects of the project.

Statements like:

references are made to the same platonic “thing” though different facets of the thing are expressed.

have always troubled me. In part because it involves a claim, usually by the speaker, to have freed themselves from Plato’s cave such that they and they alone can see things aright. Which consigns the rest of us to be the pitiful lot still confined to the cave.

Which of course leads to Marko’s:

There are two categories of vertices in EgoSystem.

  1. Platonic: Denotes an abstract concept devoid of interpretation.
  2. Identity: Denotes a particular interpretation of a platonic.

Every platonic vertex is of a particular type: a person, institution, artifact, or concept. Next, every platonic has one or more identities as referenced by a URL on the web. The platonic types and the location of their web identities are itemized below. As of EgoSystem 1.0, these are the only sources from which data is aggregated, though extending it to support more services (e.g. Facebook, Quorum, etc.) is feasible given the system’s modular architecture.

A structure where English labels, remarkably enough, are places on “Platonic” vertices. Not that we would attribute any identity or semantics to a “Platonic” vertex. 😉

Rather than “Platonic” vertices, they are better described as boundary vertices. That is they circumscribe what can be represented in a particular graph, without making claims on a “higher” reality.

I say that not to be pedantic but to illustrate how a “Platonic” vertex prevents us from meaningful merger with graphs with differing “Platonic” vertices.

No doubt Shiva’s1 other residence, Arzamas-16, could benefit from a similar “alumni” graph but I rather doubt it is going to use English labels for its “Platonic” vertices which:

Denote[…] an abstract concept devoid of interpretation.

If I have no “interpretation,” which I takes to mean no properties (key/value pairs), how will I combine social graphs from Los Alamos and Arzamas-16?

I could cheat and secretly look up properties for the alleged “Platonic” nodes and combine them together but then how would you check my work? The end result would be opaque to anyone other than myself.

That isn’t a criticism of using the EgoSystem. I am sure it meets the needs of Los Alamos quite nicely.

However, it can prevent us from capturing the information necessary to expand the boundary of our graph at some future date or merging it with other graphs.

From a philosophical standpoint, we should not claim access to Platonic ideals when we are actually recording our views of shadows on the cave wall. Of which, intersections between graphs/shadows are just a subset.

1. Those of you old enough to remember Robert Oppenheimer will recognize the reference.
« Newer PostsOlder Posts »

Powered by WordPress