Another Word For It Patrick Durusau on Topic Maps and Semantic Diversity

January 5, 2015

Don’t make the Demo look Done

Filed under: Graphics,Marketing,Visualization — Patrick Durusau @ 5:11 pm

Don’t make the Demo look Done by Kathy Sierra.

From the post:

demo-not-done

When we show a work-in-progress (like an alpha release) to the public, press, a client, or boss… we’re setting their expectations. And we can do it one of three ways: dazzle them with a polished mock-up, show them something that matches the reality of the project status, or stress them out by showing almost nothing and asking them to take it “on faith” that you’re on track.

The bottom line:

How ‘done’ something looks should match how ‘done’ something is.

Not recent but very sound advice!

The only thing I would add is: Don’t BS your testers about how the demo is going to improve before going live before the customer. Not going to happen.

December 23, 2014

5 Ways to Find Trending Topics (Other than Twitter)

Filed under: Marketing,Topic Maps — Patrick Durusau @ 3:52 pm

5 Ways to Find Trending Topics (Other than Twitter) by Elisabeth Michaud.

From the post:

Like every community or social media manager, one type of social media content you’re likely to share is posts that play on what’s happening in the world– the trends of the day, week, or month. To find content for these posts, many of you are probably turning to Twitter’s Trending Topics–that friendly little section on the left-hand side of your browser when you visit Twitter.com, and something that can be personalized (or not) to what Twitter thinks you’ll be most interested in.

We admit that Trending Topics are pretty handy when it comes to inspiring content, but it’s also the same place EVERY. OTHER. BRAND (and probably your competitors) is looking for content ideas. Boring! Today, we’ve got 5 other places you can look for trending stories to inspire you.

Not recent but I think Elisabeth’s tips bear repeating. At least if you are interested in creating popular topic maps. That is topic maps that maybe of interest to someone other than yourself. 😉

I still aspire to create a topic map of the Chicago Assyrian Dictionary by using Tesseract to extract the text from image based PDF, etc. but the only buyers for that item would be me and the folks at the Oriental Archives at the University of Chicago. Maybe a few others but not something you want to bet the rent on.

Beyond Elisabeth’s suggestions, which are all social media, I would suggest you also monitor:

CNN

Guardian (UK edition)

New York Times

Spiegel Online International

The Wall Street Journal

To see if you can pick up trends in stories there as well.

The biggest problem with news channels being that stories blow hot and cold and it isn’t possible to know ahead of time which ones will last (like the Michael Brown shooting) and which ones are doing to be dropped like a hot potato (CIA torture report).

One suggestion would be to create a TWitter account to follow some representative sample of main news outlets and keep a word count, excluding noise words, on a weekly and monthly basis. Anything that spans more than a week, is likely to be a persistent topic of interest. At least to someone.

And when something flares up in social media, you can track it there as well. Like #gamergate. Where are you going to find a curated archive of all the tweets and other social media messages on that topic? Where you can track the principals, aggregate content, etc.? You could search for that now but I suspect some of it is already missing or edited.

The ultimate question is not whether topic maps as a technology are popular but rather do topic maps deliver a value-add for information that is of interest to others?

Is that a Golden Rule (A rule that will make you some gold.)?

Provide unto others the information they want

PS: Don’t confuse “provide” with “give.” The economic model for “providing” is your choice.

December 21, 2014

How Whitepages turned the phone book into a graph

Filed under: Graphs,Marketing — Patrick Durusau @ 4:37 pm

How Whitepages turned the phone book into a graph by Jean Villedieu.

From the post:

If you were born in the 1990’s or earlier, you are familiar with phone books. These books listed the phone numbers of the people living in a given area. When you wanted to contact someone you knew the name of, the phone book could help you find his number. Before people switched phones regularly and stopped caring about having a landline, this was important.

The “born in” line really hurt. 😉

This is a feel good story about graphs and an obvious use case. However, remember the average age of leadership training is forty-two (42) which puts them in the 1970’s. If you want to sell them on graphs, the phone book might not be a bad place to start.

Just saying.

I first saw this in a tweet by Gary Stewart.

December 8, 2014

Apologies for Monday, December 8, 2014

Filed under: Marketing — Patrick Durusau @ 9:04 pm

Greetings!

My sincere apologies for not posting useful content to the blog today. I got caught up in mining a 4K+ court transcript (wonder who what would be about?) and simply ran out of viable thinking time.

I did not want to insult you by simply throwing something up that I haven’t read, viewed or devoted some time to thinking about.

Tomorrow I have some posts warming up on CRDTs and other interesting topics.

I am also running days behind on my Twitter stream and have yet to see a Twitter client that is useful in that situation. Lots of Twitter client perform searches but how do I search for a post that I do not know appeared? On a subject that, as far as I know, hasn’t been named. Yes?

Search is ok, I use it all the time. But it is best when you don’t care about the quality of the results and/or you have a lot of time to refine the results.

Although I do have to admit one major search engine has stopped suggesting advertising when I search for things like cuneiform. 😉

Hope your week is off to a great start and I look forward to posting material that may interest you tomorrow!

December 5, 2014

How to Give a Stellar Presentation

Filed under: Marketing — Patrick Durusau @ 8:20 pm

How to Give a Stellar Presentation by Rebecca Knight.

From the post:

Speaking in front of a group — no matter how big or small — can be stressful. Preparation is key, of course, whether it’s your first or your hundredth time. From preparing your slides to wrapping up your talk, what should you do to give a presentation that people will remember?

What the Experts Say

Public speaking often tops the list of people’s fears. “When all eyes are on you, you feel exposed,” says Nick Morgan, the president and founder of Public Words and the author of Power Cues. “This classically leads to feelings of shame and embarrassment.” In other words: fear of humiliation is at the root of our performance anxiety. Another problem “is that speakers often set a standard of perfection for themselves that they will never live up to,” Morgan says. “And then depending on how neurotic they are, they’ll spend the next few hours, weeks, or years thinking: ‘I should have said this,’ or ‘I should have done that.’” But presenters shouldn’t “fear a hostile environment” or second-guess themselves says Nancy Duarte, the CEO and principal of Duarte Design, and the author of the HBR Guide to Persuasive Presentations. “Most often the audience is rooting for you,” she explains. They “want to hear what you have to say” and they want you to be successful. Here are some tips that will help you deliver.

More good advice on how to give a great presentation.

I often wonder what the ratio of material on giving good presentations is to actually bad presentations? My gut feeling is that the former outnumbers the latter, by one or more orders of magnitude.

We can all give better presentations but we don’t see ourselves presenting do we?

The best suggestion in this post is to film yourself. It can be YouTube quality filming for that matter.

Being a better presenter isn’t a guarantee of success but it is another factor in your favor!

I first saw this in a tweet by Doug Mahugh.

December 2, 2014

Promoting Topic Maps (and writing)

Filed under: Marketing,Topic Maps — Patrick Durusau @ 4:11 pm

Ted Underwood posted a tweet today that seems relevant to marketing topic maps:

When Sumeria got psyched about writing, I bet they spent the first two decades mostly traveling around giving talks about writing.

I think Ted has a very good point.

You?

November 30, 2014

What is Walmart Doing Right and Topic Maps Doing Wrong?

Filed under: Advertising,Marketing,Topic Maps — Patrick Durusau @ 12:59 pm

Sentences to ponder by Chris Blattman.

From the post:

Walmart reported brisk traffic overnight. The retailer, based in Bentonville, Ark., said that 22 million shoppers streamed through stores across the country on Thanksgiving Day. That is more than the number of people who visit Disney’s Magic Kingdom in an entire year.

A blog at the Wall Street Journal suggests the numbers are even better than those reported by Chris:

Wal-Mart said it had more than 22 million customers at its stores between 6 p.m. and 10 p.m. Thursday, similar to its numbers a year ago.

In four (4) hours WalMart has more customers than visit Disney’s Magic Kingdom in a year.

Granting as of October 31, 2014, WalMart has forty-nine hundred and eighty-seven (4987) locations in the United States, that remains an impressive number.

Suffice it to say the number of people actively using topic maps is substantially less than the Thankgiving customer numbers for Walmart.

I don’t have the answer to the title question.

Asking you to ponder it as you do holiday shopping.

What is different about your experience in online or offline shopping that makes it different from your experience with topic maps? Or pre- or post-shopping experience that is different?

I will take this question up again after the first of 2015 so be working on your thoughts and suggestions over the holiday season.

Thanks!

November 27, 2014

Advertising 101 – Spyware

Filed under: Marketing — Patrick Durusau @ 10:29 am

Lisa Vaas has some basic advertising advice for spyware manufacturers/vendors:

To adhere to the legal side of the line, monitoring apps have to be marketed at employers who want to keep an eye on their workers, or guardians who want to watch over their kids.

From: Spyware app StealthGenie’s CEO fined $500K, forfeits source code

$500K is a pretty good pop at the start of the holiday season.

For further background on the story, see Lisa’s other story on this: Head of ‘StealthGenie’ mobile stalking app indicted for selling spyware and the Federal proceedings proper.

Be careful how you advertise!

November 22, 2014

The structural virality of online diffusion

Filed under: Advertising,Marketing,Modeling — Patrick Durusau @ 4:34 pm

The structural virality of online di ffusion by Sharad Goel, Ashton Anderson, Jake Hofman, and Duncan J. Watts.

Viral products and ideas are intuitively understood to grow through a person-to-person di ffusion process analogous to the spread of an infectious disease; however, until recently it has been prohibitively difficult to directly observe purportedly viral events, and thus to rigorously quantify or characterize their structural properties. Here we propose a formal measure of what we label “structural virality” that interpolates between two conceptual extremes: content that gains its popularity through a single, large broadcast, and that which grows through multiple generations with any one individual directly responsible for only a fraction of the total adoption. We use this notion of structural virality to analyze a unique dataset of a billion di ffusion events on Twitter, including the propagation of news stories, videos, images, and petitions. We find that across all domains and all sizes of events, online di ffusion is characterized by surprising structural diversity. Popular events, that is, regularly grow via both broadcast and viral mechanisms, as well as essentially all conceivable combinations of the two. Correspondingly, we find that the correlation between the size of an event and its structural virality is surprisingly low, meaning that knowing how popular a piece of content is tells one little about how it spread. Finally, we attempt to replicate these fi ndings with a model of contagion characterized by a low infection rate spreading on a scale-free network. We fi nd that while several of our empirical fi ndings are consistent with such a model, it does not replicate the observed diversity of structural virality.

Before you get too excited, the authors do not provide a how-to-go-viral manual.

In part because:

Large and potentially viral cascades are therefore necessarily very rare events; hence one must observe a correspondingly large number of events in order to fi nd just one popular example, and many times that number to observe many such events. As we will describe later, in fact, even moderately popular events occur in our data at a rate of only about one in a thousand, while “viral hits” appear at a rate closer to one in a million. Consequently, in order to obtain a representative sample of a few hundred viral hits arguably just large enough to estimate statistical patterns reliably one requires an initial sample on the order of a billion events, an extraordinary data requirement that is difficult to satisfy even with contemporary data sources.

The authors clearly advance the state of research on “viral hits” and conclude with suggestions for future modeling work.

You can imagine the reaction of marketing departments should anyone get closer to designing successful viral advertising.

A good illustration that something we can observe, “viral hits,” in an environment where the spread can be tracked (Twitter), can still resist our best efforts to model and/or explain how to repeat the “viral hit” on command.

A good story to remember when a client claims that some action is transparent. It may well be, but that doesn’t mean there are enough instances to draw any useful conclusions.

I first saw this in a tweet by Steven Strogatz.

October 26, 2014

The Chapman University Survey on American Fears

Filed under: Marketing — Patrick Durusau @ 9:04 am

The Chapman University Survey on American Fears

From the webpage:

Chapman University has initiated a nationwide poll on what strikes fear in Americans. The Chapman University Survey on American Fears included 1,500 participants from across the nation and all walks of life. The research team leading this effort pared the information down into four basic categories: personal fears, crime, natural disasters and fear factors. According to the Chapman poll, the number one fear in America today is walking alone at night.

A multi-disciplinary team of Chapman faculty and students wanted to capture this information on a year-over-year basis to draw comparisons regarding what items are increasing in fear as well as decreasing. The fears are presented according to fears vs. concerns because that was the necessary phrasing to capture the information correctly.

Your marketing department will find this of interest.

If you are not talking about power, fear or sex, then you aren’t talking about marketing.

IT is no different from any other product or service. Perhaps that’s why the kumbaya approach to selling semantic solutions has done so poorly.

You will need far deeper research than this to integrate fear into your marketing program but at least it is a starting point for discussion.

I first saw this at Full Text Reports as: The Chapman Survey on American Fears

October 20, 2014

Can We Talk? Finding A Common Security Language

Filed under: Cybersecurity,Marketing,Security — Patrick Durusau @ 3:57 pm

Can We Talk? Finding A Common Security Language by Jason Polancich.

From the post:


Today’s enterprises, and their CEOs and board members, are increasingly impacted by everyday cybercrime. However, despite swelling budgets and ever-expanding resource allocations, many enterprises are actually losing ground in the fight to protect vital business operations from cyberharm.

While there are many reasons for this, none is as puzzling as the inability of executives and other senior management to communicate with their own security professionals. One major reason for this dysfunction hides in plain sight: There is no mutually understood, shared, and high-level language between the two sides via which both can really connect, perform critical analysis, make efficient and faster decisions, develop strategies, and, ultimately, work with less friction.

In short, it’s as if there’s a conversation going on where one side is speaking French, one side Russian, and they’re working through an English translator who’s using pocket travel guides for both languages.

In other business domains, such as sales or financial performance, there are time-tested and well-understood standards for expressing concepts and data — in words. For example, things like “Run Rate” or “Debt-to-Equity Ratio” allow those people pulling the levers and pushing the buttons in an organization’s financial operations to percolate up important reporting for business leaders to use when steering the enterprise ship.

This is all made possible by a shared language of terms and classifications.

For the area of business where cyber security and business overlap, there’s no common, intuitive, business intelligence or key performance indicator (KPI) language that security professionals and business leaders share to communicate effectively. No common or generally accepted business terms and metric specifications in place to routinely track, analyze, and express how cybercrime affects a business. And, for the leaders and security professionals alike, this gap affects both sides equally.

I think John’s summary is one that you could pitch in an elevator to almost any CEO:

In short, it’s as if there’s a conversation going on where one side is speaking French, one side Russian, and they’re working through an English translator who’s using pocket travel guides for both languages. (emphasis added)

John has some concrete suggestions for enterprises to start towards overcoming this language barrier. See his post for the details.

I would like to take his suggestions a step further, since the language of security is constantly changing, and suggest you make your solution maintainable by not simply cataloging terms and where they fit into your business model, but capture how you identified those terms.

I don’t think the term firewall is going to lose its currency any time soon but exactly what do you mean by firewall and more importantly, where are they? Configured by who? And with what rules? That just a trivial example and you can supply many more.

Take John’s advice and work to overcome the language barrier between the security and business camps in your enterprise. The bonus to using a topic map is that it can be maintained over time, just as your security should be.

October 7, 2014

History of Apache Storm and lessons learned

Filed under: Marketing,Storm — Patrick Durusau @ 7:00 pm

History of Apache Storm and lessons learned by Nathan Marz.

From the post:

Apache Storm recently became a top-level project, marking a huge milestone for the project and for me personally. It’s crazy to think that four years ago Storm was nothing more than an idea in my head, and now it’s a thriving project with a large community used by a ton of companies. In this post I want to look back at how Storm got to this point and the lessons I learned along the way.

Storm

The topics I will cover through Storm’s history naturally follow whatever key challenges I had to deal with at those points in time. The first 25% of this post is about how Storm was conceived and initially created, so the main topics covered there are the technical issues I had to figure out to enable the project to exist. The rest of the post is about releasing Storm and establishing it as a widely used project with active user and developer communities. The main topics discussed there are marketing, communication, and community development.

Any successful project requires two things:

  1. It solves a useful problem
  2. You are able to convince a significant number of people that your project is the best solution to their problem

What I think many developers fail to understand is that achieving that second condition is as hard and as interesting as building the project itself. I hope this becomes apparent as you read through Storm’s history.

Every project/case is somewhat different but this history of Storm is a relevant and great read!

I would highlight: It solves a useful problem.

I don’t read that to say:

  • It solves a problem I want to solve
  • It solves a problem you didn’t know you had
  • It solves a problem I care about
  • etc.

To be a “useful” problem, some significant segment of users must recognize it as a problem. If they don’t see it as a problem, then it doesn’t need a solution.

October 5, 2014

Nobody Cares About Your “Billion Dollar Idea”

Filed under: Marketing — Patrick Durusau @ 10:19 am

Nobody Cares About Your “Billion Dollar Idea” by Gary Vaynerchuk.

From the post:

I have UNLIMITED ideas. If you have the idea that’s nice, but if you don’t have the dollars or the inventory, well then, you have nothing. So, the only way you can do something about that is to go ahead and get dollars from somebody.

An echo of Jack Park’s “Just f*cking do it!,” albeit in a larger forum.

What are you doing this week to turn your idea into a tangible reality?

October 4, 2014

Why Academics Stink at Writing [Programmers Too]

Filed under: Marketing,Writing — Patrick Durusau @ 7:45 pm

Why Academics Stink at Writing by Steven Pinker.

From the post:

Together with wearing earth tones, driving Priuses, and having a foreign policy, the most conspicuous trait of the American professoriate may be the prose style called academese. An editorial cartoon by Tom Toles shows a bearded academic at his desk offering the following explanation of why SAT verbal scores are at an all-time low: “Incomplete implementation of strategized programmatics designated to maximize acquisition of awareness and utilization of communications skills pursuant to standardized review and assessment of languaginal development.” In a similar vein, Bill Watterson has the 6-year-old Calvin titling his homework assignment “The Dynamics of Inter­being and Monological Imperatives in Dick and Jane: A Study in Psychic Transrelational Gender Modes,” and exclaiming to Hobbes, his tiger companion, “Academia, here I come!”

Steven’s analysis applies mostly to academic writing styles, although I have suffered through more than one tome in CS that apologies for some topic X being in another chapter. Enough already, just get on with it. Needed a severe editing which would have left it shorter and an easier read.

Worth the read if you try to identify issues in your own writing style. Identifying errors in the writing style of others won’t improve your writing.

I first saw this in a twee by Steven Strogatz

PS: Being able to communicate effectively with others is essential to marketing yourself or products/services.

September 29, 2014

Peaxy Hyperfiler Redefines Data Management to Deliver on the Promise of Advanced Analytics

Filed under: Marketing,Topic Maps — Patrick Durusau @ 4:22 pm

Peaxy Hyperfiler Redefines Data Management to Deliver on the Promise of Advanced Analytics

From the post:

Peaxy, Inc. (www.peaxy.net) today announced general availability of the Peaxy Hyperfiler, its hyperscale data management system that enables enterprises to access and manage massive amounts of unstructured data without disrupting business operations. For engineers and researchers who must search for datasets across multiple geographies, platforms and drives, accessing all the data necessary to inform the product lifecycle, from design to predictive maintenance, presents a major challenge. By making all data, regardless of quantity or location, immediately accessible via a consistent data path, companies will be able to dramatically accelerate their highly technical, data-intensive initiatives. These organizations will be able to manage data in a way that allows them to employ advanced analytics that have been promised for years but never truly realized.

…Key product features include:

  • Scalability to tens of thousands of nodes enabling the creation of an exabyte-scale data infrastructure in which performance scales in parallel with capacity
  • Fully distributed namespace and data space that eliminate data silos to make all data easily accessible and manageable
  • Simple, intuitive user interface built for engineers and researchers as well as for IT
  • Data tiered in storage classes based on performance, capacity and replication factor
  • Automated, policy-based data migration
  • Flexible, customizable data management
  • Remote, asynchronous replication to facilitate disaster recovery
  • Call home remote monitoring
  • Software-based, hardware-agnostic architecture that eliminates proprietary lock-in
  • Addition or replacement of hardware resources with no down time
  • A version of the Hyperfiler that has been successfully beta tested on Amazon Web Services (AWS)

I would not say that the “how it works” page is opaque but it does remind me of the Grinch telling Cindy Lou that he was taking their Christmas tree to be repaired. Possible but lacking in detail.

What do you think?

hyperfilter

Do you see:

  1. Any mention of mapping multiple sources of data into a consolidated view?
  2. Any mention of managing changing terminology over a product history?
  3. Any mention of indexing heterogeneous data?
  4. Any mention of natural language processing unstructured data?
  5. Any mention of machine learning over unstructured data?
  6. Anything beyond am implied “a miracle” occurs between data and Hyperfiler?

The documentation promises “data filters” but is also short on specifics.

A safe bet that mapping of terminology and semantics, for an enterprise and/or long product history, remains fertile ground for topic maps.

I first saw this in a tweet by Gregory Piatetsky

PS: Answers to the questions I raise may exist somewhere but I warrant they weren’t posted on September 29, 2014 at the locations listed in this post.

September 21, 2014

Fixing Pentagon Intelligence [‘data glut but an information deficit’]

Filed under: Intelligence,Marketing,Topic Maps — Patrick Durusau @ 4:24 pm

Fixing Pentagon Intelligence by John R. Schindler.

From the post:

The U.S. Intelligence Community (IC), that vast agglomeration of seventeen different hush-hush agencies, is an espionage behemoth without peer anywhere on earth in terms of budget and capabilities. Fully eight of those spy agencies, plus the lion’s share of the IC’s budget, belong to the Department of Defense (DoD), making the Pentagon’s intelligence arm something special. It includes the intelligence agencies of all the armed services, but the jewel in the crown is the National Security Agency (NSA), America’s “big ears,” with the National Geospatial-Intelligence Agency (NGA), which produces amazing imagery, following close behind.

None can question the technical capabilities of DoD intelligence, but do the Pentagon’s spies actually know what they are talking about? This is an important, and too infrequently asked, question. Yet it was more or less asked this week, in a public forum, by a top military intelligence leader. The venue was an annual Washington, DC, intelligence conference that hosts IC higher-ups while defense contractors attempt a feeding frenzy, and the speaker was Rear Admiral Paul Becker, who serves as the Director of Intelligence (J2) on the Joint Chiefs of Staff (JCS). A career Navy intelligence officer, Becker’s job is keeping the Pentagon’s military bosses in the know on hot-button issues: it’s a firehose-drinking position, made bureaucratically complicated because JCS intelligence support comes from the Defense Intelligence Agency (DIA), which is an all-source shop that has never been a top-tier IC agency, and which happens to have some serious leadership churn at present.

Admiral Becker’s comments on the state of DoD intelligence, which were rather direct, merit attention. Not surprisingly for a Navy guy, he focused on China. He correctly noted that we have no trouble collecting the “dots” of (alleged) 9/11 infamy, but can the Pentagon’s big battalions of intel folks actually derive the necessary knowledge from all those tasty SIGINT, HUMINT, and IMINT morsels? Becker observed — accurately — that DoD intelligence possesses a “data glut but an information deficit” about China, adding that “We need to understand their strategy better.” In addition, he rued the absence of top-notch intelligence analysts of the sort the IC used to possess, asking pointedly: “Where are those people for China? We need them.”

Admiral Becker’s:

data glut but an information deficit” (emphasis added)

captures the essence of phone record subpoenas, mass collection of emails, etc., all designed to give the impression of frenzied activity, with no proof of effectiveness. That is an “information deficit.”

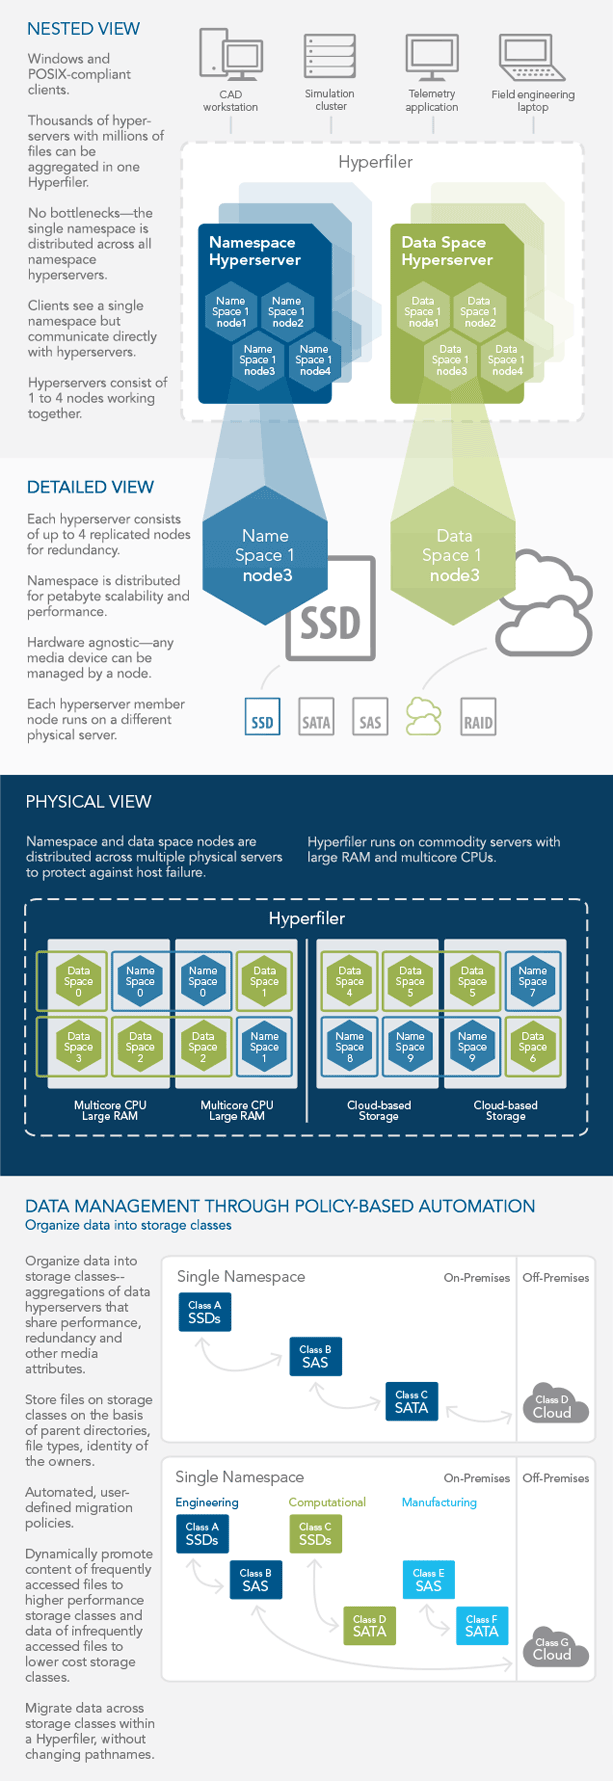
Be reassured you can host a data glut in a topic map so topic maps per se are not a threat to current data gluts. It is possible, however, to use topic maps over existing data gluts to create information and actionable intelligence. Without disturbing the underlying data gluts and their contractors.

I tried to find a video of Adm. Becker’s presentation but apparently the Intelligence and National Security Security Summit 2014 does not provide video recording of presentations. Whether that is to prevent any contemporaneous record being kept of remarks or just being low-tech kinda folks isn’t clear.

I can point out the meeting did have a known liar, “The Honorable James Clapper,” on the agenda. Hard to know if having perjured himself in front of Congress has made him gun shy of recorded speeches or not. (For Clapper’s latest “spin,” on “the least untruthful,” see: James Clapper says he misspoke, didn’t lie about NSA surveillance.) One hopes by next year’s conference Clapper will appear as: James Clapper, former DNI, convicted felon, Federal Prison Register #….

If you are interested in intelligence issues, you should be following John R. Schindler. A U.S. perspective but handling issues in intelligence with topic maps will vary in the details but not the underlying principles from one intelligence service to another.

Disclosure: I rag on the intelligence services of the United States due to greater access to public information on those services. Don’t take that as greater interest how their operations could be improved by topic maps over other intelligence services.

I am happy to discuss how your intelligence services can (or can’t) be improved by topic maps. There are problems, such as those discussed by Admiral Becker, that can’t be fixed by using topic maps. I will be as quick to point those out as I will problems where topic maps are relevant. My goal is your satisfaction that topic maps made a difference for you, not having a government entity in a billing database.

September 17, 2014

Convince your boss to use Clojure

Filed under: Clojure,Functional Programming,Marketing — Patrick Durusau @ 7:18 pm

Convince your boss to use Clojure by Eric Normand.

From the post:

Do you want to get paid to write Clojure? Let’s face it. Clojure is fun, productive, and more concise than many languages. And probably more concise than the one you’re using at work, especially if you are working in a large company. You might code on Clojure at home. Or maybe you want to get started in Clojure but don’t have time if it’s not for work.

One way to get paid for doing Clojure is to introduce Clojure into your current job. I’ve compiled a bunch of resources for getting Clojure into your company.

Take these resources and do your homework. Bringing a new language into an existing company is not easy. I’ve summarized some of the points that stood out to me, but the resources are excellent so please have a look yourself.

Great strategy and list of resources for Clojure folks.

How would you adapt this strategy to topic maps and what resources are we missing?

I first saw this in a tweet by Christophe Lalanne.

August 25, 2014

Information Aversion

Filed under: Marketing,Users — Patrick Durusau @ 4:06 pm

Information Aversion by John Baez.

ostrich

Why do ostriches stick their heads under the sand when they’re scared?

They don’t. So why do people say they do? A Roman named Pliny the Elder might be partially to blame. He wrote that ostriches “imagine, when they have thrust their head and neck into a bush, that the whole of their body is concealed.”

That would be silly—birds aren’t that dumb. But people will actually pay to avoid learning unpleasant facts. It seems irrational to avoid information that could be useful. But people do it. It’s called information aversion.

John reports on an interesting experiment where people really did pay to avoid learning information (about themselves).

Do you think this extends to learning unpleasant information about their present IT software or practices?

August 18, 2014

Topic Maps Are For Data Janitors

Filed under: Marketing,Topic Maps — Patrick Durusau @ 8:20 am

For Big-Data Scientists, ‘Janitor Work’ Is Key Hurdle to Insights by Steve Lohr.

From the post:

Yet far too much handcrafted work — what data scientists call “data wrangling,” “data munging” and “data janitor work” — is still required. Data scientists, according to interviews and expert estimates, spend from 50 percent to 80 percent of their time mired in this more mundane labor of collecting and preparing unruly digital data, before it can be explored for useful nuggets.

“Data wrangling is a huge — and surprisingly so — part of the job,” said Monica Rogati, vice president for data science at Jawbone, whose sensor-filled wristband and software track activity, sleep and food consumption, and suggest dietary and health tips based on the numbers. “It’s something that is not appreciated by data civilians. At times, it feels like everything we do.”

“It’s an absolute myth that you can send an algorithm over raw data and have insights pop up,” said Jeffrey Heer, a professor of computer science at the University of Washington and a co-founder of Trifacta, a start-up based in San Francisco.

Data formats are one challenge, but so is the ambiguity of human language. Iodine, a new health start-up, gives consumers information on drug side effects and interactions. Its lists, graphics and text descriptions are the result of combining the data from clinical research, government reports and online surveys of people’s experience with specific drugs.

But the Food and Drug Administration, National Institutes of Health and pharmaceutical companies often apply slightly different terms to describe the same side effect. For example, “drowsiness,” “somnolence” and “sleepiness” are all used. A human would know they mean the same thing, but a software algorithm has to be programmed to make that interpretation. That kind of painstaking work must be repeated, time and again, on data projects.

Plenty of progress is still to be made in easing the analysis of data. “We really need better tools so we can spend less time on data wrangling and get to the sexy stuff,” said Michael Cavaretta, a data scientist at Ford Motor, which has used big data analysis to trim inventory levels and guide changes in car design.

Mr. Cavaretta is familiar with the work of ClearStory, Trifacta, Paxata and other start-ups in the field. “I’d encourage these start-ups to keep at it,” he said. “It’s a good problem, and a big one.”

Topic maps were only fifteen (15) years ahead of the need of Big Data for them.

How do you avoid:

That kind of painstaking work must be repeated, time and again, on data projects.

?

By annotating data once using a topic map and re-using that annotation over and over again.

By creating already annotated data using a topic map and reusing that annotation over and over again.

Recalling that topic map annotations can represent “logic” but more importantly, can represent any human insight that can be expressed about data.

See Lohr’s post for startups and others who are talking about a problem the topic maps community solved fifteen years ago.

August 2, 2014

User Interfaces

Filed under: Interface Research/Design,Marketing,UX — Patrick Durusau @ 4:20 pm

user interface

My future response to all interface statements that begin:

  • users must understand
  • users don’t know what they are missing
  • users have been seduced by search
  • users need training
  • etc.

These statements and others mean that “users,” those folks who are going to pay money for services/products, aren’t going to be happy.

Making a potential customer unhappy is a very poor sales technique.

I saw this in a tweet by Startup Vitamins.

July 30, 2014

Semantic Investment Needs A Balance Sheet Line Item

Filed under: Marketing,Semantics — Patrick Durusau @ 6:19 pm

The Hidden Shareholder Boost From Information Assets by Douglas Laney.

From the post:

It’s hard today not to see the tangible, economic benefits of information all around us: Walmart uses social media trend data to entice online shoppers to purchase 10 percent to 15 percent more stuff; Kraft spinoff Mondelez grew revenue by $100 million through improved in-store promotion configurations using detailed store, chain, product, stock and pricing data; and UPS saves more than $50 million, delivers 35 percent more packages per year and has doubled driver wages by continually collecting and analyzing more than 200 data points per truck along with GPS data to reduce accidents and miles driven.

Even businesses from small city zoos to mom-and-pop coffee shops to wineries are collecting, crushing and consuming data to yield palpable revenue gains or expense reductions. In addition, some businesses beyond the traditional crop of data brokers monetize their information assets directly by selling or trading them for goods or services.

Yet while as a physical asset, technology is easily given a value attribution and represented on balance sheets; information is treated as an asset also ran or byproduct of the IT department. Your company likely accounts for and manages your office furniture with greater discipline than your information assets. Why? Because accounting standards in place since the beginning of the information age more than 50 years ago continue to be based on 250-year-old Industrial Age realities. (emphasis in original)

Does your accounting system account for your investment in semantics?

Here’s some ways to find out:

  • For any ETL project in the last year, can your accounting department detail how much was spent discovering the semantics of the ETL data?
  • For any data re-used for an ETL project in the last three years, can your accounting department detail how much was spent duplicating the work of the prior ETL?
  • Can your accounting department produce a balance sheet showing your current investment in the semantics of your data?
  • Can your accounting department produce a balance sheet showing the current value of your information?

If the answer is “no,” to any of those questions, is your accounting department meeting your needs in the information age?

Douglas has several tips for getting people’s attention for the $$$ you have invested in information.

Is information an investment or an unknown loss on your books?

June 9, 2014

On Lowered Expectations:…

Filed under: Database,Marketing,NoSQL — Patrick Durusau @ 3:57 pm

On Lowered Expectations: Transactions, Scaling, and Honesty by Jennifer Rullmann.

Jennifer reviews Ted Dunning’s list of what developers should demand from database vendors and then adds one more:

But I think the most important thing that developers need from database vendors is missing: honesty. I spent 30 minutes yesterday on a competitor’s website just trying to figure out if they really do ACID, and after four months in the industry, I know quite a bit more about what to look for than most application developers. It’s ridiculous how hard it is to figure out even the most basic things about the vast majority of databases on the market. I feel really strongly about this, so I’ll say it again:

The number one thing we need from database vendors is honesty.

(emphasis in original)

I am sure there are vendors who invent definitions of “hyperedge” and claim to support Unicode when they really support “tick-Unicode,” that is a Unicode character preceded by a “`.”

Beyond basic honesty, I read Jennifer’s complaint as being about the lack of good documentation for database offerings. A lack that is well known.

I doubt developers are suddenly going to start writing high quality documentation for their software. Or at least after decades of not doing so, it seems unlikely.

But that doesn’t mean we are doomed to bad documentation. What if a database vendor decided to document databases comparable to their own? Not complete, not a developer’s guide but ferreting out and documenting basic information comparable databases.

Like support for ACID.

Would take time to develop the data and credibility, but in the long run, whose product would you trust more?

A vendor whose database capabilities are hidden behind smoke and mirrors or a vendor who is honest about themselves and others?

May 27, 2014

Crossing the Chasm…

Filed under: Marketing,Semantic Web — Patrick Durusau @ 4:35 pm

Crossing the Chasm with Semantic Technology by Marin Dimitrov.

From the description:

After more than a decade of active efforts towards establishing Semantic Web, Linked Data and related standards, the verdict of whether the technology has delivered its promise and has proven itself in the enterprise is still unclear, despite the numerous existing success stories.

Every emerging technology and disruptive innovation has to overcome the challenge of “crossing the chasm” between the early adopters, who are just eager to experiment with the technology potential, and the majority of the companies, who need a proven technology that can be reliably used in mission critical scenarios and deliver quantifiable cost savings.

Succeeding with a Semantic Technology product in the enterprise is a challenging task involving both top quality research and software development practices, but most often the technology adoption challenges are not about the quality of the R&D but about successful business model generation and understanding the complexities and challenges of the technology adoption lifecycle by the enterprise.

This talk will discuss topics related to the challenge of “crossing the chasm” for a Semantic Technology product and provide examples from Ontotext’s experience of successfully delivering Semantic Technology solutions to enterprises.

I differ from Dimitrov’s on some of the details but a solid +1! for slides 29 and 30.

I think you will recognize immediate similarity, at least on slide 29, to some of the promotions for topic maps.

Of course, the next question is how to get to slide 30 isn’t it?

May 13, 2014

The Shrinking Big Data MarketPlace

Filed under: BigData,Marketing,VoltDB — Patrick Durusau @ 3:33 pm

VoltDB Survey Finds That Big Data Goes to Waste at Most Organizations

From the post:

VoltDB today announced the findings of an industry survey which reveals that most organizations cannot utilize the vast majority of the Big Data they collect. The study exposes a major Big Data divide: the ability to successfully capture and store huge amounts of data is not translating to improved bottom-line business benefits.

Untapped Data Has Little or No Value

The majority of respondents reveal that their organizations can’t utilize most of their Big Data, despite the fact that doing so would drive real bottom line business benefits.

  • 72 percent of respondents cannot access and/or utilize the majority of the data coming into their organizations.
  • Respondents acknowledge that if they were able to better leverage Big Data their organizations could: deliver a more personalized customer experience (49%); increase revenue growth (48%); and create competitive advantages (47%).

(emphasis added)

News like that makes me wonder how long the market for “big data tools” that can’t produce ROI is going to continue?

I suspect VoltDB has its eyes on addressing the software aspects of the non-utilization problem (more power to them) but that still leaves the usual office politics of who has access to what data and the underlying issues of effectively sharing data across inconsistent semantics.

Topic maps can’t help you address the office politics problem, unless you want to create a map of who is in the way of effective data sharing. Having created such a map, how you resolve personnel issues is your problem.

Topic maps can help with the inconsistent semantics that are going to persist even in the best of organizations. Departments have inconsistent semantics in many cases because their semantics or “silo” if you like, works best for their workflow.

Why not allow the semantics/silo stay in place and map it into other semantics/silos as need be? That way every department gets their familiar semantics and you get the benefit of better workflow.

To put it another way, silos aren’t the problem, it is the opacity of silos that is the problem. Make silos transparent and you have better data interchange and as a consequence, greater access to the data you are collecting.

Improve your information infrastructure on top of improved mapping/access to data and you will start to improve your bottom line. Someday you will get to “big data.” But as the survey says: Using big data tools != improved bottom line.

May 7, 2014

Go ahead, compete with Google Search

Filed under: Marketing,Search Engines — Patrick Durusau @ 3:53 pm

Go ahead, compete with Google Search: Why its is not that crazy to go build a search engine. by Alexis Smirnov.

Alexis doesn’t sound very promising at the start:

Google’s mission is to organize the world’s information and make it universally accessible and useful. Google Search has become a shining example of progress towards accomplishing this mission.

Google Search is the best general-purpose search engine and it gets better all the time. Over the years it killed off most of it’s competitors.

But after a very interesting and useful review of non-general public search engines, he concludes:

To sum up, the best way to compete against Google is not to build another general-purpose search engine. It is to build another vertical semantic search engine. The better engines understand the specific domain, the better chance they have to be better than Google.

See the post for the details and get thee to the software forge to build a specialized search engine!

PS: We all realize the artwork that accompanies the post isn’t an accurate depiction of Google. Too good looking. 😉

PPS: I am particularly aware of the need for date/version ordered searching for software issues. Just today I was searching for a error that turned out to be a bad symbolic link but the results from one search engine included material from 2 or 3 years ago. Not all that helpful when you are running the latest release.

May 1, 2014

The Pocket Guide to Bullshit Prevention

Filed under: Communication,Marketing — Patrick Durusau @ 7:10 pm

The Pocket Guide to Bullshit Prevention by Michelle Nijhuis.

From the post:

bs-detector

I am often wrong. I misunderstand; I misremember; I believe things I shouldn’t. I’m overly optimistic about the future quality of Downton Abbey, and inexact in my recall of rock-star shenanigans. But I am not often—knock wood—wrong in print, and that’s because, as a journalist, I’ve had advanced training in Bullshit Prevention Protocol (BPP).

Lately, as I’ve watched smarter and better-dressed friends believe all manner of Internet nonsense, I’ve come to appreciate my familiarity with BPP. Especially because we’re all publishers now. (Sharing a piece of news with 900 Facebook friends is not talking. It’s publishing.) And publishing bullshit is extremely destructive: It makes it harder for the rest of us to distinguish between bogus news and something real, awful, and urgent.

While BPP is not failsafe, generations of crotchety, underpaid, truth-loving journalists have found that it dramatically reduces one’s chances of publishing bullshit.

So I believe that everyone should practice BPP before publishing. No prior experience is required: Though it’s possible to spend a lifetime debating the finer points of BPP (and the sorely-needed news literacy movement wants high-school and college students to spend at least a semester doing so) its general principles, listed in a handy, portable, and free—free!—form above, are simple.

Here’s how they work in practice.

This rocks!

Michelle’s post is a must read to get the maximum benefit from the Pocket Guide to Bullshit Prevention (PGBP).

If I could equip every librarian with one and only one resource for evaluating technologies, it would be this pocket guide.

The 49 words of the PGBP will serve you better than any technology review, guide, article, or testimonial.

It takes effort on your part but the choice is effort on your part or your being taken advantage of by others.

Your call.

I first saw this in a tweet by Neil Saunders.

April 29, 2014

Physical Manifestation of a Topic Map

Filed under: Maps,Marketing,Time,Topic Maps — Patrick Durusau @ 11:59 am

I saw a tweet today referencing Cartographies of Time: A Visual History of the Timeline by Maria Popova by The O.C.R. I have posted about it before Cartographies of Time:… but re-reading material can result in different takes on it. Today is an example of that.

Today when I read the post I recognized the potential of the Discus chronologicus (which has no Wikipedia entry), could be the physical manifestation of a topic map. Or at least one with undisclosed reasons for mapping between domains.

discus chronologicus - Christoph Weigel

Granting it does not provide you with the properties of each subject, save possibly a name (you need something to recognize), with each ring representing what Steve Newcomb calls a “universe of discourse,” and the movable arm represents warp holes between those universes of discourse at particular subjects.

This could be a useful prop for marketing topic maps.

First, it introduces the notion of different vocabularies (universes of discourse) in a very concrete way and demonstrates the advantage of being able to move from one to another. (Assuming here you have chosen universes of discourse of interest to the prospect.)

Second, the lack of space means that it is missing the properties that enabled the mapping, a nice analogy to the construction of most information systems. You can assure the prospect that digital topic maps include that information.

Third, unlike this fixed mapping, another analogy to current data systems, more universes of discourse and subjects can be added to a digital topic map. While at the same time, you retain all the previous mappings. “Recycling prior work,” “not paying 2, 3 or more times for mappings,” are just some of the phrases that come to mind.

I am assuming composing the map in Gimp or other graphics program is doable. The printing and assembly would be more problematic. Will be looking around. Suggestions welcome!

April 28, 2014

Death to bad search results:… [Marketing Topic Maps]

Filed under: Marketing,Topic Maps — Patrick Durusau @ 6:27 pm

Death to bad search results: Elicit fixes website search with some context and a human touch by Michael Carney.

From the post:

Most major brand websites fail to satisfy their customers’ needs. It’s not because the right content isn’t available, but rather because users routinely struggle to find what they’re looking for and leave disappointed. Menu-based navigation systems are confusing and ineffective, while traditional search solutions are more likely to turn up corporate press releases than actual product- or service-related content.

This doesn’t have to be the case.

Elicit is a Chicago-based startup that has been solving this search and discovery problem for major brands like Motorola (previous), Blackberry, Xerox, Time Warner Cable, Bank of America, GoodYear, Whirlpool, and others. The SaaS company was founded in 2011 by a pair of former ad agency execs out of first-hand frustrations.

“We saw that customers and users increasingly start interacting with new sites via the search box,” Elicit co-founder and President Adam Heneghan says. “You spend so much money getting people to your site, but then do a bad job of satisfying them at that point. It makes absolutely no sense. More than 80 percent of site abandonment happens at search box.” (emphasis added)

From a bit further in the post:

“People typically assume that this is a huge, impossible problem to solve. But the reality is, when you look at the data, you can typically solve nearly 100 percent of search queries with just 100 or so keywords, once the data has been properly organized,” Eric Heneghan says.

I first saw this in a post on Facebook lamenting topic maps being ahead of their times.

Perhaps but I think the real difference is that Elicit is marketing a solution to a known problem. One that their customers suffer from and when relieved, the results are visible.

Think of it as being the difference between Walmart selling DIY condom kits versus condoms.

Which one would you drop by Walmart to buy?

April 18, 2014

Marketing Strategy for Topic Maps?

Filed under: Marketing,Topic Maps — Patrick Durusau @ 3:54 pm

Should you reveal a P = NP algorithm? by Lance Fortnow.

I think Lance captures the best topic map marketing strategy when he says:

Once again though no one will take you seriously unless you really have a working algorithm. If you just tell Google you have an algorithm for NP-complete problem they will just ignore you. If you hand them their private keys then they will listen. (emphasis added)

I can think of endless areas that I think would benefit from topic maps, but where foresight fails is in choosing an area and degree of granularity that would interest others.

A topic map about Justin Bieber would be useful in some sense but there sites that organize that data already. What degree of “better” would be required for data about a sulky Canadian to be successful?

Or take OMB data for example. You may remember my post: Free Sequester Data Here! where I list a series of post on converting OMB data into machine readable files and the issues with that data.

Apparently I was the only person in the United States who did not realize OMB reports are stylized fiction meant to serve political ends. The report in question had no connection to reality other than mostly getting department and program names correct.

Putting the question to you: What would make a good (doesn’t have to be great) demonstration of topic maps? One that would resonate with potential customers? BTW, you need to say why it would be a good demonstration of topic maps. In what respects are other resources in the area deficient and why would that deficiency drive someone to seek out topic maps?

I know that is a very broad question but it is an important one to ask and hopefully, to work towards a useful answer.

April 13, 2014

3 Common Time Wasters at Work

Filed under: Business Intelligence,Marketing,Topic Maps — Patrick Durusau @ 4:32 pm

3 Common Time Wasters at Work by Randy Krum.

See Randy’s post for the graphic but #2 was:

Non-work related Internet Surfing

It occurred to me that “Non-work related Internet Surfing” is indistinguishable from….search. At least at arm’s length or better.

And so many people search poorly that a lack of useful results is easy to explain.

Yes?

So, what is the strategy to get the rank and file to use more efficient information systems than search?

Their non-use or non-effective use of your system can torpedo a sale just as quickly as any other cause.

Suggestions?

« Newer PostsOlder Posts »

Powered by WordPress