Another Word For It Patrick Durusau on Topic Maps and Semantic Diversity

February 22, 2014

Simple Ain’t Easy

Filed under: Data Analysis,Mathematics,Statistics — Patrick Durusau @ 2:27 pm

Simple Ain’t Easy: Real-World Problems with Basic Summary Statistics by John Myles White.

From the webpage:

In applied statistical work, the use of even the most basic summary statistics, like means, medians and modes, can be seriously problematic. When forced to choose a single summary statistic, many considerations come into practice.

This repo attempts to describe some of the non-obvious properties possessed by standard statistical methods so that users can make informed choices about methods.

Contributing

The reason I chose to announce a book of examples isn’t just pedagogical: by writing fully independent examples, it’s possible to write a book as a community working in parallel. If 30 people each contributed 10 examples over the next month, we’d have a full-length book containing 300 examples in our hands. In practice, things are complicated by the need to make sure that examples aren’t redundant or low quality, but it’s still possible to make this book a large-scale community project.

As such, I hope you’ll consider contributing. To contribute, just submit a new example. If your example only requires text, you only need to write a short LaTeX-flavored Markdown document. If you need images, please include R code that generates your images.

A great project for several reasons.

First, you can contribute to a public resource that may improve the use of summary statistics.

Second, you have the opportunity to search the literature for examples you want to use on summary statistics. That will improve your searching skills and data skepticism. The first from finding the examples and the second from seeing how statistics are used in the “wild.”

Not to bang on statistics too harshly, I review standards where authors have forgotten how to use quotes and footnotes. Sixth grade type stuff.

Third, and to me the most important reason, as you review the work of others, you will become more conscious of similar mistakes in your own writing.

Think of contributions to Simple Ain’t Easy as exercises in self-improvement that benefit others.

February 8, 2014

Learn R Interactively with Swirl

Filed under: Programming,R,Statistics — Patrick Durusau @ 4:38 pm

Learn R Interactively with Swirl by Nathan Yau.

I guess R counts as “learning to code.” 😉

If you need more detail than Nathan outlines, consider these from Swirl:

The swirl R package is designed to teach you statistics and R simulateously and interactively. If you are new to R, have no fear. On this page, we’ll walk you through each of the steps required to begin using swirl today!

Step 1: Get R

In order to run swirl, you must have R installed on your computer.

If you need to install R, you can do so here.

For help installing R, check out one of the following videos (courtesy of Roger Peng at Johns Hopkins Biostatistics):

Step 2 (optional): Get RStudio

In addition to R, it’s highly recommended that you install RStudio, which will make your experience with R much more enjoyable.

If you need to install RStudio, you can do so here. You probably want the download located under the heading Recommended For Your System.

Step 3: Get swirl!

Open RStudio (or just plain R if you don’t have RStudio) and type the following into the console:

> install.packages("swirl")

Note that the > symbol at the beginning of the line is R’s prompt for you type something into the console. We include it here so you know that this command is to be typed into the console and not elsewhere. The part you type begins after >.

Step 4: Start swirl and let the fun begin!

This is the only step that you will repeat every time you want to run swirl. First, you will load the package using the library() function. Then you will call the function that starts the magic! Type the following, pressing Enter after each line:

> library("swirl")

> swirl()

And you’re off to the races! Please visit our Help page if you have trouble completing any of these steps.

Other R links:

The R Project Resources and Links.

CRAN – Packages

Swirl

February 3, 2014

How to Lie with Statistics

Filed under: Statistics — Patrick Durusau @ 8:55 pm

How to Lie with Statistics by Darrell Huff.

From the introduction:

With prospects of an end to the hallowed old British measures of inches and feet and pounds, the Gallup poll people wondered how well known its metric alternative might be. They asked in the usual way, and learned that even among men and women who had been to a university 33 per cent had never heard of the metric system.

Then a Sunday newspaper conducted a poll of its own – and announced that 98 per cent of its readers knew about the metric system. This, the newspaper boasted, showed ‘how much more knowledgeable’ its readers were than people generally.

How can two polls differ so remarkably?

Gallup interviewers had chosen, and talked to, a carefully selected cross-section of the public. The newspaper had naively, and economically, relied upon coupons clipped, filled in, and mailed in by readers.

It isn’t hard to guess that most of those readers who were unaware of the metric system had little interest in it or the coupon; and they selected themselves out of the poll by not bothering to clip and participate. This self-selection produced, in statistical terms, a biased or unrepresentative sample of just the sort that has led, over the years, to an enormous number of misleading conclusions.

Machiavelli it’s not, but as the tweet from Stat Fact says, #classic.

January 28, 2014

SparkR

Filed under: Parallel Programming,R,Spark,Statistics — Patrick Durusau @ 5:36 pm

Large scale data analysis made easier with SparkR by Shivaram Venkataraman.

From the post:

R is a widely used statistical programming language and supports a variety of data analysis tasks through extension packages. In fact, a recent survey of data scientists showed that R is the most frequently used tool other than SQL databases. However, data analysis in R is limited as the runtime is single threaded and can only process data sets that fit in a single machine.

In an effort to enable large scale data analysis from R, we have recently released SparkR. SparkR is an R package that provides a light-weight frontend to use Spark from R. SparkR allows users to create and transform RDDs in R and interactively run jobs from the R shell on a Spark cluster. You can can try out SparkR today by installing it from our github repo.

Be mindful of the closing caveat:

Right now, SparkR works well for algorithms like gradient descent that are parallelizable but requires users to decide which parts of the algorithm can be run in parallel. In the future, we hope to provide direct access to large scale machine learning algorithms by integrating with Spark’s MLLib. More examples and details about SparkR can be found at http://amplab-extras.github.io/SparkR-pkg.

Early days for SparkR but it has a lot of promise.

I first saw this in a tweet by Jason Trost.

January 23, 2014

$1 Billion Bet, From Another Point of View

Filed under: Probability,Statistics — Patrick Durusau @ 2:20 pm

What’s Warren Buffett’s $1 Billion Basketball Bet Worth? by Corey Chivers.

From the post:

A friend of mine just alerted me to a story on NPR describing a prize on offer from Warren Buffett and Quicken Loans. The prize is a billion dollars (1B USD) for correctly predicting all 63 games in the men’s Division I college basketball tournament this March. The facebook page announcing the contest puts the odds at 1:9,223,372,036,854,775,808, which they note “may vary depending upon the knowledge and skill of entrant”.
….

Corey has some R code for you to do your own analysis based on the skill level of the bettors.

But, while I was thinking about yesterday’s post: Want to win $1,000,000,000 (yes, that’s one billion dollars)?, it occurred to me that the common view of this wager is from a potential winner.

What does this bet look like from Warren Buffet/Quicken Loan point of view?

From the rules:

To be eligible for the $1 billion grand prize, entrants must be 21 years of age, a U.S. citizen and one of the first 10 million to register for the contest. At its sole discretion, Quicken Loans reserves the right and option to expand the entry pool to a larger number of entrants. Submissions will be limited to a total of one per household. (emphasis added)

Only ten million outcomes out of 9,223,372,036,854,775,808 outcomes or 0.00000000010842% of the possible outcomes will be wagered.

$1 Billion is a lot to wager but with wagered outcomes at 0.00000000010842% that leaves 99.9999999998158% of outcomes not wagered.

Remember in multi-player games to consider not only your odds but the odds of others. only the odds that interest you but the odds facing other players.

Thoughts on the probability the tournament outcome will be in the outcomes not wagered?

January 22, 2014

Social Science Dataset Prize!

Filed under: Contest,Dataset,Social Sciences,Socioeconomic Data,Statistics — Patrick Durusau @ 5:49 pm

Statwing is awarding $1,500 for the best insights from its massive social science dataset by Derrick Harris.

All submissions are due through the form on this page by January 30 at 11:59pm PST.

From the post:

Statistics startup Statwing has kicked off a competition to find the best insights from a 406-variable social science dataset. Entries will be voted on by the crowd, with the winner getting $1,000, second place getting $300 and third place getting $200. (Check out all the rules on the Statwing site.) Even if you don’t win, though, it’s a fun dataset to play with.

The data comes from the General Social Survey and dates back to 1972. It contains variables ranging from sex to feelings about education funding, from education level to whether respondents think homosexual men make good parents. I spent about an hour slicing and dicing variable within the Statwing service, and found some at least marginally interesting stuff. Contest entries can use whatever tools they want, and all 79 megabytes and 39,662 rows are downloadable from the contest page.

Time is short so you better start working.

The rules page, where you make your submission, emphasizes:

Note that this is a competition for the most interesting finding(s), not the best visualization.

Use any tool or method, just find the “most interesting finding(s)” as determined by crowd vote.

On the dataset:

Every other year since 1972, the General Social Survey (GSS) has asked thousands of Americans 90 minutes of questions about religion, culture, beliefs, sex, politics, family, and a lot more. The resulting dataset has been cited by more than 14,000 academic papers, books, and dissertations—more than any except the U.S. Census.

I can’t decide if Americans have more odd opinions now than before. 😉

Maybe some number crunching will help with that question.

January 18, 2014

A course in sample surveys for political science

Filed under: Politics,Statistics,Survey — Patrick Durusau @ 8:11 pm

A course in sample surveys for political science by Andrew Gelman.

From the post:

A colleague asked if I had any material for a course in sample surveys. And indeed I do. See here.

It’s all the slides for a 14-week course, also the syllabus (“surveyscourse.pdf”), the final exam (“final2012.pdf”) and various misc files. Also more discussion of final exam questions here (keep scrolling thru the “previous entries” until you get to Question 1).

Enjoy! This is in no way a self-contained teach-it-yourself course, but I do think it could be helpful for anyone who is trying to teach a class on this material.

An impressive bundle of survey material!

I mention it because you may be collecting survey data or at least asked to process survey data.

Hopefully it won’t originate from Survey Monkey.

If I had $1 for every survey composed by a statistical or survey illiterate on Survey Monkey, I could make a substantial down payment on the national debt.

That’s not the fault of Survey Monkey but there is more to survey work than asking questions.

If you don’t know how to write a survey, do us all a favor, make up the numbers and say that in a footnote. You will be in good company with the piracy estimators.

Introduction to Statistical Computing

Filed under: Computation,Computer Science,R,Statistics — Patrick Durusau @ 7:54 pm

Introduction to Statistical Computing by Cosma Shalizi.

Description:

Computational data analysis is an essential part of modern statistics. Competent statisticians must not just be able to run existing programs, but to understand the principles on which they work. They must also be able to read, modify and write code, so that they can assemble the computational tools needed to solve their data-analysis problems, rather than distorting problems to fit tools provided by others. This class is an introduction to programming, targeted at statistics majors with minimal programming knowledge, which will give them the skills to grasp how statistical software works, tweak it to suit their needs, recombine existing pieces of code, and when needed create their own programs.

Students will learn the core of ideas of programming — functions, objects, data structures, flow control, input and output, debugging, logical design and abstraction — through writing code to assist in numerical and graphical statistical analyses. Students will in particular learn how to write maintainable code, and to test code for correctness. They will then learn how to set up stochastic simulations, how to parallelize data analyses, how to employ numerical optimization algorithms and diagnose their limitations, and how to work with and filter large data sets. Since code is also an important form of communication among scientists, students will learn how to comment and organize code.

The class will be taught in the R language.

Slides and R code for three years (as of the time of this post.

January 3, 2014

The Ten Commandments of Statistical Inference

Filed under: Mathematics,Statistics — Patrick Durusau @ 2:45 pm

The Ten Commandments of Statistical Inference by Dr. Richard Lenski.

From the post:

1. Remember the type II error, for therein is reflected the power if not the glory.

These ten commandments (see the post for the other nine) are part and parcel of knowing your data and the assumptions of the processing applied to it.

Think of it as a short checklist to keep yourself and especially others, honest.

January 2, 2014

Astrostatistics: The Re-Emergence of a Statistical Discipline

Filed under: Astroinformatics,Information Science,Statistics — Patrick Durusau @ 4:52 pm

Astrostatistics: The Re-Emergence of a Statistical Discipline by Joseph M. Hilbe.

From the post:

If statistics can be generically understood as the science of collecting and analyzing data for the purpose of classification and prediction and of attempting to quantify and understand the uncertainty inherent in phenomena underlying data, surely astrostatistics must be considered as one of the oldest, if not the oldest, applications of statistical science to the study of nature. Astrostatistics is the discipline dealing with the statistical analysis of astronomical and astrophysical data. It also has been understood by most researchers in the area to incorporate astroinformatics, which is the science of gathering and digitalizing astronomical data for the purpose of analysis.

I mentioned that astrostatistics is a very old discipline—if we accept the broad criterion I gave for how statistics can be understood. Egyptian and Babylonian priests who assiduously studied the motions of the sun, moon, planets, and stars as long ago as 1500 BCE classified and attempted to predict future events for the purpose of knowing when to plant, determining when a new year began, and so forth. However, their predictions were infused by the attempt to understand the effects of the celestial motions on human affairs (astrology). Later, Thales (d 546 BCE), the Ionian Greek reputed to be both the first philosopher and mathematician, apparently began to divorce mythology from scientific investigation. He is credited with predicting an eclipse in 585 BCE, which he allegedly based on studies made of previous eclipses from records kept by Egyptian priests.

A short but interesting review of the history of astrostatistics and its increasing importance as the rate of astronomical data collection continues to increase.

And a call for more inter-disciplinary work between astronomers, astrophysicists, statisticians and information scientists.

The ability to cross over tribal (disciplinary) boundaries could be eased by cross-disciplinary mappings.

December 10, 2013

Statistics, Data Mining, and Machine Learning in Astronomy:…

Filed under: Astroinformatics,Data Mining,Machine Learning,Statistics — Patrick Durusau @ 3:26 pm

Statistics, Data Mining, and Machine Learning in Astronomy: A Practical Python Guide for the Analysis of Survey Data by Željko Ivezic, Andrew J. Connolly, Jacob T VanderPlas, Alexander Gray.

From the Amazon page:

As telescopes, detectors, and computers grow ever more powerful, the volume of data at the disposal of astronomers and astrophysicists will enter the petabyte domain, providing accurate measurements for billions of celestial objects. This book provides a comprehensive and accessible introduction to the cutting-edge statistical methods needed to efficiently analyze complex data sets from astronomical surveys such as the Panoramic Survey Telescope and Rapid Response System, the Dark Energy Survey, and the upcoming Large Synoptic Survey Telescope. It serves as a practical handbook for graduate students and advanced undergraduates in physics and astronomy, and as an indispensable reference for researchers.

Statistics, Data Mining, and Machine Learning in Astronomy presents a wealth of practical analysis problems, evaluates techniques for solving them, and explains how to use various approaches for different types and sizes of data sets. For all applications described in the book, Python code and example data sets are provided. The supporting data sets have been carefully selected from contemporary astronomical surveys (for example, the Sloan Digital Sky Survey) and are easy to download and use. The accompanying Python code is publicly available, well documented, and follows uniform coding standards. Together, the data sets and code enable readers to reproduce all the figures and examples, evaluate the methods, and adapt them to their own fields of interest.

  • Describes the most useful statistical and data-mining methods for extracting knowledge from huge and complex astronomical data sets
  • Features real-world data sets from contemporary astronomical surveys
  • Uses a freely available Python codebase throughout
  • Ideal for students and working astronomers

Still in pre-release but if you want to order the Kindle version (or hardback) to be sent to me, I’ll be sure to it on my list of items to blog about in 2014!

Or your favorite book on graphs, data analysis, etc, for that matter. 😉

November 2, 2013

Statistics Done Wrong

Filed under: Skepticism,Statistics — Patrick Durusau @ 4:29 pm

Statistics Done Wrong by Alex Reinhart.

From the post:

If you’re a practicing scientist, you probably use statistics to analyze your data. From basic t tests and standard error calculations to Cox proportional hazards models and geospatial kriging systems, we rely on statistics to give answers to scientific problems.

This is unfortunate, because most of us don’t know how to do statistics.

Statistics Done Wrong is a guide to the most popular statistical errors and slip-ups committed by scientists every day, in the lab and in peer-reviewed journals. Many of the errors are prevalent in vast swathes of the published literature, casting doubt on the findings of thousands of papers. Statistics Done Wrong assumes no prior knowledge of statistics, so you can read it before your first statistics course or after thirty years of scientific practice.

Dive in: the whole guide is available online!

Something to add to your data skeptic bag.

As a matter of fact, a summary of warning signs for these problems would fit on 81/2 by 11 (or A4) paper.

Thinking when you show up to examine a data set, you have Statistic Done Wrong with the web address on the back of your laminated cheat sheets.

Part of being a data skeptic is intuiting where to push so that the data “as presented” unravels.

I first saw this in Nat Torkington’s Four short links: 30 October 2013.

October 30, 2013

MADlib

Filed under: Analytics,Machine Learning,MADlib,Mathematics,Statistics — Patrick Durusau @ 6:58 pm

MADlib

From the webpage:

MADlib is an open-source library for scalable in-database analytics. It provides data-parallel implementations of mathematical, statistical and machine-learning methods for structured and unstructured data.

The MADlib mission: to foster widespread development of scalable analytic skills, by harnessing efforts from commercial practice, academic research, and open-source development.

Until the Impala post called my attention to it, I didn’t realize that MADlib had an upgrade earlier in October to 1.3!

Congratulations to MADlib!

October 14, 2013

Diagrams for hierarchical models – we need your opinion

Filed under: Bayesian Data Analysis,Bayesian Models,Graphics,Statistics — Patrick Durusau @ 10:49 am

Diagrams for hierarchical models – we need your opinion by John K. Kruschke.

If you haven’t done any good deeds lately, here is a chance to contribute to the common good.

From the post:

When trying to understand a hierarchical model, I find it helpful to make a diagram of the dependencies between variables. But I have found the traditional directed acyclic graphs (DAGs) to be incomplete at best and downright confusing at worst. Therefore I created differently styled diagrams for Doing Bayesian Data Analysis (DBDA). I have found them to be very useful for explaining models, inventing models, and programming models. But my idiosyncratic impression might be only that, and I would like your insights about the pros and cons of the two styles of diagrams. (emphasis in original)

John’s post has the details of the different diagram styles.

Which do you like better?

John is also the author of: Doing Bayesian data analysis : a tutorial with R and BUGS. My library system doesn’t have a copy but I can report that it has gotten really good reviews.

October 13, 2013

Eurostat regional yearbook 2013 [PDF as Topic Map Interface?]

Filed under: EU,Government,Interface Research/Design,Statistics — Patrick Durusau @ 9:02 pm

Eurostat regional yearbook 2013

From the webpage:

Statistical information is an important tool for understanding and quantifying the impact of political decisions in a specific territory or region. The Eurostat regional yearbook 2013 gives a detailed picture relating to a broad range of statistical topics across the regions of the Member States of the European Union (EU), as well as the regions of EFTA and candidate countries. Each chapter presents statistical information in maps, figures and tables, accompanied by a description of the main findings, data sources and policy context. These regional indicators are presented for the following 11 subjects: economy, population, health, education, the labour market, structural business statistics, tourism, the information society, agriculture, transport, and science, technology and innovation. In addition, four special focus chapters are included in this edition: these look at European cities, the definition of city and metro regions, income and living conditions according to the degree of urbanisation, and rural development.

The Statistical Atlas is an interactive map viewer, which contains statistical maps from the Eurostat regional yearbook and provides the possibility to download these maps as high-resolution PDFs.

PDF version of the Eurostat regional yearbook 2013

But this isn’t a dead PDF file:

Under each table, figure or map in all Eurostat publications you will find hyperlinks with Eurostat online data codes, allowing easy access to the most recent data in Eurobase, Eurostat’s online database. A data code leads to either a two- or three-dimensional table in the TGM (table, graph, map) interface or to an open dataset which generally contains more dimensions and longer time series using the Data Explorer interface (3). In the Eurostat regional yearbook, these online data codes are given as part of the source below each table, figure and map.

In the PDF version of this publication, the reader is led directly to the freshest data when clicking on the hyperlinks for Eurostat online data codes. Readers of the printed version can access the freshest data by typing a standardised hyperlink into a web browser, for example:

http://ec.europa.eu/eurostat/product?code=&mode=view, where is to be replaced by the online data code in question.

A great data collection for anyone interested in the EU.

Take particular note of how delivery in PDF format does not preclude accessing additional information.

I assume that would extend to topic map-based content as well.

Where there is a tradition of delivery of information in a particular form, why would you want to change it?

Or to put it differently, what evidence is there of a pay-off from another form of delivery?

Noting that I don’t consider hyperlinks to be substantively different from other formal references.

Formal references are a staple of useful writing, albeit hyperlinks (can) take less effort to follow.

October 8, 2013

Data Mining Book Review: How to Lie with Statistics

Filed under: Graphs,Humor,Statistics — Patrick Durusau @ 7:14 pm

Data Mining Book Review: How to Lie with Statistics by Sandro Saitta.

Sandro reviews “How to Lie with Statistics.”

It’s not a “recent” publication. 😉

However, it is an extremely amusing publication.

If you search for “How to Lie with Statistics PDF” I am fairly sure you will turn up copies on the WWW.

Enjoy!

From Algorithms to Z-Scores:…

Filed under: Algorithms,Computer Science,Mathematics,Probability,R,Statistics — Patrick Durusau @ 2:47 pm

From Algorithms to Z-Scores: Probabilistic and Statistical Modeling in Computer Science by Noram Matloff.

From the Overview:

The materials here form a textbook for a course in mathematical probability and statistics for computer science students. (It would work fine for general students too.)


“Why is this text different from all other texts?”

  • Computer science examples are used throughout, in areas such as: computer networks; data and text mining; computer security; remote sensing; computer performance evaluation; software engineering; data management; etc.
  • The R statistical/data manipulation language is used throughout. Since this is a computer science audience, a greater sophistication in programming can be assumed. It is recommended that my R tutorials be used as a supplement:

  • Throughout the units, mathematical theory and applications are interwoven, with a strong emphasis on modeling: What do probabilistic models really mean, in real-life terms? How does one choose a model? How do we assess the practical usefulness of models?

    For instance, the chapter on continuous random variables begins by explaining that such distributions do not actually exist in the real world, due to the discreteness of our measuring instruments. The continuous model is therefore just that–a model, and indeed a very useful model.

    There is actually an entire chapter on modeling, discussing the tradeoff between accuracy and simplicity of models.

  • There is considerable discussion of the intuition involving probabilistic concepts, and the concepts themselves are defined through intuition. However, all models and so on are described precisely in terms of random variables and distributions.

Another open-source textbook from Norm Matloff!

Algorithms to Z-Scores (the book).

Source files for the book available at: http://heather.cs.ucdavis.edu/~matloff/132/PLN .

Norm suggests his R tutorial, R for Programmers http://heather.cs.ucdavis.edu/~matloff/R/RProg.pdf as supplemental reading material.

To illustrate the importance of statistics, Norm gives the following examples in chapter 1:

  • The statistical models used on Wall Street made the quants” (quantitative analysts) rich— but also contributed to the worldwide fi nancial crash of 2008.
  • In a court trial, large sums of money or the freedom of an accused may hinge on whether the judge and jury understand some statistical evidence presented by one side or the other.
  • Wittingly or unconsciously, you are using probability every time you gamble in a casino— and every time you buy insurance.
  • Statistics is used to determine whether a new medical treatment is safe/e ffective for you.
  • Statistics is used to flag possible terrorists —but sometimes unfairly singling out innocent people while other times missing ones who really are dangerous.

Mastering the material in this book will put you a long way to becoming a network “statistical skeptic.”

So you can debunk mis-leading or simply wrong claims by government, industry and special interest groups. Wait! Those are also known as advertisers. Never mind.

September 12, 2013

Why Most Published Research Findings Are False [As Are Terrorist Warnings]

Filed under: Data Analysis,Statistics — Patrick Durusau @ 5:57 pm

Why Most Published Research Findings Are False by John Baez.

John’s post is based on John P. A. Ioannidis, Why most published research findings are false, PLoS Medicine 2 (2005), e124, and is very much worth your time to read carefully.

Here is a cartoon that illustrates one problem with research findings (John uses it and it appears in the original paper):

significant

The danger of attributing false significance isn’t limited to statistical data.

Consider Vinson Cerf’s Freedom and the Social Contract in the most recent issue of CACM.

Vinson writes in discussing privacy versus the need for security:

In today’s world, threats to our safety and threats to national security come from many directions and not all or even many of them originate from state actors. If I can use the term “cyber-safety” to suggest safety while making use of the content and tools of the Internet, World Wide Web, and computing devices in general, it seems fair to say the expansion of these services and systems has been accompanied by a growth in their abuse. Moreover, it has been frequently observed that there is an asymmetry in the degree of abuse and harm that individuals can perpetrate on citizens, and on the varied infrastructure of our society. Vast harm and damage may be inflicted with only modest investment in resources. Whether we speak of damage and harm using computer-based tools or damage from lethal, homemade explosives, the asymmetry is apparent. While there remain serious potential threats to the well-being of citizens from entities we call nation- states, there are similarly serious potential threats originating with individuals and small groups.

None of which is false and the reader with a vague sense that some “we” is in danger from known and unknown actors.

To what degree? Unknown. Of what harm? Unknown. Chances of success? Unknown. Personal level of danger? Unknown.

What we do know is that on September 11, 2001, approximately 3,000 people died. Twelve years ago.

Deaths from medical misadventure are estimated to be 98,000 per year.

12 X 98,000 = 1,176,000 or 392 9/11 attack death totals.

Deaths due to medical misadventure are not known accurately but the overall comparison is a valid one.

Your odds of dying from medical misadventure are far higher than dying from a terrorist attack.

But, Vinson doesn’t warn you against death by medical misadventure. Instead you are warned there is some vague, even nebulous individuals or groups that seek to do you harm.

An unknown degree of harm. With some unknown rate of incidence.

And that position is to be taken seriously in a debate over privacy?

Most terrorism warnings are too vague for meaningful policy debate.

August 30, 2013

An ignored issue in Big Data analysis

Filed under: BigData,Humor,Statistics — Patrick Durusau @ 7:06 pm

An ignored issue in Big Data analysis by Kaiser Fung.

Kaiser debunks a couple of recent stories that were powered, so it was said, by “analysis” of “big data.”

Short, highly amusing and worth your time to read.

If you practice this type of statistical analysis (or lack thereof) you need to also be using Bible codes. Or a Ouija Board.

Statistical Thinking: [free book]

Filed under: Mathematics,Statistics — Patrick Durusau @ 6:59 pm

Statistical Thinking: A Simulation Approach to Modeling Uncertainty

From the post:

Catalyst Press has just released the second edition of the book Statistical Thinking: A Simulation Approach to Modeling Uncertainty. The material in the book is based on work related to the NSF-funded CATALST Project (DUE-0814433). It makes exclusive use of simulation to carry out inferential analyses. The material also builds on best practices and materials developed in statistics education, research and theory from cognitive science, as well as materials and methods that are successfully achieving parallel goals in other disciplines (e.g., mathematics and engineering education).

The materials in the book help students:

    ďżź

  • Build a foundation for statistical thinking through immersion in real world problems and data
  • Develop an appreciation for the use of data as evidence
  • Use simulation to address questions involving statistical inference including randomization tests and bootstrap intervals
  • Model and simulate data using TinkerPlots™ software

Definitely a volume for the short reading list.

Applicable in a number of areas, from debunking statistical arguments in public debates to developing useful models for your clients.

July 16, 2013

ndtv: network dynamic temporal visualization

Filed under: Graphs,R,Statistics,Visualization — Patrick Durusau @ 3:55 pm

ndtv: network dynamic temporal visualization by Skye Bender-deMoll.

From the post:

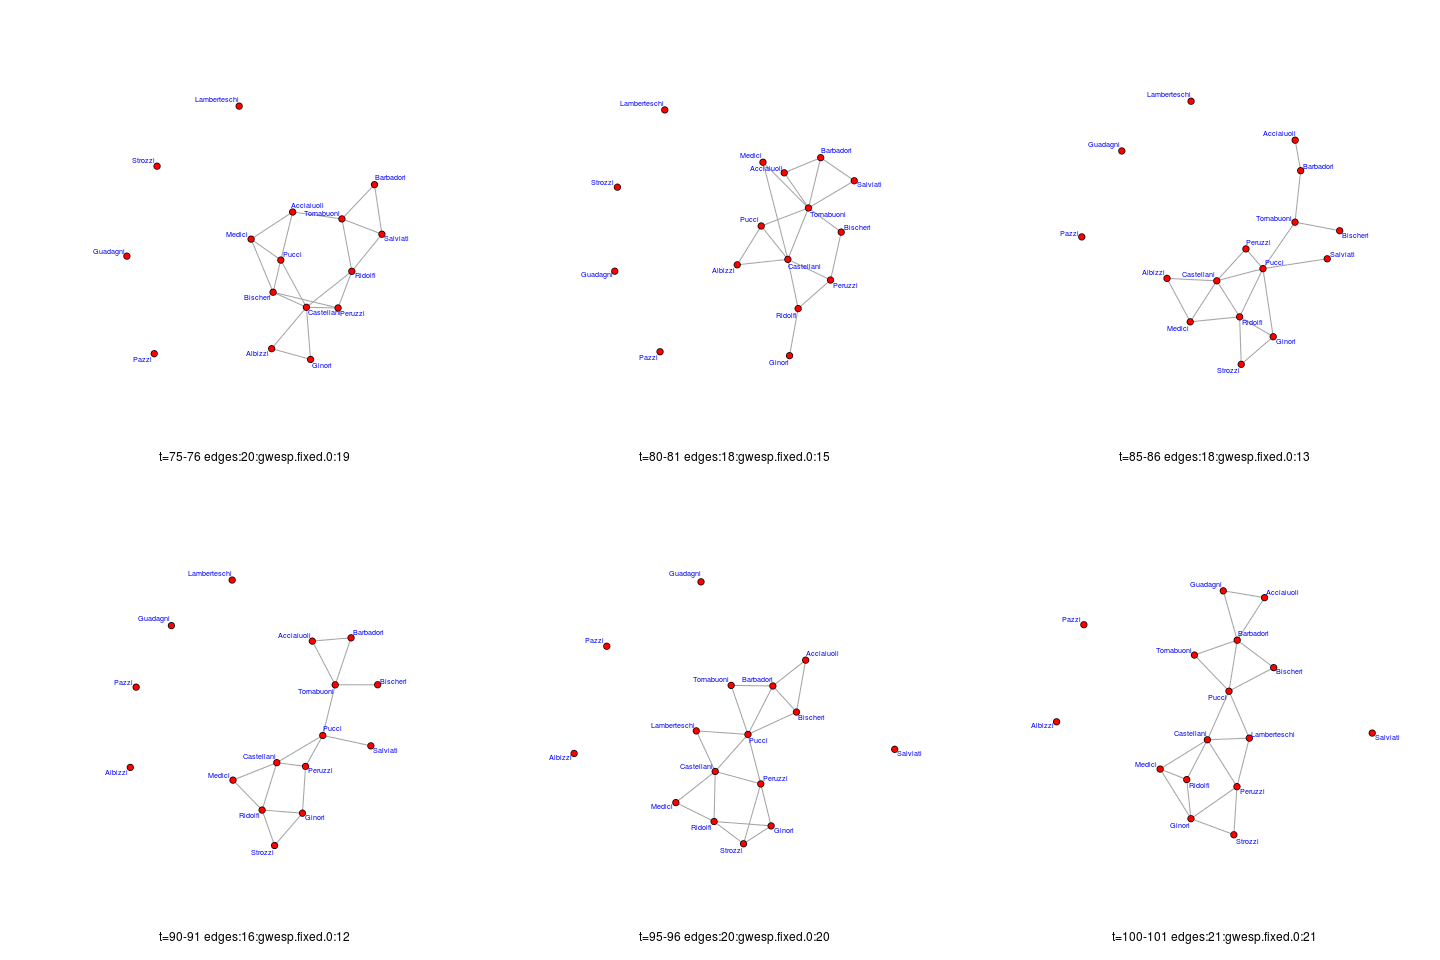
The ndtv package is finally up on CRAN! Here is a the output of a toy “tergm” simulation of edge dynamics, rendered as an animated GIF:

animated gif

[link to movie version a basic tergm simulation]

For the past year or so I’ve been doing increasing amounts of work building R packages as part of the statnet team. The statnet project is focused on releasing tools for doing statistical analysis on networks (Exponential Random Graph Models “ERGMs”) but also includes some lower-level packages for efficiently working with network data in R, including dynamic network data (the networkDynamic package). One of my main responsibilities is to implement some network animation techniques in an R package to make it easy to generate movies of various types of simulation output. That package is named “ndtv“, and we finally got it released on CRAN (the main archive of R packages) a few days ago.

Dynamic network data?

What? Networks aren’t static? 😉

Truth be told, “static” is a simplification that depends on your frame of reference.

Something to remember when offered a “static” data solution.

I first saw this at Pete Warden’s Five Short Links, July 15, 2013.

July 13, 2013

Methods in Biostatistics I [Is Your World Black-or-White?]

Filed under: Biostatistics,Mathematics,Statistics — Patrick Durusau @ 12:24 pm

Methods in Biostatistics I John Hopkins School of Public Health.

From the webpage:

Presents fundamental concepts in applied probability, exploratory data analysis, and statistical inference, focusing on probability and analysis of one and two samples. Topics include discrete and continuous probability models; expectation and variance; central limit theorem; inference, including hypothesis testing and confidence for means, proportions, and counts; maximum likelihood estimation; sample size determinations; elementary non-parametric methods; graphical displays; and data transformations.

If you want more choices than black-or-white for modeling your world, statistics are a required starting point.

June 30, 2013

SciPy2013 Videos

Filed under: Python,Scikit-Learn,Statistics — Patrick Durusau @ 6:13 pm

SciPy2013 Videos

A really nice set of videos, including tutorials, from SciPy2013.

Due to the limitations of YouTube, the listing is a mess.

If I have time later this week I will try to produce a cleaned up listing.

in the meantime, enjoy!

May 23, 2013

Probabilistic Programming and Bayesian Methods for Hackers

Filed under: Bayesian Data Analysis,Bayesian Models,Statistics — Patrick Durusau @ 8:59 am

Probabilistic Programming and Bayesian Methods for Hackers by Cam Davidson-Pilon and others.

From the website:

The Bayesian method is the natural approach to inference, yet it is hidden from readers behind chapters of slow, mathematical analysis. The typical text on Bayesian inference involves two to three chapters on probability theory, then enters what Bayesian inference is. Unfortunately, due to mathematical intractability of most Bayesian models, the reader is only shown simple, artificial examples. This can leave the user with a so-what feeling about Bayesian inference. In fact, this was the author’s own prior opinion.

After some recent success of Bayesian methods in machine-learning competitions, I decided to investigate the subject again. Even with my mathematical background, it took me three straight-days of reading examples and trying to put the pieces together to understand the methods. There was simply not enough literature bridging theory to practice. The problem with my misunderstanding was the disconnect between Bayesian mathematics and probabilistic programming. That being said, I suffered then so the reader would not have to now. This book attempts to bridge the gap.

If Bayesian inference is the destination, then mathematical analysis is a particular path to towards it. On the other hand, computing power is cheap enough that we can afford to take an alternate route via probabilistic programming. The latter path is much more useful, as it denies the necessity of mathematical intervention at each step, that is, we remove often-intractable mathematical analysis as a prerequisite to Bayesian inference. Simply put, this latter computational path proceeds via small intermediate jumps from beginning to end, where as the first path proceeds by enormous leaps, often landing far away from our target. Furthermore, without a strong mathematical background, the analysis required by the first path cannot even take place.

Bayesian Methods for Hackers is designed as a introduction to Bayesian inference from a computational/understanding-first, and mathematics-second, point of view. Of course as an introductory book, we can only leave it at that: an introductory book. For the mathematically trained, they may cure the curiosity this text generates with other texts designed with mathematical analysis in mind. For the enthusiast with less mathematical-background, or one who is not interested in the mathematics but simply the practice of Bayesian methods, this text should be sufficient and entertaining.

Not yet complete but what is there you will find very useful.

May 10, 2013

Harvard Stat 221

Filed under: CS Lectures,Data Science,Mathematics,Statistics — Patrick Durusau @ 6:36 pm

Harvard Stat 221 “Statistical Computing and Visualization”: by Sergiy Nesterko.

From the post:

Stat 221 is Statistical Computing and Visualization. It’s a graduate class on analyzing data without losing scientific rigor, and communicating your work. Topics span the full cycle of a data-driven project including project setup, design, implementation, and creating interactive user experiences to communicate ideas and results. We covered current theory and philosophy of building models for data, computational methods, and tools such as d3js, parallel computing with MPI, R.

See Sergily’s post for the lecture slides from this course.

May 5, 2013

Povcalnet – World Bank Poverty Stats

Filed under: Government Data,Statistics — Patrick Durusau @ 4:40 pm

DIY: Measuring Global, Regional Poverty Using PovcalNet, the Online Computational Tool behind the World Bank’s Poverty Statistics by Shaohua Chen.

I’m surprised some Republican in the U.S. House or Senate isn’t citing Povcalnet as evidence there is no poverty in the United States.

The trick of course is in how you define “poverty.”

The World Bank uses $1, $1.25 and $2.00 a day as poverty lines.

While there is widespread global hunger and disease, is income sufficient to participate in the global economy really the best measure for poverty?

If the documentaries are to be believed, there are tribes of Indians who live in the rain forests of Brazil, quite healthily, without any form of money at all.

They are not buying iPods with foreign music to replace their own but that isn’t being impoverished. Is it?

There is the related issue that someone else is classifying people as impoverished.

I wonder how they would classify themselves?

Statistics could be made more transparent through the use of topic maps.

May 2, 2013

SemStats 2013

Filed under: Conferences,Semantics,Statistics — Patrick Durusau @ 5:09 am

First International Workshop on Semantic Statistics (SemStats 2013)

Deadline for paper submission: Friday, 12 July 2013, 23:59 (Hawaii time)
Notification of acceptance/rejection: Friday, 9 August 2013
Deadline for camera-ready version: Friday, 30 August 2013

From the call for papers:

The goal of this workshop is to explore and strengthen the relationship between the Semantic Web and statistical communities, to provide better access to the data held by statistical offices. It will focus on ways in which statisticians can use Semantic Web technologies and standards in order to formalize, publish, document and link their data and metadata.

The statistical community has recently shown an interest in the Semantic Web. In particular, initiatives have been launched to develop semantic vocabularies representing statistical classifications and discovery metadata. Tools are also being created by statistical organizations to support the publication of dimensional data conforming to the Data Cube specification, now in Last Call at W3C. But statisticians see challenges in the Semantic Web: how can data and concepts be linked in a statistically rigorous fashion? How can we avoid fuzzy semantics leading to wrong analyses? How can we preserve data confidentiality?

The workshop will also cover the question of how to apply statistical methods or treatments to linked data, and how to develop new methods and tools for this purpose. Except for visualisation techniques and tools, this question is relatively unexplored, but the subject will obviously grow in importance in the near future.

An unfortunate emphasis on linked data before understanding the problem of imbuing statistical data with semantics.

Studying the needs of the statistical community for semantics and to what degree would be more likely to yield useful requirements.

And from requirements, then to proceed to find appropriate solutions.

As opposed to arriving solution in hand, with saws, pry bars, shoe horns and similar tools for affixing the solution to any problem.

April 16, 2013

Does statistics have an ontology? Does it need one? (draft 2)

Filed under: Ontology,Statistics — Patrick Durusau @ 3:49 pm

Does statistics have an ontology? Does it need one? (draft 2) by D. Mayo.

From the post:

Chance, rational beliefs, decision, uncertainty, probability, error probabilities, truth, random sampling, resampling, opinion, expectations. These are some of the concepts we bandy about by giving various interpretations to mathematical statistics, to statistical theory, and to probabilistic models. But are they real? The question of “ontology” asks about such things, and given the “Ontology and Methodology” conference here at Virginia Tech (May 4, 5), I’d like to get your thoughts (for possible inclusion in a Mayo-Spanos presentation).* Also, please consider attending**.

Interestingly, I noticed the posts that have garnered the most comments have touched on philosophical questions of the nature of entities and processes behind statistical idealizations (e.g.,http://errorstatistics.com/2012/10/18/query/).

The post and ensuing comments offer much to consider.

From my perspective, if assumptions, ontological and otherwise, go unstated, the results opaque.

You can accept them, because they fit your prior opinion or how you wanted the results to be, or reject them as not fitting your prior opinion or desired result.

April 5, 2013

Probability and Statistics Cookbook

Filed under: Mathematics,Probability,Statistics — Patrick Durusau @ 3:02 pm

Probability and Statistics Cookbook by Matthias Vallentin.

From the webpage:

The cookbook contains a succinct representation of various topics in probability theory and statistics. It provides a comprehensive reference reduced to the mathematical essence, rather than aiming for elaborate explanations.

When Matthias says “succient,” he is quite serious:

Probability Screenshot

But by the time you master the twenty-seven pages of this “cookbook,” you will have a very good grounding on probability and statistics.

April 3, 2013

100 Savvy Sites on Statistics and Quantitative Analysis

Filed under: Mathematics,Quantitative Analysis,Statistics — Patrick Durusau @ 4:21 am

100 Savvy Sites on Statistics and Quantitative Analysis

From the post:

Nate Silver’s unprecedented accurate prediction of state-by-state election results in the most recent presidential race was a watershed moment for the public awareness of statistics. While data gathering and analysis has become a massive industry in the past decade, it hasn’t always been as well covered in the press or publicly accessible as it is now. With more and more of our daily interactions being mediated through computers and the internet, it is easier than ever to gather detailed quantitative data and do statistical analysis on that data derive valuable information and predictions from it.

Knowledge of statistics and quantitative analysis techniques is more valuable than ever. From biostatisticians to politicians and economists, people in every field are using statistics to further their careers and knowledge. These sites are some of the most useful, informative, and comprehensive on the web covering stats and quantitative analysis.

Covers everything from Comprehensive Statistics Sites and Big Data to Data Visualization and Sports Stats.

Fire up your alternative to Google Reader!

I first saw this at 100 Savvy Sites on Statistics and Quantitative Analysis by Vincent Granville.

« Newer PostsOlder Posts »

Powered by WordPress