ndtv: network dynamic temporal visualization by Skye Bender-deMoll.
From the post:
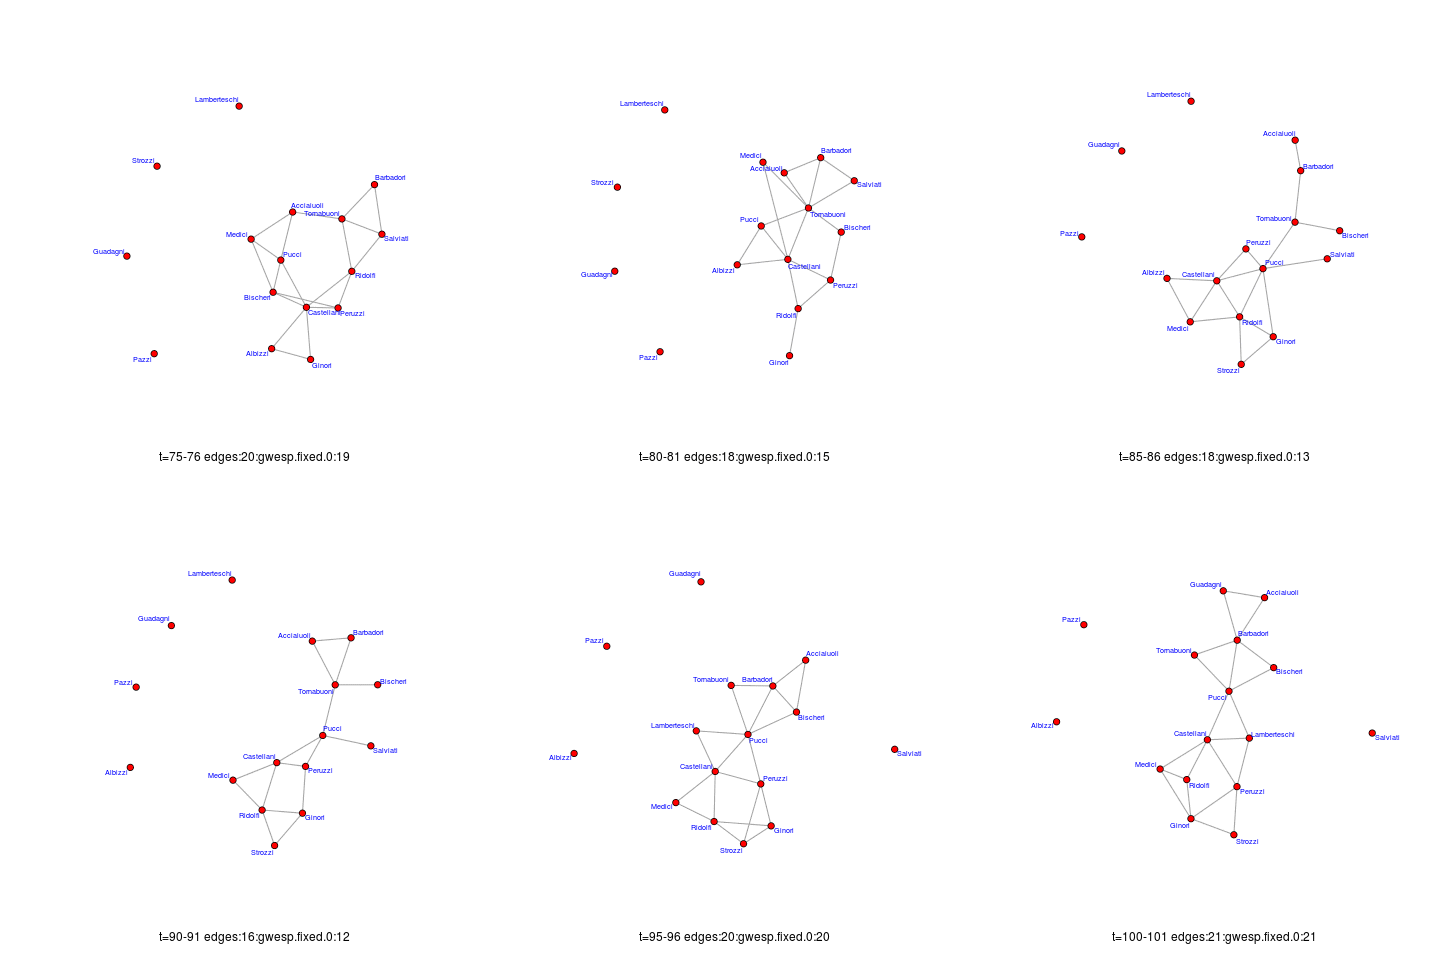
The ndtv package is finally up on CRAN! Here is a the output of a toy “tergm” simulation of edge dynamics, rendered as an animated GIF:
[link to movie version a basic tergm simulation]
For the past year or so I’ve been doing increasing amounts of work building R packages as part of the statnet team. The statnet project is focused on releasing tools for doing statistical analysis on networks (Exponential Random Graph Models “ERGMs”) but also includes some lower-level packages for efficiently working with network data in R, including dynamic network data (the networkDynamic package). One of my main responsibilities is to implement some network animation techniques in an R package to make it easy to generate movies of various types of simulation output. That package is named “ndtv“, and we finally got it released on CRAN (the main archive of R packages) a few days ago.
Dynamic network data?
What? Networks aren’t static? 😉
Truth be told, “static” is a simplification that depends on your frame of reference.
Something to remember when offered a “static” data solution.
I first saw this at Pete Warden’s Five Short Links, July 15, 2013.
