Another Word For It Patrick Durusau on Topic Maps and Semantic Diversity

December 9, 2014

Data Science with Hadoop: Predicting Airline Delays – Part 2

Filed under: Hadoop,Hortonworks,Machine Learning,Python,R,Spark — Patrick Durusau @ 5:25 pm

Using machine learning algorithms, Spark and Scala – Part 2 by Ofer Mendelevitch and Beau Plath.

From the post:

In this 2nd part of the blog post and its accompanying IPython Notebook in our series on Data Science and Apache Hadoop, we continue to demonstrate how to build a predictive model with Apache Hadoop, using existing modeling tools. And this time we’ll use Apache Spark and ML-Lib.

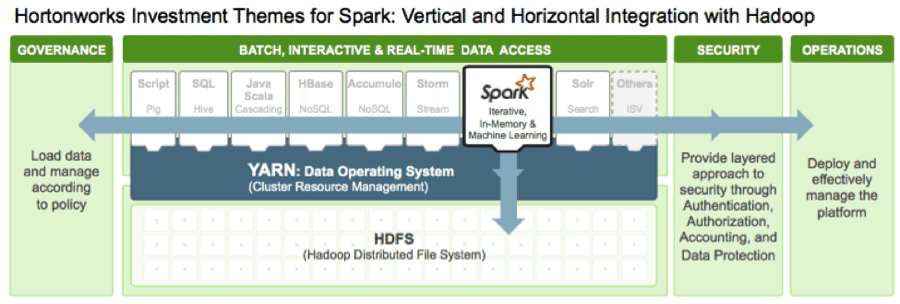
Apache Spark is a relatively new entrant to the Hadoop ecosystem. Now running natively on Apache Hadoop YARN, the architectural center of Hadoop, Apache Spark is an in-memory data processing API and execution engine that is effective for machine learning and data science use cases. And with Spark on YARN, data workers can simultaneously use Spark for data science workloads alongside other data access engines–all accessing the same shared dataset on the same cluster.

ds_2_1

The next installment in this series continues the analysis with the same dataset but then with R!

The bar for user introductions to technology is getting higher even as we speak!

Data Science with Apache Hadoop: Predicting Airline Delays (Part 1)

Filed under: Hadoop,Hortonworks,Machine Learning,Python,R,Spark — Patrick Durusau @ 5:06 pm

Using machine learning algorithms, Pig and Python – Part 1 by Ofer Mendelevitch.

From the post:

With the rapid adoption of Apache Hadoop, enterprises use machine learning as a key technology to extract tangible business value from their massive data assets. This derivation of business value is possible because Apache Hadoop YARN as the architectural center of Modern Data Architecture (MDA) allows purpose-built data engines such as Apache Tez and Apache Spark to process and iterate over multiple datasets for data science techniques within the same cluster.

ds_1

It is a common misconception that the way data scientists apply predictive learning algorithms like Linear Regression, Random Forest or Neural Networks to large datasets requires a dramatic change in approach, in tooling, or in usage of siloed clusters. Not so: no dramatic change; no dedicated clusters; using existing modeling tools will suffice.

In fact, the big change is in what is known as “feature engineering”—the process by which very large raw data is transformed into a “feature matrix.” Enabled by Apache Hadoop with YARN as an ideal platform, this transformation of large raw datasets (terabytes or petabytes) into a feature matrix is now scalable and not limited by RAM or compute power of a single node.

Since the output of the feature engineering step (the “feature matrix”) tends to be relatively small in size (typically in the MB or GB scale), a common choice is to run the learning algorithm on a single machine (often with multiple cores and high amount of RAM), allowing us to utilize a plethora of existing robust tools and algorithms from R packages, Python’s Scikit-learn, or SAS.

In this multi-part blog post and its accompanying IPython Notebook, we will demonstrate an example step-by-step solution to a supervised learning problem. We will show how to solve this problem with various tools and libraries and how they integrate with Hadoop. In part I we focus on Apache PIG, Python, and Scikit-learn, while in subsequent parts, we will explore and examine other alternatives such as R or Spark/ML-Lib

With the IPython notebook, this becomes a great example of how to provide potential users hands-on experience with a technology.

An example that Solr, for example, might well want to imitate.

PS: When I was traveling, a simpler way to predict flight delays was to just ping me for my travels plans. 😉 You?

November 24, 2014

Writing an R package from scratch

Filed under: Programming,R — Patrick Durusau @ 3:30 pm

Writing an R package from scratch by Hilary Parker.

From the post:

As I have worked on various projects at Etsy, I have accumulated a suite of functions that help me quickly produce tables and charts that I find useful. Because of the nature of iterative development, it often happens that I reuse the functions many times, mostly through the shameful method of copying the functions into the project directory. I have been a fan of the idea of personal R packages for a while, but it always seemed like A Project That I Should Do Someday and someday never came. Until…

Etsy has an amazing week called “hack week” where we all get the opportunity to work on fun projects instead of our regular jobs. I sat down yesterday as part of Etsy’s hack week and decided “I am finally going to make that package I keep saying I am going to make.” It took me such little time that I was hit with that familiar feeling of the joy of optimization combined with the regret of past inefficiencies (joygret?). I wish I could go back in time and create the package the first moment I thought about it, and then use all the saved time to watch cat videos because that really would have been more productive.

This tutorial is not about making a beautiful, perfect R package. This tutorial is about creating a bare-minimum R package so that you don’t have to keep thinking to yourself, “I really should just make an R package with these functions so I don’t have to keep copy/pasting them like a goddamn luddite.” Seriously, it doesn’t have to be about sharing your code (although that is an added benefit!). It is about saving yourself time. (n.b. this is my attitude about all reproducibility.)

A reminder that well organized functions, like documentation, can be a benefit to its creator as well as others.

Organization: It’s not just for the benefit of others.

I try to not leave myself cryptic or half-written notes anymore. 😉

rvest: easy web scraping with R

Filed under: Programming,R,Web Scrapers — Patrick Durusau @ 3:18 pm

rvest: easy web scraping with R

rvest is new package that makes it easy to scrape (or harvest) data from html web pages, by libraries like beautiful soup. It is designed to work with magrittr so that you can express complex operations as elegant pipelines composed of simple, easily understood pieces.

Great overview of rvest and its use for web scraping in R.

Axiom: You will have web scraping with you always. 😉 Not only because we are lazy, but disorderly to boot.

At CRAN: http://cran.r-project.org/web/packages/rvest/index.html (Author: Hadley Wickham)

November 6, 2014

Introducing Revolution R Open and Revolution R Plus

Filed under: Programming,R — Patrick Durusau @ 3:45 pm

Introducing Revolution R Open and Revolution R Plus by David Smith.

From the post:

For the past 7 years, Revolution Analytics has been the leading provider of R-based software and services to companies around the globe. Today, we're excited to announce a new, enhanced R distribution for everyone: Revolution R Open.

Revolution R Open is a downstream distribution of R from the R Foundation for Statistical Computing. It's built on the R 3.1.1 language engine, so it's 100% compatible with any scripts, packages or applications that work with R 3.1.1. It also comes with enhancements to improve your R experience, focused on performance and reproducibility: 

  • Revolution R Open is linked with the Intel Math Kernel Libraries (MKL). These replace the standard R BLAS/LAPACK libraries to improve the performance of R, especially on multi-core hardware. You don't need to modify your R code to take advantage of the performance improvements.
  • Revolution R Open comes with the Reproducible R Toolkit. The default CRAN repository is a static snapshot of CRAN (taken on October 1). You can always access newer R packages with the checkpoint package, which comes pre-installed. These changes make it easier to share R code with other R users, confident that they will get the same results as you did when you wrote the code.

Today we are also introducing MRAN, a new website where you can find information about R, Revolution R Open, and R Packages. MRAN includes tools to explore R Packages and R Task Views, making it easy to find packages to extend R's capabilities. MRAN is updated daily.

Revolution R Open is available for download now. Visit mran.revolutionanalytics.com/download for binaries for Windows, Mac, Ubuntu, CentOS/Red Hat Linux and (of course) the GPLv2 source distribution.

With the new Revolution R Plus program, Revolution Analytics is offering technical support and open-source assurance for Revolution R Open and several other open source projects from Revolution Analytics (including DeployR Open, ParallelR and RHadoop). If you are interested in subscribing, you can find more information at www.revolutionanalytics.com/plus . And don't forget that big-data R capabilities are still available in Revolution R Enterprise.

We hope you enjoy using Revolution R Open, and that your workplace will be confident adopting R with the backing of technical support and open source assurance of Revolution R Plus. Let us know what you think in the comments! 

Apologies for missing such important R news!

I have downloaded R Open (Ubuntu 64-bit) and as soon as I exit a conference call, will install. (I try not to multi-task anytime I am root or even sudo.)

November 4, 2014

Tessera

Filed under: BigData,Hadoop,R,RHIPE,Tessera — Patrick Durusau @ 7:20 pm

Tessera

From the webpage:

The Tessera computational environment is powered by a statistical approach, Divide and Recombine. At the front end, the analyst programs in R. At the back end is a distributed parallel computational environment such as Hadoop. In between are three Tessera packages: datadr, Trelliscope, and RHIPE. These packages enable the data scientist to communicate with the back end with simple R commands.

Divide and Recombine (D&R)

Tessera is powered by Divide and Recombine. In D&R, we seek meaningful ways to divide the data into subsets, apply statistical methods to each subset independently, and recombine the results of those computations in a statistically valid way. This enables us to use the existing vast library of methods available in R – no need to write scalable versions

DATADR

The datadr R package provides a simple interface to D&R operations. The interface is back end agnostic, so that as new distributed computing technology comes along, datadr will be able to harness it. Datadr currently supports in-memory, local disk / multicore, and Hadoop back ends, with experimental support for Apache Spark. Regardless of the back end, coding is done entirely in R and data is represented as R objects.

TRELLISCOPE

Trelliscope is a D&R visualization tool based on Trellis Display that enables scalable, flexible, detailed visualization of data. Trellis Display has repeatedly proven itself as an effective approach to visualizing complex data. Trelliscope, backed by datadr, scales Trellis Display, allowing the analyst to break potentially very large data sets into many subsets, apply a visualization method to each subset, and then interactively sample, sort, and filter the panels of the display on various quantities of interest.
trelliscope

RHIPE

RHIPE is the R and Hadoop Integrated Programming Environment. RHIPE allows an analyst to run Hadoop MapReduce jobs wholly from within R. RHIPE is used by datadr when the back end for datadr is Hadoop. You can also perform D&R operations directly through RHIPE , although in this case you are programming at a lower level.

Quite an impressive package for R and “big data.”

I first saw this in a tweet by Christophe Lalanne.

October 24, 2014

analyze survey data for free

Filed under: Public Data,R,Survey — Patrick Durusau @ 10:08 am

Anthony Damico has “unlocked” a number of public survey data sets with blog posts that detail how to analyze those sets with R.

Forty-six (46) data set are covered so far:

unlocked public-use data sets

An impressive donation of value to R and public data and an example that merits emulation! Pass this along.

I first saw this in a tweet by Sharon Machlis.

analyze the public libraries survey (pls) with r

Filed under: Library,R — Patrick Durusau @ 9:55 am

analyze the public libraries survey (pls) with r by Anthony Damico.

From the post:

each and every year, the institute of museum and library services coaxes librarians around the country to put down their handheld “shhhh…” sign and fill out a detailed online questionnaire about their central library, branch, even bookmobile. the public libraries survey (pls) is actually a census: nearly every public library in the nation responds annually. that microdata is waiting for you to check it out, no membership required. the american library association estimates well over one hundred thousand libraries in the country, but less than twenty thousand outlets are within the sample universe of this survey since most libraries in the nation are enveloped by some sort of school system. a census of only the libraries that are open to the general public, the pls typically hits response rates of 98% from the 50 states and dc. check that out.

A great way to practice your R skills!

Not to mention generating analysis to support your local library.

October 23, 2014

R Programming for Beginners

Filed under: Programming,R — Patrick Durusau @ 10:03 am

R Programming for Beginners by LearnR.

Short videos on R programming, running from a low of two (2) minutes (the intro) up to eight minutes (the debugging session) but generally three (3) to five (5) minutes in length. I have cleaned up the YouTube listing to make it suitable for sharing and/or incorporation into other R resources.

Enjoy!

October 14, 2014

RNeo4j: Neo4j graph database combined with R statistical programming language

Filed under: Graphs,Neo4j,R — Patrick Durusau @ 2:46 pm

From the description:

RNeo4j combines the power of a Neo4j graph database with the R statistical programming language to easily build predictive models based on connected data. From calculating the probability of friends of friends connections to plotting an adjacency heat map based on graph analytics, the RNeo4j package allows for easy interaction with a Neo4j graph database.

Nicole is the author of the RNeo4j R package. Don’t be dismayed by the “What is a Graph” and “What is R” in the presentation outline. Mercifully only three minutes followed by a rocking live coding demonstration of the package!

Beyond Neo4j and R, use this webinar as a standard for the useful content that should appear in a webinar!

RNeo4j at Github.

September 24, 2014

In-depth introduction to machine learning in 15 hours of expert videos

Filed under: Machine Learning,R — Patrick Durusau @ 9:39 am

In-depth introduction to machine learning in 15 hours of expert videos by Kevin Markham.

From the post:

In January 2014, Stanford University professors Trevor Hastie and Rob Tibshirani (authors of the legendary Elements of Statistical Learning textbook) taught an online course based on their newest textbook, An Introduction to Statistical Learning with Applications in R (ISLR). I found it to be an excellent course in statistical learning (also known as “machine learning”), largely due to the high quality of both the textbook and the video lectures. And as an R user, it was extremely helpful that they included R code to demonstrate most of the techniques described in the book.

If you are new to machine learning (and even if you are not an R user), I highly recommend reading ISLR from cover-to-cover to gain both a theoretical and practical understanding of many important methods for regression and classification. It is available as a free PDF download from the authors’ website.

Kevin provides links to the slides for each chapter and the videos with timings, so you can fit them in as time allows.

Enjoy!

I first saw this in a tweet by Christophe Lalanne.

September 8, 2014

Visualizing Website Pathing With Network Graphs

Filed under: Graphs,Networks,R,Visualization — Patrick Durusau @ 6:54 pm

Visualizing Website Pathing With Network Graphs by Randy Zwitch.

From the post:

Last week, version 1.4 of RSiteCatalyst was released, and now it’s possible to get site pathing information directly within R. Now, it’s easy to create impressive looking network graphs from your Adobe Analytics data using RSiteCatalyst and d3Network. In this blog post, I will cover simple and force-directed network graphs, which show the pairwise representation between pages. In a follow-up blog post, I will show how to visualize longer paths using Sankey diagrams, also from the d3Network package.

Great technical details and examples but also worth the read for:

I’m not going to lie, all three of these diagrams are hard to interpret. Like wordclouds, network graphs can often be visually interesting, yet difficult to ascertain any concrete information. Network graphs also have the tendency to reinforce what you already know (you or someone you know designed your website, you should already have a feel for its structure!).

Randy does spot some patterns but working out what those patterns “mean” remain for further investigation.

Hairball graph visualizations can be a starting point for the hard work that extracts actionable intelligence.

August 25, 2014

USDA Nutrient DB (R Data Package)

Filed under: Data,R — Patrick Durusau @ 6:30 pm

USDA Nutrient DB (R Data Package) by Hadley Wickham.

From the webpage:

This package contains all data from the USDA National Nutrient Database, “Composition of Foods Raw, Processed, Prepared”, release 26.

From the data documentation:

The USDA National Nutrient Database for Standard Reference (SR) is the major source of food composition data in the United States. It provides the foundation for most food composition databases in the public and private sectors. As information is updated, new versions of the database are released. This version, Release 26 (SR26), contains data on 8,463 food items and up to 150 food components. It replaces SR25 issued in September 2012.

Updated data have been published electronically on the USDA Nutrient Data Laboratory (NDL) web site since 1992. SR26 includes composition data for all the food groups and nutrients published in the 21 volumes of “Agriculture Handbook 8” (U.S. Department of Agriculture 1976-92), and its four supplements (U.S. Department of Agriculture 1990-93), which superseded the 1963 edition (Watt and Merrill, 1963). SR26 supersedes all previous releases, including the printed versions, in the event of any differences.

The ingredient calculators at most recipe sites are wimpy by comparison. If you really are interested in what you are ingesting on a day to day basis, take a walk through this data set.

Some other links of interest:

Release 26 Web Interface

Release 26 page

Correlating this data with online shopping options could be quite useful.

August 15, 2014

John Chambers: Interfaces, Efficiency and Big Data

Filed under: BigData,Interface Research/Design,R — Patrick Durusau @ 10:07 am

John Chambers: Interfaces, Efficiency and Big Data

From the description:

At useR! 2014, John Chambers was generous enough to provide us with insight into the very early stages of user-centric interactive data exploration. He explains, step by step, how his insight to provide an interface into algorithms, putting the user first has placed us on the fruitful path which analysts, statisticians, and data scientists enjoy to this day. In his talk, John Chambers also does a fantastic job of highlighting a number of active projects, new and vibrant in the R ecosystem, which are helping to continue this legacy of “a software interface into the best algorithms.” The future is bright, and new and dynamic ideas are building off these thoughtful, well measured, solid foundations of the past.

To understand why this past is so important, I’d like to provide a brief view of the historical context that underpins these breakthroughs. In 1976, John Chambers was concerned with making software supported interactive numerical analysis a reality. Let’s talk about what other advances were happening in 1976 in the field of software and computing:

You should read the rest of the back story before watching the keynote by Chambers.

Will your next interface build upon the collective experience with interfaces or will it repeat some earlier experience?

I first saw this in John Chambers: Interfaces, Efficiency and Big Data by David Smith.

August 11, 2014

How to Transition from Excel to R

Filed under: Excel,R — Patrick Durusau @ 2:30 pm

How to Transition from Excel to R: An Intro to R for Microsoft Excel Users by Tony Ojeda.

From the post:

In today’s increasingly data-driven world, business people are constantly talking about how they want more powerful and flexible analytical tools, but are usually intimidated by the programming knowledge these tools require and the learning curve they must overcome just to be able to reproduce what they already know how to do in the programs they’ve become accustomed to using. For most business people, the go-to tool for doing anything analytical is Microsoft Excel.

If you’re an Excel user and you’re scared of diving into R, you’re in luck. I’m here to slay those fears! With this post, I’ll provide you with the resources and examples you need to get up to speed doing some of the basic things you’re used to doing in Excel in R. I’m going to spare you the countless hours I spent researching how to do this stuff when I first started so that you feel comfortable enough to continue using R and learning about its more sophisticated capabilities.

Excited? Let’s jump in!

Not a complete transition but enough to give you a taste of R that will leave you wanting more.

You will likely find R is better for some tasks and that you prefer Excel for others. Why not have both in your toolkit?

August 10, 2014

multiMiR R package and database:…

Filed under: Bioinformatics,Biomedical,MySQL,R — Patrick Durusau @ 7:37 pm

The multiMiR R package and database: integration of microRNA–target interactions along with their disease and drug associations by Yuanbin Ru, et al. ( Nucl. Acids Res. (2014) doi: 10.1093/nar/gku631)

Abstract:

microRNAs (miRNAs) regulate expression by promoting degradation or repressing translation of target transcripts. miRNA target sites have been catalogued in databases based on experimental validation and computational prediction using various algorithms. Several online resources provide collections of multiple databases but need to be imported into other software, such as R, for processing, tabulation, graphing and computation. Currently available miRNA target site packages in R are limited in the number of databases, types of databases and flexibility. We present multiMiR, a new miRNA–target interaction R package and database, which includes several novel features not available in existing R packages: (i) compilation of nearly 50 million records in human and mouse from 14 different databases, more than any other collection; (ii) expansion of databases to those based on disease annotation and drug microRNAresponse, in addition to many experimental and computational databases; and (iii) user-defined cutoffs for predicted binding strength to provide the most confident selection. Case studies are reported on various biomedical applications including mouse models of alcohol consumption, studies of chronic obstructive pulmonary disease in human subjects, and human cell line models of bladder cancer metastasis. We also demonstrate how multiMiR was used to generate testable hypotheses that were pursued experimentally.

Amazing what you can do with R and a MySQL database!

The authors briefly describe their “cleaning” process for the consolidation of these databases on page 2 but then note on page 4:

For many of the databases, the links are available. However, in Supplementary Table S2 we have listed the databases where links may be broken due to outdated identifiers in those databases. We also listed the databases that do not have the option to search by miR NA-gene pairs.

Perhaps due to editing standards (available for free lance work) I have allergy to terms like “many,” especially when it is possible to enumerate the “many.”

In this particular case, you have to download and consult Supplementary Table S2, which reads:
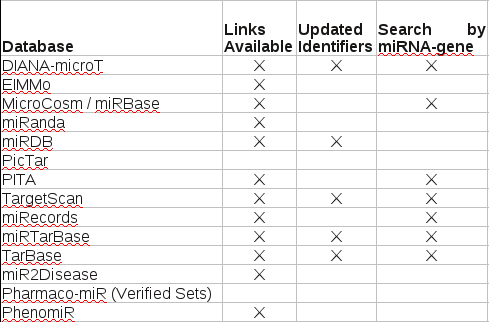
S2

The explanation for this table reads:

For each database, the columns indicate whether external links are available to include as part of multiMiR, whether those databases use identifiers that are updated and whether the links are based on miRNA-gene pairs. For those database that do not have updated identifiers, some links may be broken. For the other databases, where you can only search by miRNA or gene but not pairs, the links are provided by gene, except for ElMMo which is by miRNA because of its database structure.

Counting I see ten (10) databases with a blank under “Undated Identifiers” or Search by miRNA-gene,” or both.

I guess ten (10) out of fourteen (14) qualifies as “many,” but saying seventy-one percent (71%) of the databases in this study lack either “Updated Identifiers,” “Search by miRNA-gene,” or both, would have been more informative.

Potential records with these issues? EIMMo, version 4 has human (50M) and mouse (15M), MicroCosm / miRBase human (879054), and miRanda (assuming human, Good mirSVR score, Conserved miRNA), 1097069. For the rest you can consult Supplemental Table 1, which lists URLs for the databases and dates of access, but where multiple human options are available, not which one(s) were selected.

The number of records for each database that may have these problems also merits mention in the description of the data.

I can’t comment on the usefulness of this R package for exploring the data but the condition of the data it explores needs more prominent mention.
August 8, 2014

ROpenSci News – August 2014

Filed under: R,Topic Maps — Patrick Durusau @ 3:23 pm

Community conversations and a new package for full text by Scott Chamberlain and Karthik Ram.

ROpenSci announces they are reopening their public Google list.

We encourage you to sign up and post ideas for packages, solicit feedback on new ideas, and most importantly find other collaborators who share your domain interests. We also plan to use the list to solicit feedback on some of the bigger rOpenSci projects early on in the development phase allowing our community to shape future direction and also collaborate where appropriate.

Among the work that is underway:

Through time we have been attempting to unify our R packages that interact with individual data sources into single packages that handle one use case. For example, spocc aims to create a single entry point to many different sources (currently 6) of species occurrence data, including GBIF, AntWeb, and others.

Another area we hope to simplify is acquiring text data, specifically text from scholarly journal articles. We call this R package fulltext. The goal of fulltext is to allow a single user interface to searching for and retrieving full text data from scholarly journal articles. Rather than learning a different interface for each data source, you can learn one interface, making your work easier. fulltext will likely only get you data, and make it easy to browse that data, and use it downstream for manipulation, analysis, and vizualization.

We currently have R packages for a number of sources of scholarly article text, including for Public Library of Science (PLOS), Biomed Central (BMC), and eLife – which could all be included in fulltext. We can add more sources as they become available.

Instead of us rOpenSci core members planning out the whole package, we'd love to get the community involved at the beginning.

The “individual data sources into single packages” sounds particularly ripe for enhancement with topic map based ideas.

Not a plea for topic map syntax or modeling, although either would make nice output options. The critical idea being to identify central subjects with key/value pairs to enable robust identification of subjects by later users.

Surface tokens with unexpressed contexts set hard boundaries to the usefulness and accuracy of search results. If we capture what is known to identity surface tokens, we enrich our world and the world of others.

July 22, 2014

Interactive Documents with R

Filed under: Interface Research/Design,R — Patrick Durusau @ 3:55 pm

Interactive Documents with R by Ramnath Vaidyanathan.

From the webpage:

The main goal of this tutorial is to provide a comprehensive overview of the workflow required to create, customize and share interactive web-friendly documents from R. We will cover a range of topics from how to create interactive visualizations and dashboards, to web pages and applications, straight from R. At the end of this tutorial, attendees will be able to apply these learnings to turn their own analyses and reports into interactive, web-friendly content.

Ramnath gave this tutorial at UseR2014. The slides have now been posted at: http://ramnathv.github.io/user2014-idocs-slides

The tutorial is listed as six (6) separate tutorials:

  1. Interactive Documents
  2. Slidify
  3. Frameworks
  4. Layouts
  5. Widgets
  6. How Slidify Works

I am always impressed by useful interactive web pages. Leaving aside the one that jump, pop and whizz with no discernible purpose, interactive documents add value to their content for readers.

Enjoy!

I first saw this in a tweet by Gregory Piatetsky.

July 8, 2014

Introduction to R for Life Scientists:…

Filed under: R,Science — Patrick Durusau @ 12:42 pm

Introduction to R for Life Scientists: Course Materials by Stephen Turner.

From the post:

Last week I taught a three-hour introduction to R workshop for life scientists at UVA’s Health Sciences Library.

[image omitted]

I broke the workshop into three sections:

In the first half hour or so I presented slides giving an overview of R and why R is so awesome. During this session I emphasized reproducible research and gave a demonstration of using knitr + rmarkdown in RStudio to produce a PDF that can easily be recompiled when data updates.

In the second (longest) section, participants had their laptops out with RStudio open coding along with me as I gave an introduction to R data types, functions, getting help, data frames, subsetting, and plotting. Participants were challenged with an exercise requiring them to create a scatter plot using a subset of the built-in mtcars dataset.

We concluded with an analysis of RNA-seq data using the DESeq2 package. We started with a count matrix and a metadata file (the modENCODE pasilla knockout data packaged with DESeq2), imported the data into a DESeqDataSet object, ran the DESeq pipeline, extracted results, and did some basic visualization (MA-plots, PCA, volcano plots, etc). A future day-long course will cover RNA-seq in more detail (intro UNIX, alignment, & quantitation in the morning; intro R, QC, and differential expression analysis in the afternoon).

Pass along to any life scientists you meet and/or review yourself to pickup life science terminology and expectations.

I first saw this in a tweet by Christophe Lalanne.

July 6, 2014

Data Visualization Contest @ use!R 2014

Filed under: Graphics,R,Visualization — Patrick Durusau @ 4:34 pm

Data Visualization Contest @ use!R 2014

From the webpage:

The aim of the Data Visualization Contest @ use!R 2014 is to show the potential of R for analysis and visualization of large and complex data sets.

Submissions are welcomed in these two broad areas:

  • Track 1: Schools matter: the importance of school factors in explaining academic performance.
  • Track 2: Inequalities in academic achievement.

Really impressive visualizations but I would treat some of the conclusions with a great deal of caution.

One participant alleges that the absence of computers makes math scores fall. I am assuming that is literally what the data says but that doesn’t establish a causal relationship.

I say that because all of the architects of atomic bomb, to say nothing of the digital computer, learned mathematics without the aid of computers. Yes?

July 3, 2014

statsTeachR

Filed under: R,Statistics — Patrick Durusau @ 2:35 pm

statsTeachR

From the webpage:

statsTeachR is an open-access, online repository of modular lesson plans, a.k.a. “modules”, for teaching statistics using R at the undergraduate and graduate level. Each module focuses on teaching a specific statistical concept. The modules range from introductory lessons in statistics and statistical computing to more advanced topics in statistics and biostatistics. We are developing plans to create a peer-review process for some of the modules submitted to statsTeachR.

There are twenty-five (25) modules now and I suspect they would welcome you help in contributing more.

The path to a more numerically and specifically statistically savvy public is to teach people to use statistics. So when numbers “don’t sound right,” they will have the confident to speak up.

Enjoy!

I first saw this in a tweet by Karthik Ram.

rplos Tutorial

Filed under: R,Science,Text Mining — Patrick Durusau @ 2:14 pm

rplos Tutorial

From the webpage:

The rplos package interacts with the API services of PLoS (Public Library of Science) Journals. In order to use rplos, you need to obtain your own key to their API services. Instruction for obtaining and installing keys so they load automatically when you launch R are on our GitHub Wiki page Installation and use of API keys.

This tutorial will go through three use cases to demonstrate the kinds
of things possible in rplos.

  • Search across PLoS papers in various sections of papers
  • Search for terms and visualize results as a histogram OR as a plot through time
  • Text mining of scientific literature

Another source of grist for your topic map mill!

July 2, 2014

circlize implements and enhances circular visualization in R

Filed under: Bioinformatics,Genomics,Multidimensional,R,Visualization — Patrick Durusau @ 6:03 pm

circlize implements and enhances circular visualization in R by Zuguang Gu, et al.

Abstract:

Summary: Circular layout is an efficient way for the visualization of huge amounts of genomic information. Here we present the circlize package, which provides an implementation of circular layout generation in R as well as an enhancement of available software. The flexibility of this package is based on the usage of low-level graphics functions such that self-defined high-level graphics can be easily implemented by users for specific purposes. Together with the seamless connection between the powerful computational and visual environment in R, circlize gives users more convenience and freedom to design figures for better understanding genomic patterns behind multi-dimensional data.

Availability and implementation: circlize is available at the Comprehensive R Archive Network (CRAN): http://cran.r-project.org/web/packages/circlize/

The article is behind a paywall but fortunately, the R code is not!

I suspect I know which one will get more “hits.” 😉

Useful for exploring multidimensional data as well as presenting multidimensional data encoded using a topic map.

Sometimes displaying information as nodes and edges isn’t the best display.

Remember the map of Napoleon’s invasion of Russia?

napoleon - russia

You could display the same information with nodes (topics) and associations (edges) but it would not be nearly as compelling.

Although, you could make the same map a “cover” for the topics (read people) associated with segments of the map, enabling a reader to take in the whole map and then drill down to the detail for any location or individual.

It would still be a topic map, even though its primary rendering would not be as nodes and edges.

July 1, 2014

Piketty in R markdown

Filed under: Ecoinformatics,Open Data,R — Patrick Durusau @ 11:56 am

Piketty in R markdown – we need some help from the crowd by Jeff Leek.

From the post:

Thomas Piketty’s book Capital in the 21st Century was a surprise best seller and the subject of intense scrutiny. A few weeks ago the Financial Times claimed that the analysis was riddled with errors, leading to a firestorm of discussion. A few days ago the London School of economics posted a similar call to make the data open and machine readable saying.

None of this data is explicitly open for everyone to reuse, clearly licenced and in machine-readable formats.

A few friends of Simply Stats had started on a project to translate his work from the excel files where the original analysis resides into R. The people that helped were Alyssa Frazee, Aaron Fisher, Bruce Swihart, Abhinav Nellore, Hector Corrada Bravo, John Muschelli, and me. We haven’t finished translating all chapters, so we are asking anyone who is interested to help contribute to translating the book’s technical appendices into R markdown documents. If you are interested, please send pull requests to the gh-pages branch of this Github repo.

Hmmm, debate to be conducted based on known data sets?

That sounds like a radical departure from most public debates, to say nothing of debates in politics.

Dangerous because the general public may come to expect news reports, government budgets, documents, etc. to be accompanied by machine readable data files.

Even more dangerous if data files are compared to other data files, for consistency, etc.

No time to start like the present. Think about helping with the Piketty materials.

You may be helping to start a trend.

June 19, 2014

RTh:…

Filed under: GPU,Parallel Programming,R — Patrick Durusau @ 6:37 pm

Rth: a Flexible Parallel Computation Package for R by Norm Matloff.

From the post:

The key feature of Rth is in the word flexible in the title of this post, which refers to the fact that Rth can be used on two different kinds of platforms for parallel computation: multicore systems and Graphics Processing Units (GPUs). You all know about the former–it’s hard to buy a PC these days that is not at least dual-core–and many of you know about the latter. If your PC or laptop has a somewhat high-end graphics card, this enables extremely fast computation on certain kinds of problems. So, whether have, say, a quad-core PC or a good NVIDIA graphics card, you can run Rth for fast computation, again for certain types of applications. And both multicore and GPUs are available in the Amazon EC2 cloud service.

Rth Quick Start

Our Rth home page tells you the GitHub site at which you can obtain the package, and how to install it. (We plan to place it on CRAN later on.) Usage is simple, as in this example:

Rth is an example of what I call Pretty Good Parallelism (an allusion to Pretty Good Privacy). For certain applications it can get you good speedup on two different kinds of common platforms (multicore, GPU). Like most parallel computation systems, it works best on very regular, “embarrassingly parallel” problems. For very irregular, complex apps, one may need to resort to very detailed C code to get a good speedup.

Rth has not been tested on Windows so I am sure the authors would appreciate reports on your use of Rth with Windows.

Contributions of new Rth functions are solicited. At least if you don’t mind making parallel processing easier for everyone. 😉

I first saw this in a tweet by Christopher Lalanne.

June 10, 2014

An Introduction to Statistical Learning

Filed under: R,Statistical Learning — Patrick Durusau @ 2:51 pm

An Introduction to Statistical Learning with Applications in R by Gareth James, Daniela Witten, Trevor Hastie and Robert Tibshirani.

From the webpage:

This book provides an introduction to statistical learning methods. It is aimed for upper level undergraduate students, masters students and Ph.D. students in the non-mathematical sciences. The book also contains a number of R labs with detailed explanations on how to implement the various methods in real life settings, and should be a valuable resource for a practicing data scientist.

R code, data sets, the full text in pdf. What more could you want? 😉

The text is published by Springer, who is allowing the full text to be posted online.

Reward good behavior by publishers. Recommend this text to your librarian for acquisition.

I first saw this in a tweet by One R Tip a Day.

June 3, 2014

Google Spreadsheets -> R

Filed under: R,Spreadsheets — Patrick Durusau @ 2:01 pm

Reading data from the new version of Google Spreadsheets by Andrie de Vries.

From the post:

Spreadsheets remain an important way for people to share and work with data. Among other providers, Google has provided the ability to create online spreadsheets and other documents.

Back in 2009, David Smith posted a blog entry on how to use R, and specifically the XML package to import data from a Google Spreadsheet. Once you marked your Google sheet as exported, it took about two lines of code to import your data into a data frame.

But things have changed

More recently, it seems that Google changed and improved the Spreadsheet product. Google's own overview of changes lists some changes, but one change isn't on this list. In the previous version, it was possible to publish a sheet as a csv file. In the new version it is still possible to publish a sheet, but the ability to do this as csv is no longer there.

On April 5, 2014 somebody asked a question on StackOverflow on how to deal with this.

Because I had the same need to import data from a spreadsheet shared in our team, I set out to find and answer.

Deep problems require a lot of time to solve but you feel productive after having solved them.

Solving shallow problems that eat up nearly as much time as deep ones, not so much.

Posts like this one can save you from re-inventing a solution or scouring the web for one, if not both.

File this under Google spreadsheets, extraction.

May 31, 2014

Rneo4j

Filed under: Graphs,Neo4j,R — Patrick Durusau @ 9:37 am

Nicole White has authored an R driver for Neo4j known as Rneo4j.

To tempt one or more people into trying Rneo4j, two posts have appeared:

Demo of Rneo4j Part 1: Building a Database

Covers installation of the necessary R packages and the creation of a Twitter database for tweets containing “neo4j.”

Demo of Rneo4j Part 2: Plotting and Analysis

Uses Cypher results as an R data frame, which opens the data up to the full range of R analysis and display capabilities.

R users will find this a useful introduction to Neo4j and Neo4j users will be introduced to a new level of post-graph creation possibilities.

May 30, 2014

…Setting Up an R-Hadoop System

Filed under: Hadoop,Hadoop YARN,R — Patrick Durusau @ 2:30 pm

Step-by-Step Guide to Setting Up an R-Hadoop System by Yanchang Zhao.

From the post:

This is a step-by-step guide to setting up an R-Hadoop system. I have tested it both on a single computer and on a cluster of computers. Note that this process is for Mac OS X and some steps or settings might be different for Windows or Ubuntu.

What looks like an excellent post on installing R-Hadaoop. It is written for the Mac OS and I have yet to confirm its installation on either Windows or Ubuntu.

I won’t be installing this on Windows so if you can confirm any needed changes and post them I would appreciate it.

I first saw this in a tweet by Gregory Piatetsky.

May 18, 2014

12 Free (as in beer) Data Mining Books

12 Free (as in beer) Data Mining Books by Chris Leonard.

While all of these volumes could be shelved under “data mining” in a bookstore, I would break them out into smaller categories:

  • Bayesian Analysis/Methods
  • Data Mining
  • Data Science
  • Machine Learning
  • R
  • Statistical Learning

Didn’t want you to skip over Chris’ post because it was “just about data mining.” 😉

Check your hard drive to see what you are missing.

I first saw this in a tweet by Carl Anderson.

« Newer PostsOlder Posts »

Powered by WordPress