Another Word For It Patrick Durusau on Topic Maps and Semantic Diversity

June 24, 2014

DAMEWARE:…

Filed under: Astroinformatics,BigData,Data Mining — Patrick Durusau @ 6:16 pm

DAMEWARE: A web cyberinfrastructure for astrophysical data mining by Massimo Brescia, et al.

Abstract:

Astronomy is undergoing through a methodological revolution triggered by an unprecedented wealth of complex and accurate data. The new panchromatic, synoptic sky surveys require advanced tools for discovering patterns and trends hidden behind data which are both complex and of high dimensionality. We present DAMEWARE (DAta Mining & Exploration Web Application REsource): a general purpose, web-based, distributed data mining environment developed for the exploration of large datasets, and finely tuned for astronomical applications. By means of graphical user interfaces, it allows the user to perform classification, regression or clustering tasks with machine learning methods. Salient features of DAMEWARE include its capability to work on large datasets with minimal human intervention, and to deal with a wide variety of real problems such as the classification of globular clusters in the galaxy NGC1399, the evaluation of photometric redshifts and, finally, the identification of candidate Active Galactic Nuclei in multiband photometric surveys. In all these applications, DAMEWARE allowed to achieve better results than those attained with more traditional methods. With the aim of providing potential users with all needed information, in this paper we briefly describe the technological background of DAMEWARE, give a short introduction to some relevant aspects of data mining, followed by a summary of some science cases and, finally, we provide a detailed description of a template use case.

Despite the progress made in the creation of DAMEWARE, the authors conclude in part:

The harder problem for the future will be heterogeneity of platforms, data and applications, rather than simply the scale of the deployed resources. The goal should be to allow scientists to explore the data easily, with sufficient processing power for any desired algorithm to efficiently process it. Most existing ML methods scale badly with both increasing number of records and/or of dimensionality (i.e., input variables or features). In other words, the very richness of astronomical data sets makes them difficult to analyze….

The size of data sets is an issue, but heterogeneity issues with platforms, data and applications are several orders of magnitude more complex.

I remain curious when that is going to dawn on the the average “big data” advocate.
June 23, 2014

Towards building a Crowd-Sourced Sky Map

Filed under: Astroinformatics — Patrick Durusau @ 7:20 pm

Towards building a Crowd-Sourced Sky Map by Dustin Lang, David W. Hogg, and, Bernhard Scholkopf.

Abstract:

We describe a system that builds a high dynamic-range and wide-angle image of the night sky by combining a large set of input images. The method makes use of pixel-rank information in the individual input images to improve a “consensus” pixel rank in the combined image. Because it only makes use of ranks and the complexity of the algorithm is linear in the number of images, the method is useful for large sets of uncalibrated images that might have undergone unknown non-linear tone mapping transformations for visualization or aesthetic reasons. We apply the method to images of the night sky (of unknown provenance) discovered on the Web. The method permits discovery of astronomical objects or features that are not visible in any of the input images taken individually. More importantly, however, it permits scientific exploitation of a huge source of astronomical images that would not be available to astronomical research without our automatic system.

If you have any astronomical photographs, you can contribute to a more complete knowledge of the night sky.

Scientific instruments moved beyond the reach of the citizen scientist in the late 19th/early 20th century and now data from instruments large and small are returning to the citizen scientist, whose laboratory is a local or cloud-based computer.

Enjoy!

May 26, 2014

Self-Inflicted Wounds in Science (Astronomy)

Filed under: Astroinformatics,Science — Patrick Durusau @ 2:52 pm

The Major Blunders That Held Back Progress in Modern Astronomy

From the post:

Mark Twain once said, “It ain’t what you don’t know that gets you into trouble. It’s what you know for sure that just ain’t so. ”

The history of science provides many entertaining examples. So today, Abraham Loeb at Harvard University in Cambridge, scour the history books for examples from the world of astronomy.

It turns out that the history of astronomy is littered with ideas that once seemed incontrovertibly right and yet later proved to be bizarrely wrong. Not least among these are the ancient ideas that the Earth is flat and at the centre of the universe.

But there is no shortage of others from the modern era. “A very common flaw of astronomers is to believe that they know the truth even when data is scarce,” says Loeb.

To make his point, Loeb has compiled a list of ten modern examples of ideas that were not only wrong but also significantly held back progress in astronomy “causing unnecessary delays in finding the truth”.

Highly amusing account of how “beliefs” in science can delay scientific progress. Three in this essay with pointers to the other seven (7).

When someone says: “This is science/scientific…,” they are claiming to have followed the practices of scientific “rhetoric,” that is how to construct a scientific argument.

Whether a scientific argument is correct or not, is an entirely separate question.

May 6, 2014

The Strange Naming Conventions of Astronomy

Filed under: Astroinformatics,Names — Patrick Durusau @ 7:31 pm

The Strange Naming Conventions of Astronomy by Ben Montet.

From the post:

If you’ve spent time around the astronomical literature, you’ve probably heard at least one term that made you wonder “why did astronomers do that?” G-type stars, early/late type galaxies, magnitudes, population I/II stars, sodium “D” lines, and the various types of supernovae are all members of the large, proud family of astronomy terms that are seemingly backwards, unrelated to the underlying physics, or annoyingly complicated. While it may seem surprising now, the origins of these terms were logical at the time of their creation. Today, let’s look at the history of a couple of these terms, to figure out why astronomers did that.

Ben covers a couple of odd naming cases but has left thousands of others as an exercise for the reader!

Names that are used in astronomical literature for centuries.

The richness of names isn’t going away so long as we keep records of our past. Whatever style of names, such as “cool URIs,” may come or go out of fashion.

March 30, 2014

The Theoretical Astrophysical Observatory:…

Filed under: Astroinformatics,Funding,Government,Open Data — Patrick Durusau @ 7:05 pm

The Theoretical Astrophysical Observatory: Cloud-Based Mock Galaxy Catalogues by Maksym Bernyk, et al.

Abstract:

We introduce the Theoretical Astrophysical Observatory (TAO), an online virtual laboratory that houses mock observations of galaxy survey data. Such mocks have become an integral part of the modern analysis pipeline. However, building them requires an expert knowledge of galaxy modelling and simulation techniques, significant investment in software development, and access to high performance computing. These requirements make it difficult for a small research team or individual to quickly build a mock catalogue suited to their needs. To address this TAO offers access to multiple cosmological simulations and semi-analytic galaxy formation models from an intuitive and clean web interface. Results can be funnelled through science modules and sent to a dedicated supercomputer for further processing and manipulation. These modules include the ability to (1) construct custom observer light-cones from the simulation data cubes; (2) generate the stellar emission from star formation histories, apply dust extinction, and compute absolute and/or apparent magnitudes; and (3) produce mock images of the sky. All of TAO’s features can be accessed without any programming requirements. The modular nature of TAO opens it up for further expansion in the future.

The website: Theoretical Astrophysical Observatory.

While disciplines in the sciences and the humanities play access games with data and publications, the astronomy community continues to shame both of them.

Funders, both government and private should take a common approach: Open and unfettered access to data or no funding.

It’s just that simple.

If grantees object, they can try to function without funding.

March 24, 2014

Cosmology, Computers and the VisIVO package

Filed under: Astroinformatics,BigData — Patrick Durusau @ 7:58 pm

Cosmology, Computers and the VisIVO package by Bruce Berriman.

From the post:

vo

See Bruce’s post for details and resources on the VisIVO software package.

When some people talk about “big data,” they mean large amounts of repetitious log data. Big, but not complex.

Other “big data,” is not only larger, but also more complex. 😉

March 11, 2014

NASA’s Asteroid Grand Challenge Series

Filed under: Astroinformatics,Challenges — Patrick Durusau @ 6:10 pm

NASA’s Asteroid Grand Challenge Series

From the webpage:

Welcome to the Asteroid Grand Challenge Series sponsored by the NASA Tournament Lab! The Asteroid Grand Challenge Series will be comprised of a series of topcoder challenges to get more people from around the planet involved in finding all asteroid threats to human populations and figuring out what to do about them. In an increasingly connected world, NASA recognizes the value of the public as a partner in addressing some of the country’s most pressing challenges. Click here to learn more and participate in our debut challenge, Asteroid Data Hunter – launching 03/17/14!

From the details page:

The Asteroid Data Hunter challenge tasks competitors to develop significantly improved algorithms to identify asteroids in images from ground-based telescopes. The winning solution must increase the detection sensitivity, minimize the number of false positives, ignore imperfections in the data, and run effectively on all computers.

This is radically cool!

Lots of data, difficult problem, high stakes (ELE (extinction level event) prevention).

March 10, 2014

Hubble Source Catalog

Filed under: Astroinformatics,Data — Patrick Durusau @ 4:51 pm

Beta Version 0.3 of the Hubble Source Catalog

From the post:

The Hubble Source Catalog (HSC) is designed to optimize science from the Hubble Space Telescope by combining the tens of thousands of visit-based source lists in the Hubble Legacy Archive (HLA) into a single master catalog.

Search with Summary Form now (one row per match)
Search with Detailed Form now (one row per source)

Beta Version 0.3 of the HSC contains members of the WFPC2, ACS/WFC, WFC3/UVIS and WFC3/IR Source Extractor source lists in HLA version DR7.2 (data release 7.2) that are considered to be valid detections because they have flag values less than 5 (see more flag information).

The crossmatching process involves adjusting the relative astrometry of overlapping images so as to minimize positional offsets between closely aligned sources in different images. After correction, the astrometric residuals of crossmatched sources are significantly reduced, to typically less than 10 mas. In addition, the catalog includes source nondetections. The crossmatching algorithms and the properties of the initial (Beta 0.1) catalog are described in Budavari & Lubow (2012) .

if you need training with this data set, see: A Hubble Source Catalog (HSC) Walkthrough

February 26, 2014

715 New Worlds

Filed under: Astroinformatics,Data — Patrick Durusau @ 4:13 pm

NASA’s Kepler Mission Announces a Planet Bonanza, 715 New Worlds by Michele Johnson and J.D. Harrington.

From the post:

NASA’s Kepler mission announced Wednesday the discovery of 715 new planets. These newly-verified worlds orbit 305 stars, revealing multiple-planet systems much like our own solar system.

Nearly 95 percent of these planets are smaller than Neptune, which is almost four times the size of Earth. This discovery marks a significant increase in the number of known small-sized planets more akin to Earth than previously identified exoplanets, which are planets outside our solar system.

“The Kepler team continues to amaze and excite us with their planet hunting results,” said John Grunsfeld, associate administrator for NASA’s Science Mission Directorate in Washington. “That these new planets and solar systems look somewhat like our own, portends a great future when we have the James Webb Space Telescope in space to characterize the new worlds.”

Since the discovery of the first planets outside our solar system roughly two decades ago, verification has been a laborious planet-by-planet process. Now, scientists have a statistical technique that can be applied to many planets at once when they are found in systems that harbor more than one planet around the same star.

What have you discovered lately? 😉

The papers: http://www.nasa.gov/ames/kepler/digital-press-kit-kepler-planet-bonanza.

More about Kepler: http://www.nasa.gov/kepler.

Great discoveries but what else is in the Kepler data that no one is looking for?

February 22, 2014

Latest Kepler Discoveries

Filed under: Astroinformatics,Data — Patrick Durusau @ 9:01 pm

NASA Hosts Media Teleconference to Announce Latest Kepler Discoveries

NASA Kepler Teleconference: 1 p.m. EST, Wednesday, Feb. 26, 2014.

From the post:

NASA will host a news teleconference at 1 p.m. EST, Wednesday, Feb. 26, to announce new discoveries made by its planet-hunting mission, the Kepler Space Telescope.

The briefing participants are:

Douglas Hudgins, exoplanet exploration program scientist, NASA’s Astrophysics Division in Washington

Jack Lissauer, planetary scientist, NASA’s Ames Research Center, Moffett Field, Calif.

Jason Rowe, research scientist, SETI Institute, Mountain View, Calif.

Sara Seager, professor of planetary science and physics, Massachusetts Institute of Technology, Cambridge, Mass.

Launched in March 2009, Kepler was the first NASA mission to find Earth-size planets in or near the habitable zone — the range of distance from a star in which the surface temperature of an orbiting planet might sustain liquid water. The telescope has since detected planets and planet candidates spanning a wide range of sizes and orbital distances. These findings have led to a better understanding of our place in the galaxy.

The public is invited to listen to the teleconference live via UStream, at: http://www.ustream.tv/channel/nasa-arc

Questions can be submitted on Twitter using the hashtag #AskNASA.

Audio of the teleconference also will be streamed live at: http://www.nasa.gov/newsaudio

A link to relevant graphics will be posted at the start of the teleconference on NASA’s Kepler site: http://www.nasa.gov/kepler

If you aren’t mining Kepler data, this may be the inspiration to get you started!

Someone is going to discover a planet of the right size in the “Goldilocks zone.” It won’t be you for sure if you don’t try.

That would make nice bullet on your data scientist resume: Discovered first Earth sized planet in Goldilocks zone….

February 15, 2014

Creating A Galactic Plane Atlas With Amazon Web Services

Filed under: Amazon Web Services AWS,Astroinformatics,BigData — Patrick Durusau @ 1:59 pm

Creating A Galactic Plane Atlas With Amazon Web Services by Bruce Berriman, el. al.

Abstract:

This paper describes by example how astronomers can use cloud-computing resources offered by Amazon Web Services (AWS) to create new datasets at scale. We have created from existing surveys an atlas of the Galactic Plane at 16 wavelengths from 1 μm to 24 μm with pixels co- registered at spatial sampling of 1 arcsec. We explain how open source tools support management and operation of a virtual cluster on AWS platforms to process data at scale, and describe the technical issues that users will need to consider, such as optimization of resources, resource costs, and management of virtual machine instances.

In case you are interesting in taking your astronomy hobby to the next level with AWS.

And/or gaining experience with AWS and large datasets.

February 14, 2014

SunPy

Filed under: Astroinformatics,Numpy,Python — Patrick Durusau @ 4:54 pm

SunPy

From the webpage:

The SunPy project is a free and open-source software library for solar physics.

SunPy is a community-developed free and open-source software package for solar physics. SunPy is meant to be a free alternative to the SolarSoft data analysis environment which is based on the IDL scientific programming language sold by Exelis. Though SolarSoft is open-source IDL is not and can be prohibitively expensive.

The aim of the SunPy project is to provide the software tools necessary so that anyone can analyze solar data. SunPy is written using the Python programming language and is build upon the scientific Python environment which includes the core packages NumPy, SciPy. The development of SunPy is associated with that Astropy. SunPy was first created in 2011 by a small group of scientists and developers at the NASA Goddard Space Flight Center on nights and weekends.

Future employers will be interested in your data handling skills. Not whether you learned them as part of a hobby (astronomy), on your own or from a class. From a hobby just means you had fun learning them.

I first saw this in a tweet by Scientific Python.

February 4, 2014

Multi-Dimensional Images / Data Cubes

Filed under: Astroinformatics,Data Cubes — Patrick Durusau @ 9:09 pm

Accessing Multi-Dimensional Images and Data Cubes In the Virtual Observatory by Bruce Berriman.

From the post:

New instruments and missions are routinely producing multi-dimensional datasets, such as Doppler velocity cubes and time-resolved movies. Observatories such as ALMA and new integral field spectrographs on ground-based telescopes are generating data cubes , and future missions such as LSST and JWST will generate ever larger volumes of them. Thus the VO, via its standards body the International Virtual Observatory Alliance (IVOA), has made it a priority by September 2014 of developing a protocol for discovering data cubes and a reference service for accessing and downloading data cubes.

Bruce includes a poster with a summary of the Simple Image Access Protocol (SIAP, v2).

For more details, consider the SIAP version 2.0 working draft.

The experience with SIAP will be useful when other domains scale up to the current astronomy data requirements.

The Data Avalanche in Astrophysics

Filed under: Astroinformatics,Graphs,HPC — Patrick Durusau @ 1:58 pm

The Data Avalanche in Astrophysics (podcast)

From the post:

On today’s edition of Soundbite, we’ll be talking with Dr. Kirk Borne, Professor of Astrophysics and Computational Science at George Mason University about managing the data avalanche in astronomy.

Borne has been involved in a number of data-intensive astrophysics projects, including data mining on the Galaxy Zoo database of galaxy classifications. We’ll talk about some of his experiences and what challenges lie ahead for astronomy as well what some established and emerging tools, including Graph databases, languages like Python and R, and approaches will lend to his field and big data research in general.

During the podcast, Dr. Borne talks about the rising use of graphs over the last several years on supercomputers to analyze astronomical data.

You’ll get the impression that graphs are not a recent item in high-performance computing. Which just happens to be a correct impression.

January 25, 2014

WorldWide Telescope Upgrade!

Filed under: Astroinformatics,Microsoft — Patrick Durusau @ 4:56 pm

A notice about the latest version was forwarded to me and it read in part:

WorldWide Telescope is celebrating its 5th anniversary with a new release that has a completely re-written rendering engine that supports DirectX11 and runs in 64bit to give you the a wealth of new features including cinematic quality rendering and new timeline tours that allow channel by channel key frames for precise control, loads of new overlays and much more.

We also have a completely new website for this release with a responsive design for our modern mix of devices. Please use it and give use feedback. We will be adding lots of new content, including many new web interactive pages using our HTML5 control so that people with any device can enjoy our data even without the full Windows Client.

All of which sounds great and kudos to Microsoft.

Unfortunately I can’t view the upgraded site because I am running (on a VM) a version of Windows prior to Windows 7 and Windows 8. My, where does the time go. 😉

I have plenty of room for another VM so I guess it is time to spin another one up.

If you are already on Windows 7 or 8, check out the new site. If not, look for the legacy version until you can upgrade!

January 21, 2014

VisIVO Contest 2014

Filed under: Astroinformatics,Visualization — Patrick Durusau @ 10:14 am

VisIVO Contest 2014

Entries accepted: January 1st through April 30th 2014.

From the post:

This competition is an international call to use technologies provided by the VisIVO Science Gateway to produce images and movies from multi-dimensional datasets coming either from observations or numerical simulations. The competition is open to scientists and citizens alike who are investigating datasets related to astronomy or other fields, e.g., life sciences or physics. Entries will be accepted from January 1st ­ April 30th 2014 and prizes will be awarded! More information is available at http://visivo.oact.inaf.it:8080/visivo-contest or https://www.facebook.com/visivocontest2014.

Prizes:

  • 1st prize : 2500 €
  • 2nd prize : 500 €

There are basic and advanced tutorials.

The detailed rules.

You won’t be able to quite your day job if you win, but even entering may bring your visualization skills some needed attention.

January 14, 2014

Star Date: M83

Filed under: Astroinformatics,Crowd Sourcing — Patrick Durusau @ 5:44 pm

Star Date: M83 – Uncovering the ages of star clusters in the Southern Pinwheel Galaxy

From the homepage:

Most of the billions of stars that reside in galaxies start their lives grouped together into clusters. In this activity, you will pair your discerning eye with Hubble’s detailed images to identify the ages of M83’s many star clusters. This info helps us learn how star clusters are born, evolve and eventually fall apart in spiral galaxies.

A great citizen scientist project for when it is too cold to go outside (even if CNN doesn’t make it headline news).

The success of citizen science at “recognition” tasks (what else would you call subject identification?) has me convinced the average person is fully capable of authoring a topic map.

They will not author a topic map the same way I would but that’s a relief. I don’t want more than one me around. 😉

Has anyone done a systematic study of the “citizen science” interfaces? What appears to work better or worse?

Thanks!

January 10, 2014

How a New Type of Astronomy…

Filed under: Astroinformatics,Data Mining — Patrick Durusau @ 4:38 pm

How a New Type of Astronomy Investigates the Most Mysterious Objects in the Universe by Sarah Scoles.

From the post:

In 2007, astronomer Duncan Lorimer was searching for pulsars in nine-year-old data when he found something he didn’t expect and couldn’t explain: a burst of radio waves appearing to come from outside our galaxy, lasting just 5 milliseconds but possessing as much energy as the sun releases in 30 days.

Pulsars, Lorimer’s original objects of affection, are strange enough. They’re as big as cities and as dense as an atom’s nucleus, and each time they spin around (which can be hundreds of times per second), they send a lighthouse-like beam of radio waves in our direction. But the single burst that Lorimer found was even weirder, and for years astronomers couldn’t even decide whether they thought it was real.

Tick, Tock

The burst belongs to a class of phenomena known as “fast radio transients” – objects and events that emit radio waves on ultra-short timescales. They could include stars’ flares, collisions between black holes, lightning on other planets, and RRATs – Rotating RAdio Transients, pulsars that only fire up when they feel like it. More speculatively, some scientists believe extraterrestrial civilizations could be flashing fast radio beacons into space.

Astronomers’ interest in fast radio transients is just beginning, as computers chop data into ever tinier pockets of time. Scientists call this kind of analysis “time domain astronomy.” Rather than focusing just on what wavelengths of light an object emits or how bright it is, time domain astronomy investigates how those properties change as the seconds, or milliseconds, tick by.

In non-time-domain astronomy, astronomers essentially leave the telescope’s shutter open for a while, as you would if you were using a camera at night. With such a long exposure, even if a radio burst is strong, it could easily disappear into the background. But with quick sampling – in essence, snapping picture after picture, like a space stop-motion film – it’s easier to see things that flash on and then disappear.

“The awareness of these short signals has long existed,” said Andrew Siemion, who searches the time domain for signs of extraterrestrial intelligence. “But it’s only the past decade or so that we’ve had the computational capacity to look for them.”

Gathering serious data for radio astronomy remains the task of professionals but the reference to mining old data and discovering transients caught my eye.

Among other places to look for more information: National Radio Astronomy Observatory (NRAO).

Or consider Detecting radioastronomical “Fast Radio Transient Events” via an OODTbased metadata processing by Chris Mattmann, et. al. at ApacheCon 2013.

Understandably, professional interest is in real time processing of their data streams but that doesn’t mean treasures aren’t still lurking in historical data.

January 6, 2014

Linking Visualization and Understanding in Astronomy

Filed under: Astroinformatics,Visualization — Patrick Durusau @ 8:03 pm

Linking Visualization and Understanding in Astronomy by Alyssa Goodman.

Abstract:

In 1610, when Galileo pointed his small telescope at Jupiter, he drew sketches to record what he saw. After just a few nights of observing, he understood his sketches to be showing moons orbiting Jupiter. It was the visualization of Galileo’s observations that led to his understanding of a clearly Sun-centered solar system, and to the revolution this understanding then caused. Similar stories can be found throughout the history of Astronomy, but visualization has never been so essential as it is today, when we find ourselves blessed with a larger wealth and diversity of data, per astronomer, than ever in the past. In this talk, I will focus on how modern tools for interactive “linked-view” visualization can be used to gain insight. Linked views, which dynamically update all open graphical displays of a data set (e.g. multiple graphs, tables and/or images) in response to user selection, are particularly important in dealing with so-called “high-dimensional data.” These dimensions need not be spatial, even though, e.g. in the case of radio spectral-line cubes or optical IFU data), they often are. Instead, “dimensions” should be thought of as any measured attribute of an observation or a simulation (e.g. time, intensity, velocity, temperature, etc.). The best linked-view visualization tools allow users to explore relationships amongst all the dimensions of their data, and to weave statistical and algorithmic approaches into the visualization process in real time. Particular tools and services will be highlighted in this talk, including: Glue (glueviz.org), the ADS All Sky Survey (adsass.org), WorldWide Telescope (worldwidetelescope.org), yt (yt-project.org), d3po (d3po.org), and a host of tools that can be interconnected via the SAMP message-passing architecture. The talk will conclude with a discussion of future challenges, including the need to educate astronomers about the value of visualization and its relationship to astrostatistics, and the need for new technologies to enable humans to interact more effectively with large, high-dimensional data sets.

Extensive list of links mentioned in the talk along with other resources follows the abstract.

Slides from the keynote (90MB) are available now.

Video of the keynote should be posted by tomorrow.

There are differences between disciplines, vocabularies differ, techniques differ, data practices vary, but they all share the common task of making sense of the data they collect.

Watching other disciplines may be one of the better ways to get ahead in your own.

Not to mention the slides really rock on a night when it is too cold to venture out!

January 2, 2014

Astrostatistics: The Re-Emergence of a Statistical Discipline

Filed under: Astroinformatics,Information Science,Statistics — Patrick Durusau @ 4:52 pm

Astrostatistics: The Re-Emergence of a Statistical Discipline by Joseph M. Hilbe.

From the post:

If statistics can be generically understood as the science of collecting and analyzing data for the purpose of classification and prediction and of attempting to quantify and understand the uncertainty inherent in phenomena underlying data, surely astrostatistics must be considered as one of the oldest, if not the oldest, applications of statistical science to the study of nature. Astrostatistics is the discipline dealing with the statistical analysis of astronomical and astrophysical data. It also has been understood by most researchers in the area to incorporate astroinformatics, which is the science of gathering and digitalizing astronomical data for the purpose of analysis.

I mentioned that astrostatistics is a very old discipline—if we accept the broad criterion I gave for how statistics can be understood. Egyptian and Babylonian priests who assiduously studied the motions of the sun, moon, planets, and stars as long ago as 1500 BCE classified and attempted to predict future events for the purpose of knowing when to plant, determining when a new year began, and so forth. However, their predictions were infused by the attempt to understand the effects of the celestial motions on human affairs (astrology). Later, Thales (d 546 BCE), the Ionian Greek reputed to be both the first philosopher and mathematician, apparently began to divorce mythology from scientific investigation. He is credited with predicting an eclipse in 585 BCE, which he allegedly based on studies made of previous eclipses from records kept by Egyptian priests.

A short but interesting review of the history of astrostatistics and its increasing importance as the rate of astronomical data collection continues to increase.

And a call for more inter-disciplinary work between astronomers, astrophysicists, statisticians and information scientists.

The ability to cross over tribal (disciplinary) boundaries could be eased by cross-disciplinary mappings.

December 31, 2013

GALEX Unique Source Catalogs (Seibert et al.)

Filed under: Astroinformatics — Patrick Durusau @ 5:29 pm

GALEX Unique Source Catalogs (Seibert et al.)

From the webpage:

GALEX has been undertaking a number of surveys covering large areas of sky at a variety of depths. However, making use of this large data set can be difficult because the standard GALEX database contains all of the detected sources, which include many duplicate observations of the same sources, as well as numerous spurious low signal-to-noise sources. At the same time, the sky footprint associated with GALEX observations has not been well defined or presented in an easily usable format.

In order to remedy these problems, Seibert et al. have constructed three catalogs of GALEX measurements; namely the GALEX All-Sky Survey Source Catalog (GASC), the GALEX Medium Imaging Survey Catalog (GMSC), and the Kepler GCAT. Our intention is that these catalogs will provide the primary reference catalog useful for matching GALEX measurements with other large surveys of the sky at other wavelengths.

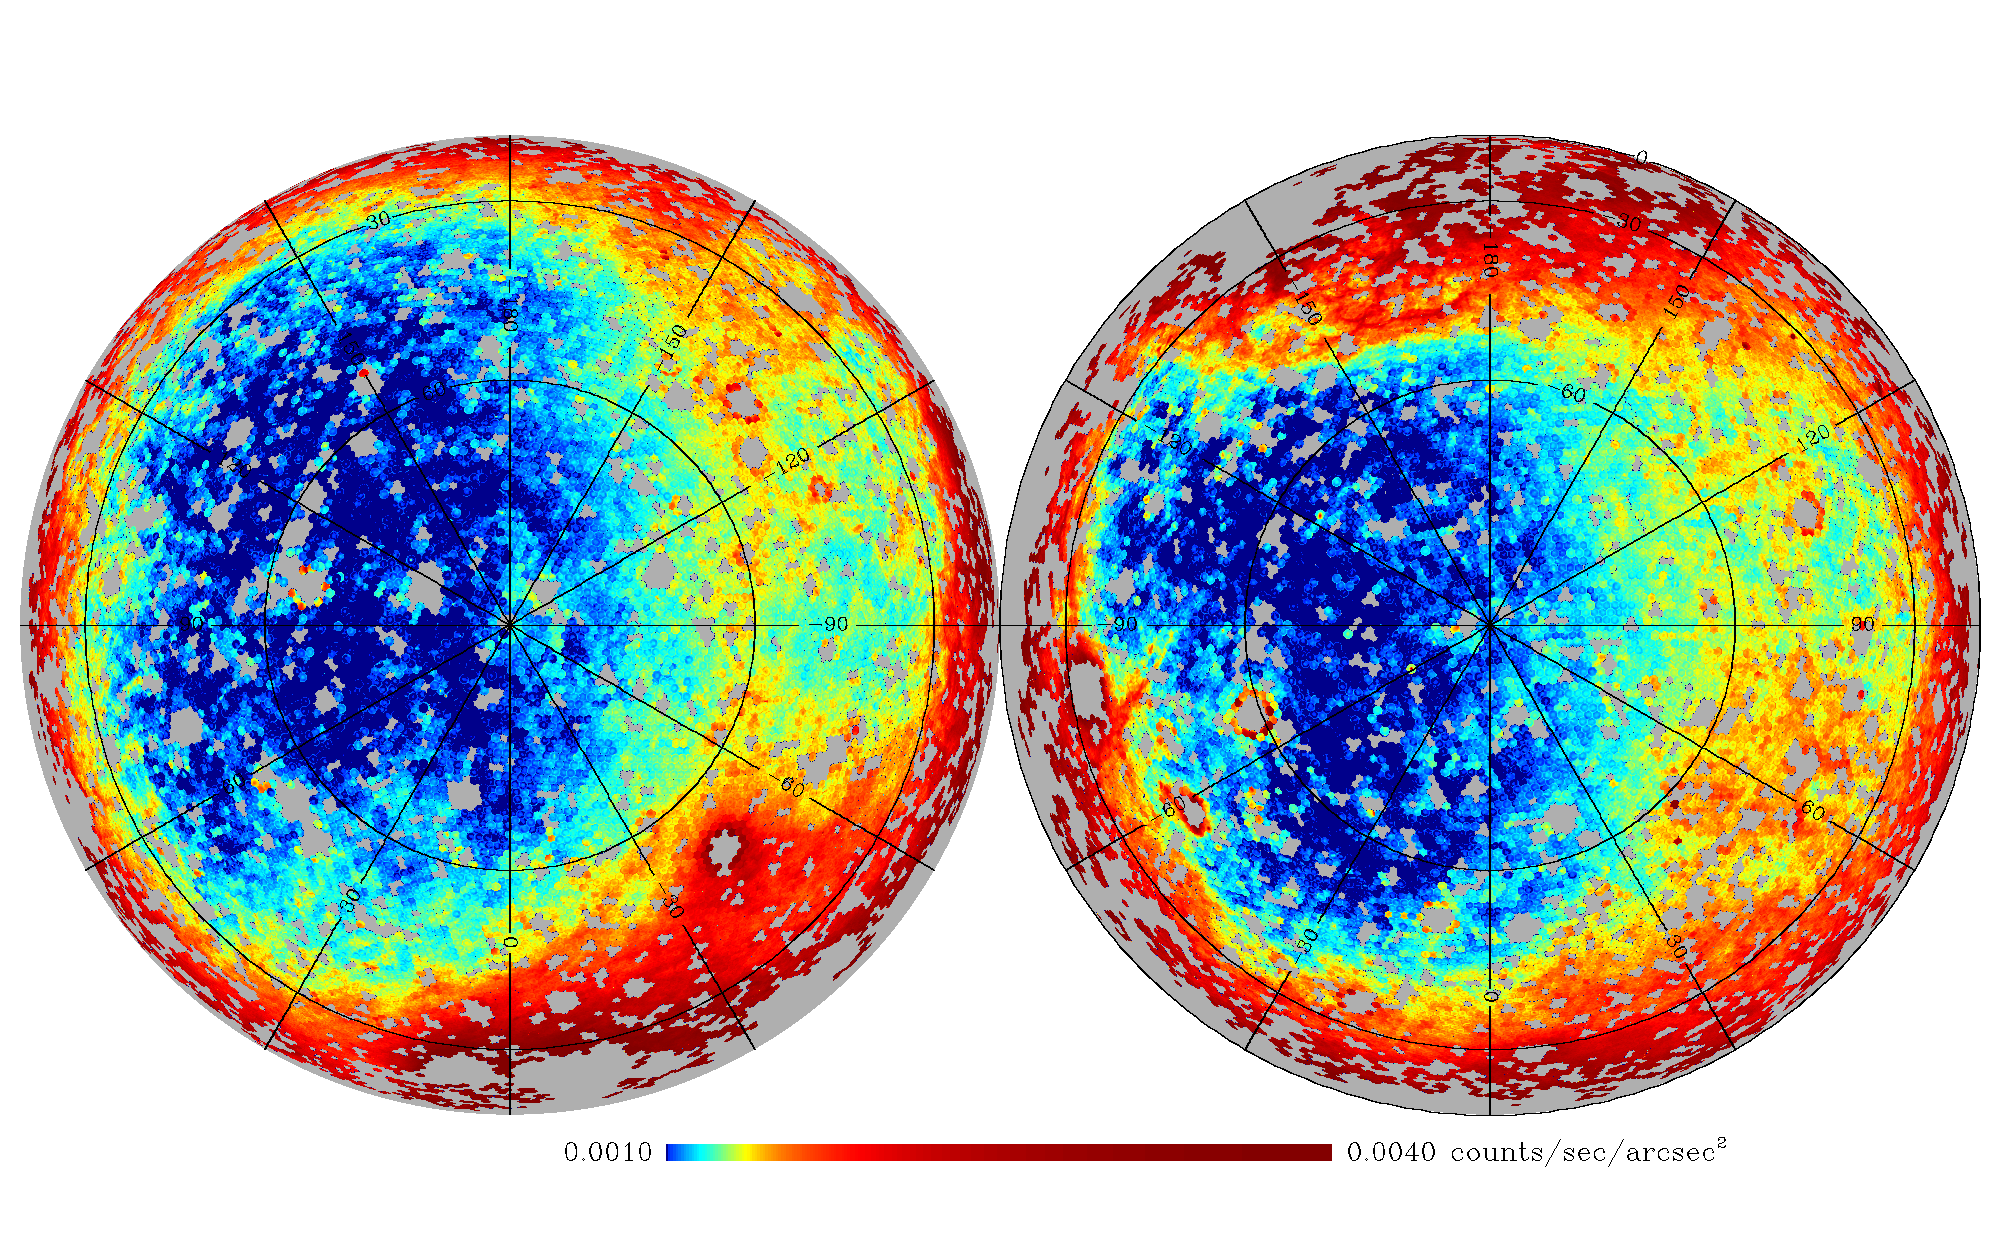
sky survey
All sky orthographic projection in Galactic coordinates of the NUV sky background in the GASC derived from the GR6 data release. The North Galactic cap is on the left while the South Galactic Cap is shown on the right.

Once astronomers move away from locating objects in the sky, they are no more immune to semantic ambiguity, synonymy and/or polysemy than any other profession.

In case you are looking for a new hobby for 2014, may I suggest amateur astroinformatics?

December 28, 2013

Data Mining 22 Months of Kepler Data…

Filed under: Astroinformatics,BigData,Data Mining — Patrick Durusau @ 5:31 pm

Data Mining 22 Months of Kepler Data Produces 472 New Potential Exoplanet Candidates by Will Baird.

Will’s report on:

Planetary Candidates Observed by Kepler IV: Planet Sample From Q1-Q8 (22 Months)

Abstract:

We provide updates to the Kepler planet candidate sample based upon nearly two years of high-precision photometry (i.e., Q1-Q8). From an initial list of nearly 13,400 Threshold Crossing Events (TCEs), 480 new host stars are identified from their flux time series as consistent with hosting transiting planets. Potential transit signals are subjected to further analysis using the pixel-level data, which allows background eclipsing binaries to be identified through small image position shifts during transit. We also re-evaluate Kepler Objects of Interest (KOI) 1-1609, which were identified early in the mission, using substantially more data to test for background false positives and to find additional multiple systems. Combining the new and previous KOI samples, we provide updated parameters for 2,738 Kepler planet candidates distributed across 2,017 host stars. From the combined Kepler planet candidates, 472 are new from the Q1-Q8 data examined in this study. The new Kepler planet candidates represent ~40% of the sample with Rp~1 Rearth and represent ~40% of the low equilibrium temperature (Teq less than 300 K) sample. We review the known biases in the current sample of Kepler planet candidates relevant to evaluating planet population statistics with the current Kepler planet candidate sample.

If you are interested in the Kepler data, you can visit the Kepler Data Archives or the Kepler Mission site.

Unlike some scientific “research,” with astronomy you don’t have to go hounding scientists for copies of their privately held data.

December 24, 2013

365 Days Of Astronomy

Filed under: Astroinformatics,Science — Patrick Durusau @ 3:41 pm

The 365 Days Of Astronomy Will Continue Its Quest In 2014.

From the post:

365 Days of Astronomy will continue its service in 2014! This time we will have more days available for new audio. Have something to share? We’re looking for content from 10 minutes long up to an hour!

logo

Since 2009, 365 Days of Astronomy has brought a new podcast every day to astronomy lovers around the world to celebrate the International Year of Astronomy. Fortunately, the project has continued until now and we will keep going for another year in 2014. This means we will continue to serve you for a 6th year.

Through these years, 365 Days Of Astronomy has been delivering daily podcasts discussing various topics in the constantly changing realm of astronomy. These include history of astronomy, the latest news, observing tips and topics on how the fundamental knowledge in astronomy has changed our paradigms of the world. We’ve also asked people to talk about the things that inspired them, and to even share their own stories, both of life doing astronomy and science fiction that got them imagining a more scientific future.

365 Days of Astronomy is a community podcast that relies on a network of dedicated podcasters across the globe who are willing to share their knowledge and experiences in astronomy with the world and it will continue that way. In 2013, 365 Days of Astronomy started a new initiative with CosmoQuest. We now offer great new audio every weekend, while on weekdays we serve up interesting podcasts from CosmoQuest and other dedicated partners. We also have several monthly podcasts from dedicated podcasters and have started two new series: Space Stories and Space Scoop. The former is a series of science fiction tales, and the latter is an astronomy news segment for children.

For more information please visit:
email: info@365daysofastronomy.org
365 Days of Astronomy: http://cosmoquest.org/blog/365daysofastronomy/
Astrosphere New Media: http://www.astrosphere.org/
Join in as podcaster: http://cosmoquest.org/blog/365daysofastronomy/join-in/
Donate to our media program : http://cosmoquest.org/blog/365daysofastronomy/donate/

If you or someone you know finds a telecope tomorrow or is already an active amateur astronomer, they may be interested in these podcasts.

Astronomy had “big data” before “big data” was a buzz word. It has a common coordinate system but how people talk about particular coordinates varies greatly. (Can you say: Needs semantic integration?)

It’s a great hobby with opportunities to explore professional data if you are interested.

I mention it because a topic map without interesting data isn’t very interesting.

December 12, 2013

A Brand New Milky Way Project

Filed under: Astroinformatics,Crowd Sourcing — Patrick Durusau @ 7:44 pm

A Brand New Milky Way Project by Robert Simpson.

From the post:

Just over three years the Zooniverse launched the Milky Way Project (MWP), my first citizen science project. I have been leading the development and science of the MWP ever since. 50,000 volunteers have taken part from all over the world, and they’ve helped us do real science, including creating astronomy’s largest catalogue of infrared bubbles – which is pretty cool.

Today the original Milky Way Project (MWP) is complete. It took about three years and users have drawn more than 1,000,000 bubbles and several million other objects, including star clusters, green knots, and galaxies. It’s been a huge success but: there’s even more data! So it is with glee that we have announced the brand new Milky Way Project! It’s got more data, more objects to find, and it’s even more gorgeous.

Another great crowd sourced project!

Bear in mind that the Greek New Testament has approximately 138,000 words and 469,000 words in the Hebrew Bible.

The success of the Milky Way and other crowd sourced projects makes you wonder why images of biblical manuscripts aren’t setup for crowd transcription doesn’t it?

Astroinformatics 2013

Filed under: Astroinformatics,BigData — Patrick Durusau @ 5:38 pm

Astroninformatics 2013: Knowledge from Data

The program runs from Monday, December 9, 2013 until December 13, 2013.

The first entire day and half of the second day are now available at the conference link.

While you wait for more video, the paper titles link to PDF files.

Highly recommended.

Big data before it was the buzz word “big data.”

December 10, 2013

Statistics, Data Mining, and Machine Learning in Astronomy:…

Filed under: Astroinformatics,Data Mining,Machine Learning,Statistics — Patrick Durusau @ 3:26 pm

Statistics, Data Mining, and Machine Learning in Astronomy: A Practical Python Guide for the Analysis of Survey Data by Željko Ivezic, Andrew J. Connolly, Jacob T VanderPlas, Alexander Gray.

From the Amazon page:

As telescopes, detectors, and computers grow ever more powerful, the volume of data at the disposal of astronomers and astrophysicists will enter the petabyte domain, providing accurate measurements for billions of celestial objects. This book provides a comprehensive and accessible introduction to the cutting-edge statistical methods needed to efficiently analyze complex data sets from astronomical surveys such as the Panoramic Survey Telescope and Rapid Response System, the Dark Energy Survey, and the upcoming Large Synoptic Survey Telescope. It serves as a practical handbook for graduate students and advanced undergraduates in physics and astronomy, and as an indispensable reference for researchers.

Statistics, Data Mining, and Machine Learning in Astronomy presents a wealth of practical analysis problems, evaluates techniques for solving them, and explains how to use various approaches for different types and sizes of data sets. For all applications described in the book, Python code and example data sets are provided. The supporting data sets have been carefully selected from contemporary astronomical surveys (for example, the Sloan Digital Sky Survey) and are easy to download and use. The accompanying Python code is publicly available, well documented, and follows uniform coding standards. Together, the data sets and code enable readers to reproduce all the figures and examples, evaluate the methods, and adapt them to their own fields of interest.

  • Describes the most useful statistical and data-mining methods for extracting knowledge from huge and complex astronomical data sets
  • Features real-world data sets from contemporary astronomical surveys
  • Uses a freely available Python codebase throughout
  • Ideal for students and working astronomers

Still in pre-release but if you want to order the Kindle version (or hardback) to be sent to me, I’ll be sure to it on my list of items to blog about in 2014!

Or your favorite book on graphs, data analysis, etc, for that matter. 😉

AstroML:… [0.2 release]

Filed under: Astroinformatics — Patrick Durusau @ 2:44 pm

AstroML: Machine Learning and Data Mining for Astronomy.

astroML 0.2 was released in November. Source on Github.

Introduction to astroML received the CIDU 2012 best paper award.

From the webpage:

AstroML is a Python module for machine learning and data mining built on numpy, scipy, scikit-learn, and matplotlib, and distributed under the 3-clause BSD license. It contains a growing library of statistical and machine learning routines for analyzing astronomical data in python, loaders for several open astronomical datasets, and a large suite of examples of analyzing and visualizing astronomical datasets.

The goal of astroML is to provide a community repository for fast Python implementations of common tools and routines used for statistical data analysis in astronomy and astrophysics, to provide a uniform and easy-to-use interface to freely available astronomical datasets. We hope this package will be useful to researchers and students of astronomy. The astroML project was started in 2012 to accompany the book Statistics, Data Mining, and Machine Learning in Astronomy by Zeljko Ivezic, Andrew Connolly, Jacob VanderPlas, and Alex Gray, published by Princeton University Press. The table of contents is available here: here(pdf), or you can view the book on Amazon.

Version 0.2 has improved documentation and examples.

Looking forward to the further development of this package!

BTW, be aware that data mining skills, save for domain knowledge, are largely transferable.

December 1, 2013

44 million stars and counting: …

Filed under: Archives,Astroinformatics,BigData — Patrick Durusau @ 9:14 pm

44 million stars and counting: Astronomers play Snap and remap the sky

From the post:

Tens of millions of stars and galaxies, among them hundreds of thousands that are unexpectedly fading or brightening, have been catalogued properly for the first time.

Professor Bryan Gaensler, Director of the ARC Centre of Excellence for All-sky Astrophysics (CAASTRO) based in the School of Physics at the University of Sydney, Australia, and Dr Greg Madsen at the University of Cambridge, undertook this formidable challenge by combining photographic and digital data from two major astronomical surveys of the sky, separated by sixty years.

The new precision catalogue has just been published in The Astrophysical Journal Supplement Series. It represents one of the most comprehensive and accurate compilations of stars and galaxies ever produced, covering 35 percent of the sky and using data going back as far as 1949.

Professor Gaensler and Dr Madsen began by re-examining a collection of 7400 old photographic plates, which had previously been combined by the US Naval Observatory into a catalogue of more than one billion stars and galaxies.

The researchers are making their entire catalogue public on the WWW, in the lead-up to the next generation of telescopes designed to search for changes in the night sky, such as the Panoramic Survey Telescope and Rapid Response System in Hawaii and the SkyMapper telescope in Australia. (unlike the Astrophysical Journal article referenced above)

Now there’s a big data project!

Because of the time period for comparison, the investigators found variations in star brightness that would have otherwise gone undetected.

Will your data be usable in sixty (60) years?

November 25, 2013

MAST Discovery Portal

Filed under: Astroinformatics,Data Mining,Searching,Space Data — Patrick Durusau @ 8:11 pm

A New Way To Search, A New Way To Discover: MAST Discovery Portal Goes Live

From the post:

MAST is pleased to announce that the first release of our Discovery Portal is now available. The Discovery Portal is a one-stop web interface to access data from all of MAST’s supported missions, including HST, Kepler, GALEX, FUSE, IUE, EUVE, Swift, and XMM. Currently, users can search using resolvable target names or coordinates (RA and DEC). The returned data include preview plots of the data (images, spectra, or lightcurves), sortable columns, and advanced filtering options. An accompanying AstroViewer projects celestial sky backgrounds from DSS, GALEX, or SDSS on which to overlay footprints from your search results. A details panel allows you to see header information without downloading the file, visit external sites like interactive displays or MAST preview pages, and cross-search with the Virtual Observatory. In addition to searching MAST, users can also search the Virtual Observatory based on resolvable target names or coordinates, and download data from the VO directly through the Portal (Spitzer, 2MASS, WISE, ROSAT, etc.) You can quickly download data one row at a time, or add items to your Download Cart as you browse for download when finished, much like shopping online. Basic plotting tools allow you to visualize metadata from your search results. Users can also upload their own tables of targets (IDs and coordinates) for use within the Portal. Cross-matching can be done with all MAST data or any data available through the CDS at Strasbourg. All of these features interact with each other: you can use the charts to drag and select data points on a plot, whose footprints are highlighted in the AstroViewer and whose returned rows are brought to the top of your search results grid for further download or exploration.

Just a quick reminder that not every data mining project is concerned with recommendations of movies or mining reviews.

Seriously, astronomy has been dealing with “big data” long before it became a buzz word.

When you are looking for new techniques or insights into data exploration, check my posts under astroinformatics.

November 5, 2013

Exoplanets.org

Filed under: Astroinformatics,Data — Patrick Durusau @ 4:45 pm

Exoplanets.org

From the homepage:

The Exoplanet Data Explorer is an interactive table and plotter for exploring and displaying data from the Exoplanet Orbit Database. The Exoplanet Orbit Database is a carefully constructed compilation of quality, spectroscopic orbital parameters of exoplanets orbiting normal stars from the peer-reviewed literature, and updates the Catalog of nearby exoplanets.

A detailed description of the Exoplanet Orbit Database and Explorers is published here and is available on astro-ph.

In addition to the Exoplanet Data Explorer, we have also provided the entire Exoplanet Orbit Database in CSV format for a quick and convenient download here. A list of all archived CSVs is available here.

Help and documentation for the Exoplanet Data Explorer is available here. A FAQ and overview of our methodology is here, including answers to the questions “Why isn’t my favorite planet/datum in the EOD?” and “Why does site X list more planets than this one?”.

A small data set but an important one none the less.

I would point out that the term “here” occurs five (5) times with completely different meanings.

It’s a small thing but had:

Help and documentation for the Exoplanet Data Explorer is available <a href=”http://exoplanets.org/help/common/data”>here</a>

been:

<a href=”http://exoplanets.org/help/common/data”>Exoplanet Data Explorer help and documentation</a>

Even a not very bright search engine might do a better search of the page.

Please avoid labeling links with “here.”

« Newer PostsOlder Posts »

Powered by WordPress