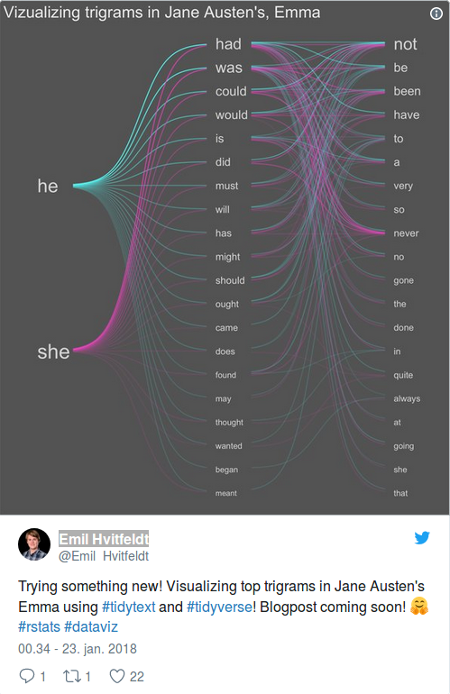
Visualizing trigrams with the Tidyverse by Emil Hvitfeldt.
From the post:
In this post I’ll go though how I created the data visualization I posted yesterday on twitter:
Great post and R code, but who reads Jane Austen? 😉
I have a serious weakness for academic and ancient texts so the Jane Austen question is meant in jest.
The more direct question is to what other texts would you apply this trigram/visualization technique?
Suggestions?
I have some texts in mind but defer mentioning them while I prepare a demonstration of Hvitfeldt’s technique to them.
PS: I ran across an odd comment in the janeaustenr package:
Each text is in a character vector with elements of about 70 characters.
You have to hunt for a bit but 70 characters is the default plain text line length at Gutenberg. Some poor decisions are going to be with us for a very long time.
