Quest for a Narrative Representation of Power Relations by Lambert Strether.
Lamber is looking to meet these requirements:
- Be generated algorithmically from data I control….
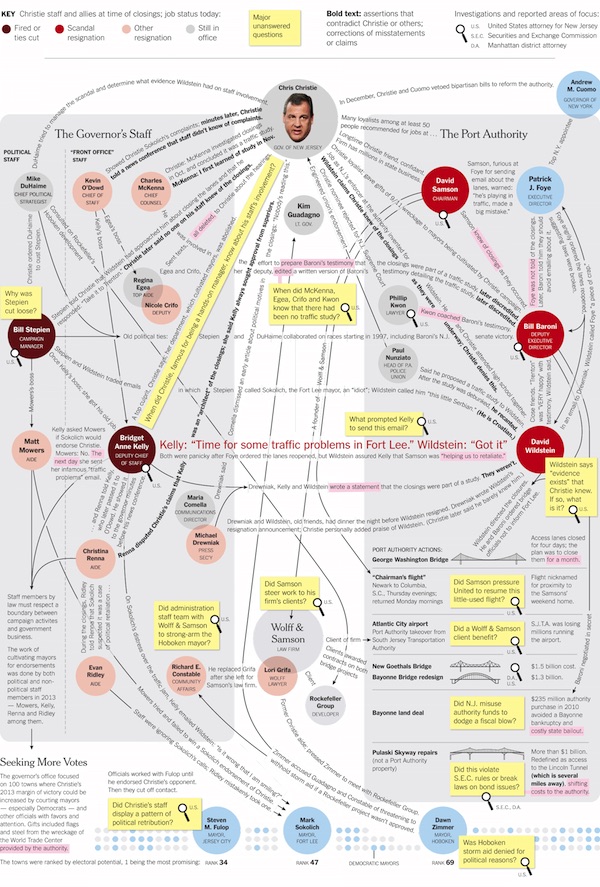
- Have narrative labels on curved arcs. … The arcs must be curved, as the arcs in Figure1 are curved, to fit the graph within the smallest possible (screen) space.
- Be pretty. There is an entire literature devoted to making “pretty” graph, starting with making sure arcs don’t cross each other….
The following map was hand crafted and it meets all the visual requirements:
Check out the original here.
Lambert goes on a search for tools that come close to this presentation and also meet the requirements set forth above.
The idea of combining graphs with narrative snippets as links is a deeply intriguing one. Rightly or wrongly I think of it as illustrated narrative but without the usual separation between those two elements.
Suggestions?
