A Compendium of Clean Graphs in R by Eric-Jan Wagenmakers and Quentin Gronau.
From the post:
Every data analyst knows that a good graph is worth a thousand words, and perhaps a hundred tables. But how should one create a good, clean graph? In R, this task is anything but easy. Many users find it almost impossible to resist the siren song of adding grid lines, including grey backgrounds, using elaborate color schemes, and applying default font sizes that makes the text much too small in relation to the graphical elements. As a result, many R graphs are an aesthetic disaster; they are difficult to parse and unfit for publication.
In constrast, a good graph obeys the golden rule: “create graphs unto others as you want them to create graphs unto you”. This means that a good graph is a simple graph, in the Einsteinian sense that a graph should be made as simple as possible, but not simpler. A good graph communicates the main message effectively, without fuss and distraction. In addition, a good graph balances its graphical and textual elements – large symbols demand an increase in line width, and these together require an increase in font size.
…
In order to reduce the time needed to find relevant R code, we have constructed a compendium of clean graphs in R. This compendium, available at http://shinyapps.org/apps/RGraphCompendium/index.html, can also be used for teaching or as inspiration for improving one’s own graphs. In addition, the compendium provides a selective overview of the kind of graphs that researchers often use; the graphs cover a range of statistical scenarios and feature contributions of different data analysts. We do not wish to presume the graphs in the compendium are in any way perfect; some are better than others, and overall much remains to be improved. The compendium is undergoing continual refinement. Nevertheless, we hope the graphs are useful in their current state.
…
This rocks! A tribute to the authors, R and graphics!
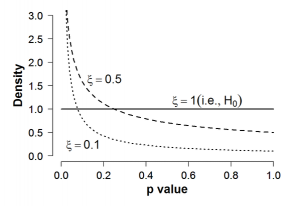
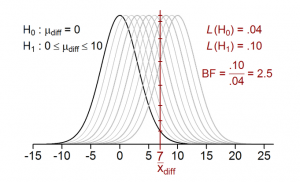
A couple samples to whet your appetite:
BTW, the images in the compendium have Show R-Code buttons!
Enjoy!

