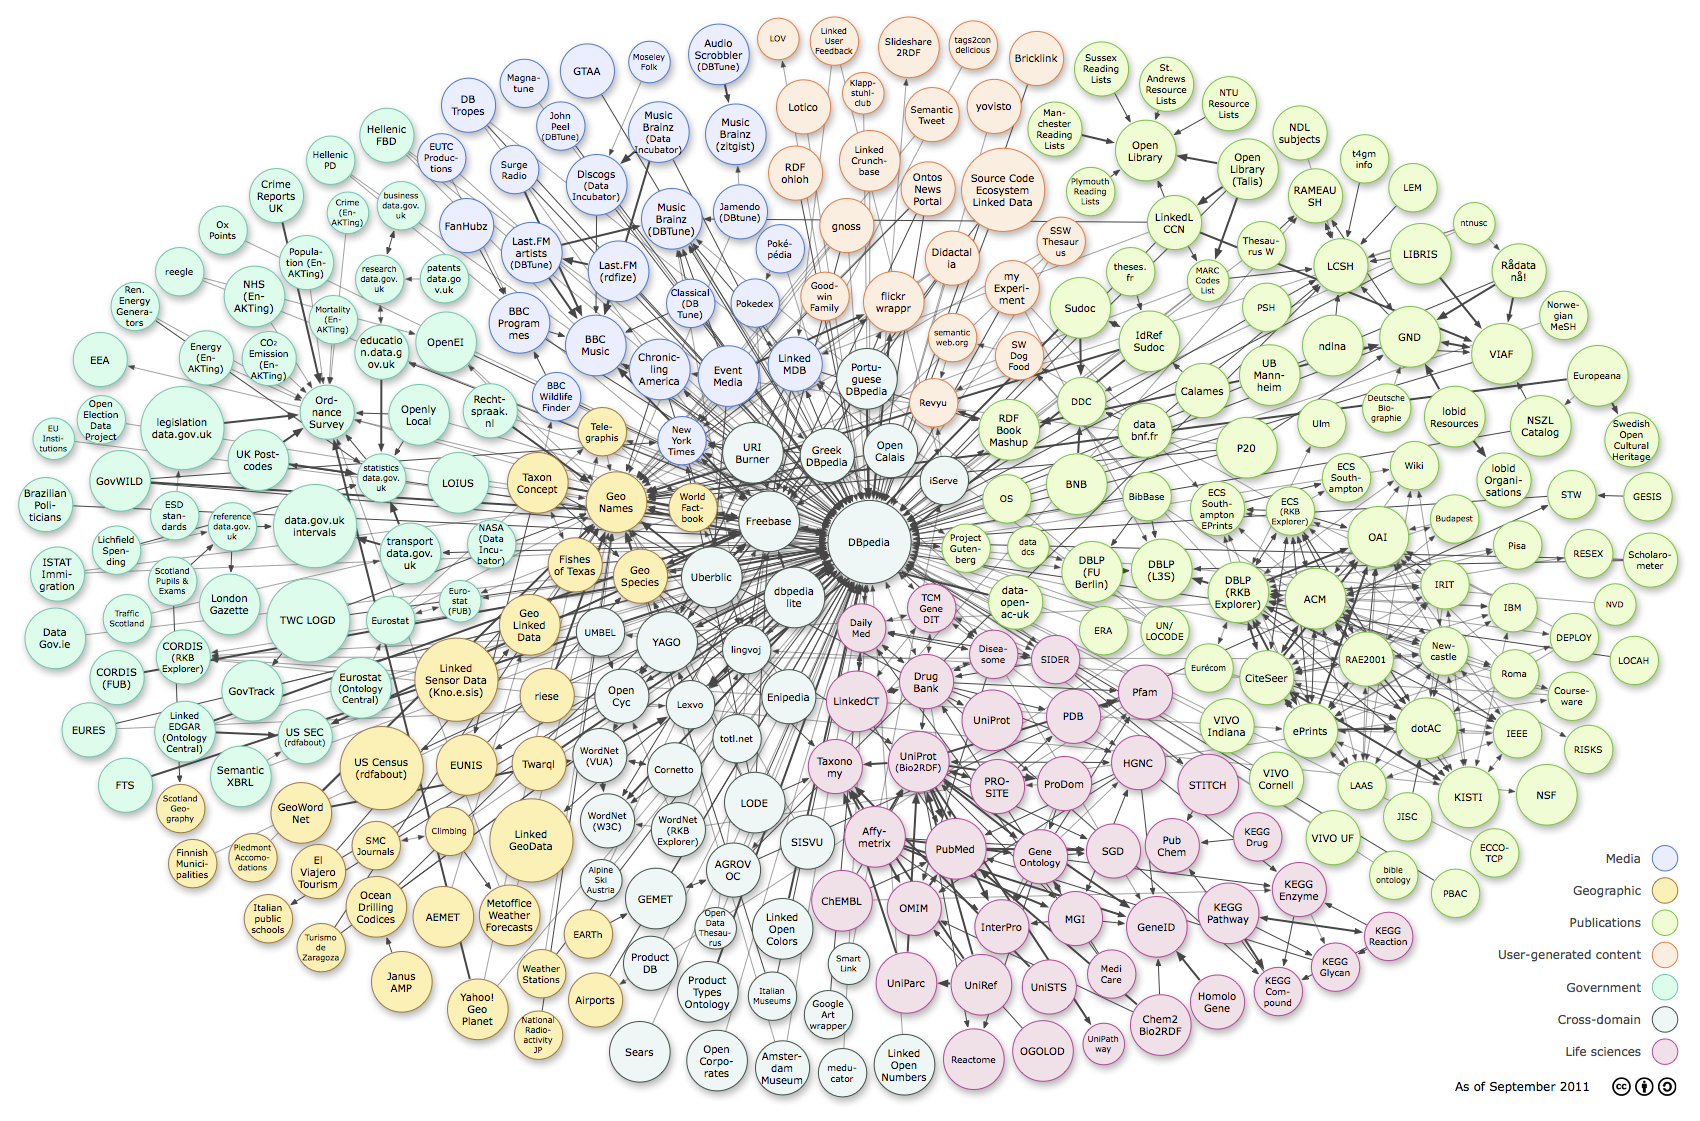
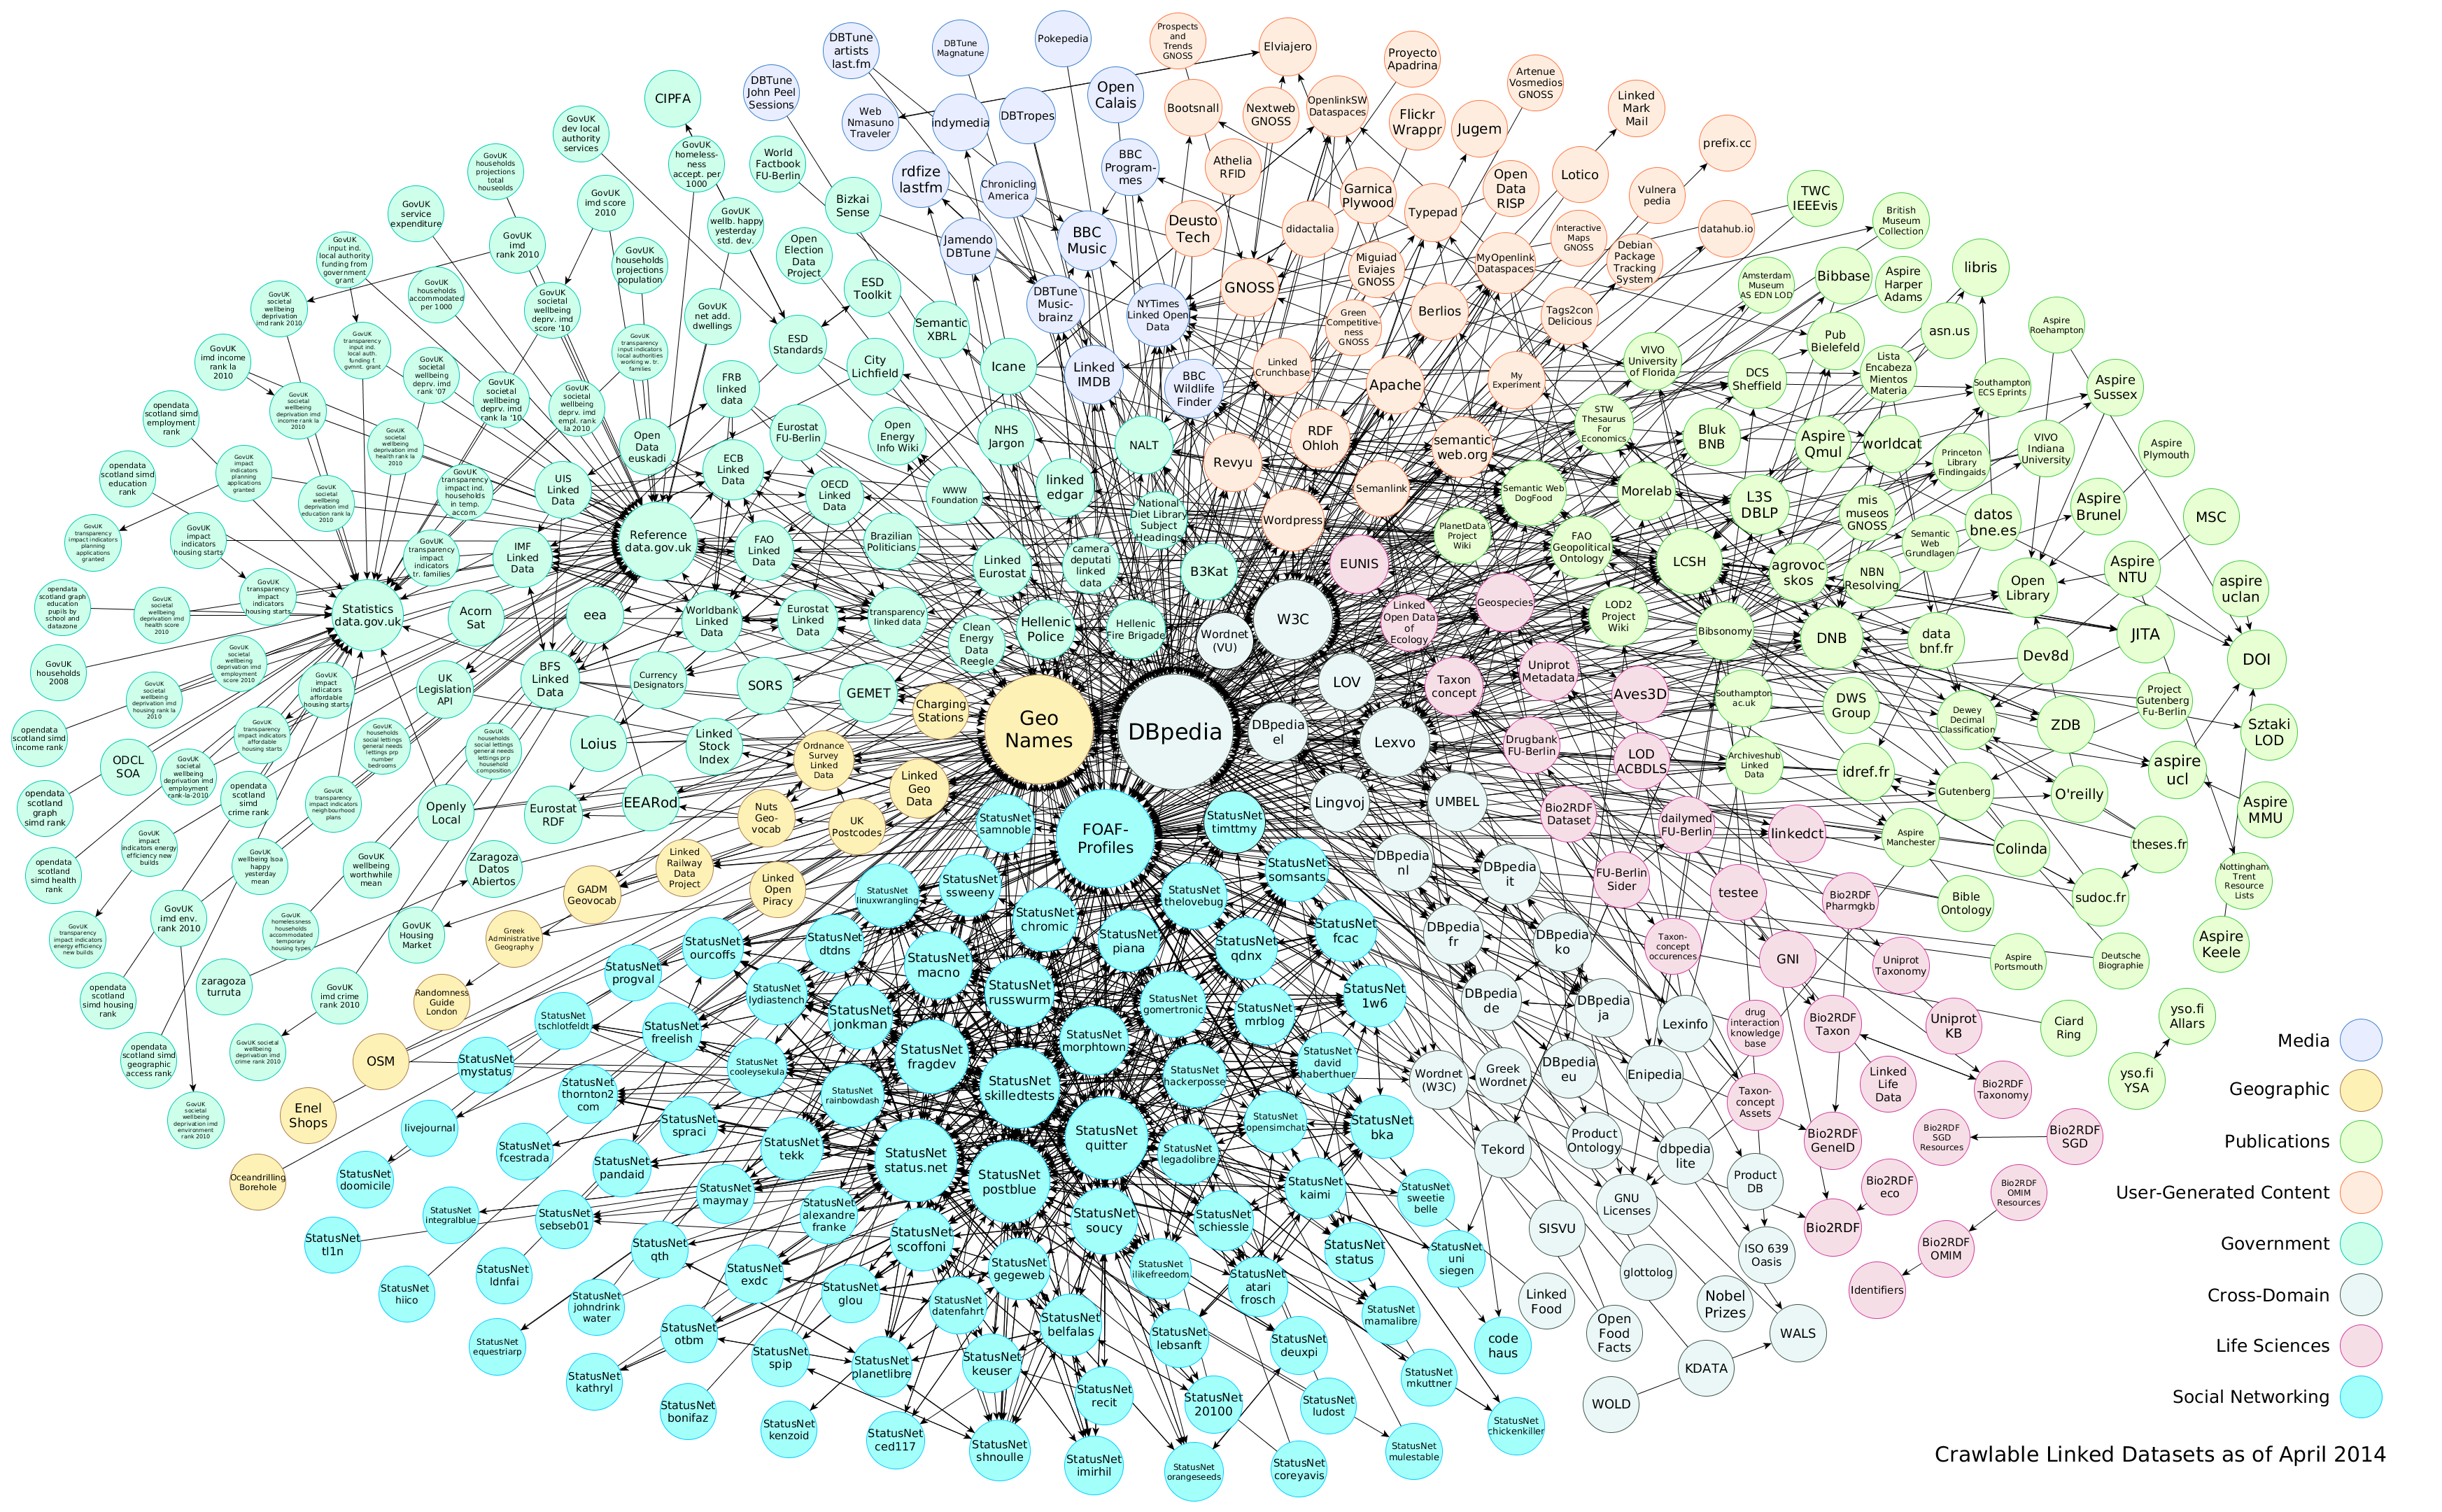
One of the more well known visualizations of the Linked Data Cloud has been updated to 2014. For comparison purposes, I have included the 2011 version as well.

LOD Cloud 2011
“Linking Open Data cloud diagram, by Richard Cyganiak and Anja Jentzsch. http://lod-cloud.net/”

LOD Cloud 2014
From Adoption of Linked Data Best Practices in Different Topical Domains by Max Schmachtenberg, Heiko Paulheim, and Christian Bizer.
How would you characterize the differences between the two?
Partially a question of how to use large graph displays? Even though the originals (in some versions) are interactive, how often is an overview of related linked data sets required?
I first saw this in a tweet by Juan Sequeda.