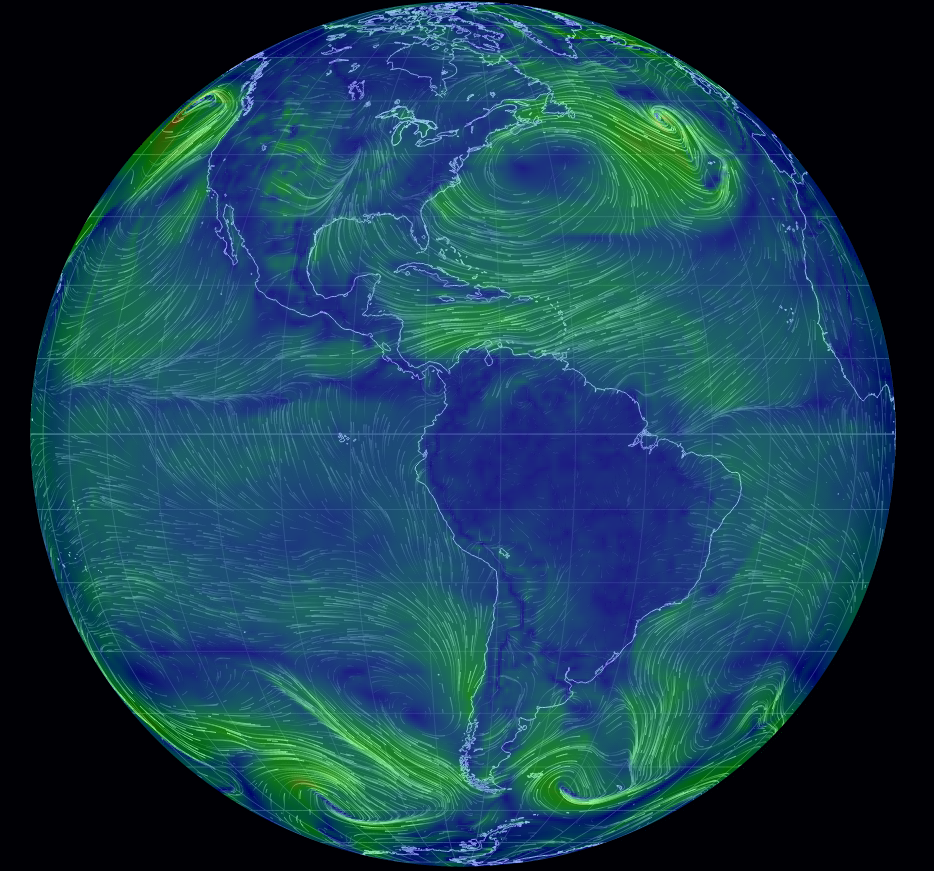
Interactive display of wind patterns on the Earth. Turn the globe, zoom in, etc.
Useful the next time a nuclear power plant cooks off.
If you doubt the “next time” part of that comment, review Timeline: Nuclear plant accidents from the BBC.
I count eleven (11) “serious” incidents between 1957 and 2014.
Highly dangerous activities are subject to catastrophic failure. Not every time or even often.
On the other hand, how often is an equivalent to the two U.S. space shuttle failures acceptable with a nuclear power plant?
If I were living nearby or in the wind path from a nuclear accident, I would say never.
You?
According to Dustin Smith at Chart Porn, where I first saw this, the chart updates every three hours.
