Another Word For It Patrick Durusau on Topic Maps and Semantic Diversity

January 5, 2014

rrdf 2.0: Updates, some fixes, and a preprint

Filed under: R,RDF — Patrick Durusau @ 8:28 pm

rrdf 2.0: Updates, some fixes, and a preprint by Egon Willighagen.

From the post:

It all started 3.5 years ago with a question on BioStar: how can one import RDF into R and because lack of an answer, I hacked up rrdf. Previously, I showed two examples and a vignette. Apparently, it was a niche, and I received good feedback. And it is starting to get cited in literature, e.g. by Vissoci et al.  Furthermore, I used it in the ropenphacts package so when I write that up, I like to have something to refer people to for detail about the used rrdf package.

Thus, during the x-mas holidays I wrote up what I had in my mind, resulting in this preprint on the PeerJ PrePrints server, for you to comment on.

An RDF extraction tool for your toolkit.

On Graph Stream Clustering with Side Information

Filed under: Clustering,Graphs — Patrick Durusau @ 7:56 pm

On Graph Stream Clustering with Side Information by Yuchen Zhao and Philip S. Yu.

Abstract:

Graph clustering becomes an important problem due to emerging applications involving the web, social networks and bio-informatics. Recently, many such applications generate data in the form of streams. Clustering massive, dynamic graph streams is significantly challenging because of the complex structures of graphs and computational difficulties of continuous data. Meanwhile, a large volume of side information is associated with graphs, which can be of various types. The examples include the properties of users in social network activities, the meta attributes associated with web click graph streams and the location information in mobile communication networks. Such attributes contain extremely useful information and have the potential to improve the clustering process, but are neglected by most recent graph stream mining techniques. In this paper, we define a unified distance measure on both link structures and side attributes for clustering. In addition, we propose a novel optimization framework DMO, which can dynamically optimize the distance metric and make it adapt to the newly received stream data. We further introduce a carefully designed statistics SGS(C) which consume constant storage spaces with the progression of streams. We demonstrate that the statistics maintained are sufficient for the clustering process as well as the distance optimization and can be scalable to massive graphs with side attributes. We will present experiment results to show the advantages of the approach in graph stream clustering with both links and side information over the baselines.

The authors have a concept of “side attributes,” examples of which are:

  • In social networks, many social activities are generated daily in the form of streams, which can be naturally represented as graphs. In addition to the graph representation, there are tremendous side information associated with social activities, e.g. user profiles, behaviors, activity types and geographical information. These attributes can be quite informative to analyze the social graphs. We illustrate an example of such user interaction graph stream in Figure 1.
  • Web click events are graph object streams generated by users. Each graph object represents a series of web clicks by a specific user within a time frame. Besides the click graph object, the meta data of webpages, users’ IP addresses and time spent on browsing can all provide insights to the subtle correlations of click graph objects.
  • In a large scientific repository (e.g. DBLP), each single article can be modeled as an authorship graph object [1][4]. In Figure 2, we illustrate an example of an authorship graph (paper) which consists of three authors (nodes) and a list of side information. For each article, the side attributes, including paper keywords, published venues and years, may be used to enhance the mining quality since they indicate tremendous meaningful relationships among authorship graphs.

Although the “side attributes” are “second-class citizens,” not part of the graph structure, the authors demonstrate effective clustering of graph streams based upon those “side attributes.”

An illustration of the point that even though you could represent the “side attributes” as part of the graph structure, you don’t necessarily have to represent them that way.

Much in the same way that some subjects in a topic map may not be represented by topics, it really depends on your use cases and requirements.

PS: If you are looking for the Cora data set cited in this paper, it has moved. See: http://people.cs.umass.edu/~mccallum/data.html, the code is now located at: http://people.cs.umass.edu/~mccallum/code.html.

taxize

Filed under: R,Taxonomy — Patrick Durusau @ 7:12 pm

taxie – taxize vignette – a taxonomic toolbelt for R

From the webpage:

taxize is a taxonomic toolbelt for R. taxize wraps APIs for a large suite of taxonomic databases availab on the web.

Tasks you can accomplish include:

  • Resolve taxonomic name
  • Retrieve higher taxonomic names
  • Interactive name selection
  • What taxa are the children of my taxon of interest?
  • Matching species tables with different taxonomic resolution

The webpage page includes links to apply for API keys (when required).

Currently implemented data sources:

I first saw this in a tweet by Antonio J. Pérez.

Unpublished Data (Meaning What?)

Filed under: NLTK,Python — Patrick Durusau @ 4:33 pm

PLoS Biology Bigrams by Georg.

From the post:

Here I will use the Natural Language Toolkit and a recipe from Python Text Processing with NLTK 2.0 Cookbook to work out the most frequent bigrams in the PLoS Biology articles that I downloaded last year and have described in previous posts here and here.

The amusing twist in this blog post is that the most frequent bigram, after filtering out stopwords, is unpublished data.

Not a trivial data set, some 1,754 articles.

Do you see the flaw in saying that most articles in PLoS data use “unpublished” data?

First, without looking at the data, I would be asking for the number of bigrams for each of the top six bigrams. I suspect that “gene expression” is used frequently relative to the number of articles, but I can’t make that judgment with the information given.

Second, the other question you would need to ask is why an article used the bigram “unpublished data.”

If I were writing a paper about papers that used “unpublished data” or more generally about “unpublished data,” I would use the bigram a lot. That would not mean my article was based on “unpublished data.”

NLTK can point you to the articles but deeper analysis is going to require you.

What “viable search engine competition” really looks like

Filed under: Marketing,Search Analytics,Search Engines,Search Requirements — Patrick Durusau @ 3:56 pm

What “viable search engine competition” really looks like by Alex Clemmer.

From the post:

Hacker News is up in arms again today about the RapGenius fiasco. See RapGenius statement and HN comments. One response article argues that we need more “viable search engine competition” and the HN community largely seems to agree.

In much of the discussion, there is a picaresque notion that the “search engine problem” is really just a product problem, and that if we try really hard to think of good features, we can defeat the giant.

I work at Microsoft. Competing with Google is hard work. I’m going to point out some of the lessons I’ve learned along the way, to help all you spry young entrepreneurs who might want to enter the market.

Alex has six (6) lessons for would-be Google killers:

Lesson 1: The problem is not only hiring smart people, but hiring enough smart people.

Lesson 2: competing on market share is possible; relevance is much harder

Lesson 3: social may pose an existential threat to Google’s style of search

Lesson 4: large companies have access to technology that is often categorically better than OSS state of the art

Lesson 5: large companies are necessarily limited by their previous investments

Lesson 6: large companies have much more data than you, and their approach to search is sophisticated

See Alex’s post for the details under each lesson.

What has always puzzled me is why compete on general search? General search services are “free” save for the cost of a users time to mine the results. It is hard to think of a good economic model to compete with “free.” Yes?

If we are talking about medical, legal, technical, engineering search, where services are sold to professionals and the cost is passed onto consumers, that could be a different story. Even there, costs have to be offset by a reasonable expectation of profit against established players in each of those markets.

One strategy would be to supplement or enhance existing search services and pitch that to existing market holders. Another strategy would be to propose highly specialized searching of unique data archives.

Do you think Alex is right in saying “…most traditional search problems have really been investigated thoroughly”?

I don’t because of the general decline in information retrieval from the 1950’s-1960’s to date.

If you doubt my observation, pick a Readers’ Guide to Periodical Literature (hard copy) for 1968 and choose some subject at random. Repeat that exercise with the search engine of your choice, limiting your results to 1968.

Which one gave you more relevant references for 1968, including synonyms? Say in the first 100 entries.

I first saw this in a tweet by Stefano Bertolo.

PS: I concede that the analog book does not have digital hyperlinks to take you to resources but it does have analog links for the same purpose. And it doesn’t have product ads. 😉
Rule-based Information Extraction is Dead!…

Filed under: Information Retrieval,Machine Learning,Topic Maps — Patrick Durusau @ 3:14 pm

Rule-based Information Extraction is Dead! Long Live Rule-based Information Extraction Systems! by Laura Chiticariu, Yunyao Li, and Frederick R. Reiss.

Abstract:

The rise of “Big Data” analytics over unstructured text has led to renewed interest in information extraction (IE). We surveyed the landscape of IE technologies and identified a major disconnect between industry and academia: while rule-based IE dominates the commercial world, it is widely regarded as dead-end technology by the academia. We believe the disconnect stems from the way in which the two communities measure the benefits and costs of IE, as well as academia’s perception that rule-based IE is devoid of research challenges. We make a case for the importance of rule-based IE to industry practitioners. We then lay out a research agenda in advancing the state-of-the-art in rule-based IE systems which we believe has the potential to bridge the gap between academic research and industry practice.

After demonstrating the disconnect between industry (rule-based) and academia (ML) approaches to information extraction, the authors propose:

Define standard IE rule language and data model.

If research on rule-based IE is to move forward in a principled way, the community needs a standard way to express rules. We believe that the NLP community can replicate the success of the SQL language in connecting data management research and practice. SQL has been successful largely due to: (1) expressivity: the language provides all primitives required for performing basic manipulation of structured data, (2) extensibility: the language can be extended with new features without fundamental changes to the language, (3)declarativity: the language allows the specification of computation logic without describing its control flow,
thus allowing developers to code what the program should accomplish, rather than how to accomplish it.

On the contrary, both industry and academia would be better served by domain specific declarative languages (DSDLs).

I say “doman specific” because each domain has its own terms and semantics that are embedded in those terms. If we don’t want to repeat the chaos of owl:sameAs, we had better enable users to define and document the semantics they attach to terms, either as operators or as data.

A host of research problems open up when semantic domains are enabled to document the semantics of their data structures and data. How do semantic understandings evolve over time within a community? Rather difficult to answer if its semantics are never documented. What are the best ways to map between the documented semantics of different communities? Again, difficult to answer without pools of documented semantics of different communities.

Not to mention the development of IE and mapping languages, which share a common core value of documenting semantics and extracting information but have specific features for particular domains. There is no reason to expect or hope that a language designed for genomic research will have all the features needed for monetary arbitrage analysis.

Rather than seeking an “Ur” language for documenting semantics/extracting data, industry can demonstrate ROI and academia progress, with targeted, declarative languages that are familiar to members of individual domains.

I first saw this in a tweet by Kyle Wade Grove.

Turning Cats into Dogs in Hanoi

Filed under: Clojure,Graphs,Visualization — Patrick Durusau @ 12:06 pm

Fun with Clojure: Turning Cats into Dogs in Hanoi by Justin Kramer.

From the post:

I’ve been having fun brushing up on basic graph theory lately. It’s amazing how many problems can be modeled with it. To that end, I did a code kata the other day that lent itself to a graph-based solution:

. . . the challenge is to build a chain of words, starting with one particular word and ending with another. Successive entries in the chain must all be real words, and each can differ from the previous word by just one letter.

One way to approach this is to think of all valid words as nodes in a graph, where words that differ from each other by one letter are connected. To find a path between one word, say “cat”, and another, “dog”, traverse the graph breadth-first starting at the “cat” node until you find the “dog” node.

The post caught my attention because of the “turning cats into dogs” phrase. Sounds like a good idea to me. 😉

The graph library mentioned in the post is Loom, which is now found at: https://github.com/aysylu/loom. (Yes, it is the same Loom mentioned in: Loom and Graphs in Clojure.)

Great visualizations including solving the Tower of Hanoi puzzle.

Do you think a Hanoi Tower with eight (8) disks would be sufficient for testing candidates for public office? Should the test be timed or least number of moves?

SDM 2014 Workshop on Heterogeneous Learning

Filed under: Conferences,Heterogeneous Data,Heterogeneous Programming,Machine Learning — Patrick Durusau @ 11:00 am

SDM 2014 Workshop on Heterogeneous Learning

Key Dates:

01/10/2014: Paper Submission
01/31/2014: Author Notification
02/10/2014: Camera Ready Paper Due

From the post:

The main objective of this workshop is to bring the attention of researchers to real problems with multiple types of heterogeneities, ranging from online social media analysis, traffic prediction, to the manufacturing process, brain image analysis, etc. Some commonly found heterogeneities include task heterogeneity (as in multi-task learning), view heterogeneity (as in multi-view learning), instance heterogeneity (as in multi-instance learning), label heterogeneity (as in multi-label learning), oracle heterogeneity (as in crowdsourcing), etc. In the past years, researchers have proposed various techniques for modeling a single type of heterogeneity as well as multiple types of heterogeneities.

This workshop focuses on novel methodologies, applications and theories for effectively leveraging these heterogeneities. Here we are facing multiple challenges. To name a few: (1) how can we effectively exploit the label/example structure to improve the classification performance; (2) how can we handle the class imbalance problem when facing one or more types of heterogeneities; (3) how can we improve the effectiveness and efficiency of existing learning techniques for large-scale problems, especially when both the data dimensionality and the number of labels/examples are large; (4) how can we jointly model multiple types of heterogeneities to maximally improve the classification performance; (5) how do the underlying assumptions associated with multiple types of heterogeneities affect the learning methods.

We encourage submissions on a variety of topics, including but not limited to:

(1) Novel approaches for modeling a single type of heterogeneity, e.g., task/view/instance/label/oracle heterogeneities.

(2) Novel approaches for simultaneously modeling multiple types of heterogeneities, e.g., multi-task multi-view learning to leverage both the task and view heterogeneities.

(3) Novel applications with a single or multiple types of heterogeneities.

(4) Systematic analysis regarding the relationship between the assumptions underlying each type of heterogeneity and the performance of the predictor;

Apologies but I saw this announcement too late for you to have a realistic opportunity to submit a paper. 🙁

Very unfortunate because the focus of the workshop is right up the topic map alley.

The main conference, which focuses on data mining, is April 24-26, 2014 in Philadelphia, Pennsylvania, USA.

I am very much looking forward to reading the papers from this workshop! (And looking for notice of next year’s workshop much earlier!)

January 4, 2014

Know Thy Complexities!

Filed under: Algorithms,Complexity — Patrick Durusau @ 9:26 pm

Know Thy Complexities!

From the post:

Hi there! This webpage covers the space and time Big-O complexities of common algorithms used in Computer Science. When preparing for technical interviews in the past, I found myself spending hours crawling the internet putting together the best, average, and worst case complexities for search and sorting algorithms so that I wouldn’t be stumped when asked about them. Over the last few years, I’ve interviewed at several Silicon Valley startups, and also some bigger companies, like Yahoo, eBay, LinkedIn, and Google, and each time that I prepared for an interview, I thought to myself “Why oh why hasn’t someone created a nice Big-O cheat sheet?”. So, to save all of you fine folks a ton of time, I went ahead and created one. Enjoy!
….

The algorithms are linked to appropriate entries in Wikipedia.

But other data exists on these algorithms and new results are common.

If this is a “cheatsheet” view, what other views of that data would you create?

I first saw this in a tweet by The O.C.R.

…The re3data.org Registry

Filed under: Data,Data Repositories — Patrick Durusau @ 5:15 pm

Making Research Data Repositories Visible: The re3data.org Registry by Heinz Pampel, et. al.

Abstract:

Researchers require infrastructures that ensure a maximum of accessibility, stability and reliability to facilitate working with and sharing of research data. Such infrastructures are being increasingly summarized under the term Research Data Repositories (RDR). The project re3data.org–Registry of Research Data Repositories–has begun to index research data repositories in 2012 and offers researchers, funding organizations, libraries and publishers an overview of the heterogeneous research data repository landscape. In July 2013 re3data.org lists 400 research data repositories and counting. 288 of these are described in detail using the re3data.org vocabulary. Information icons help researchers to easily identify an adequate repository for the storage and reuse of their data. This article describes the heterogeneous RDR landscape and presents a typology of institutional, disciplinary, multidisciplinary and project-specific RDR. Further the article outlines the features of re3data.org, and shows how this registry helps to identify appropriate repositories for storage and search of research data.

A great summary of progress so far but pay close attention to:

In the following, the term research data is defined as digital data being a (descriptive) part or the result of a research process. This process covers all stages of research, ranging from research data generation, which may be in an experiment in the sciences, an empirical study in the social sciences or observations of cultural phenomena, to the publication of research results. Digital research data occur in different data types, levels of aggregation and data formats, informed by the research disciplines and their methods. With regards to the purpose of access for use and re-use of research data, digital research data are of no value without their metadata and proper documentation describing their context and the tools used to create, store, adapt, and analyze them [7]. (emphasis added)

If you think about that for a moment you will realize that should include all the “metadata and proper documentation …. and the tools….” The need for explanation does not go away because of the label “metadata” or “documentation.”

Not that we can ever avoid semantic opaqueness but depending on the value of the data, we can push it further away in some cases than others.

An article that will repay a close reading.

I first saw this in a tweet by Stuart Buck.

Generate Cypher Queries with R

Filed under: Cypher,Graphs,Neo4j,R — Patrick Durusau @ 5:00 pm

Generate Cypher Queries with R by Nicole White.

From the post:

Lately I have been using R to generate Cypher queries and dump them line-by-line to a text file. I accomplish this through the sink(), cat(), and paste() functions. The sink function makes it so any console output is sent to the given text file; the cat function prints things to the console; and the paste function concatenates strings.

For my movie recommendations graph gist, I generated my Cypher queries by looping through the CSV file containing the movie ratings and concatenating strings as appropriate. The CSV was first loaded into a data frame called data, of which a snippet is shown below:

You do remember that the Neo4j GraphGist December Challenge ends January 31st, 2014? Yes?

Auto-generation will help avoid careless key stroke errors.

And serve to scale up from gist size to something more challenging.

How NetFlix Reverse Engineered Hollywood [+ Perry Mason Mystery]

Filed under: BigData,Data Analysis,Data Mining,Web Scrapers — Patrick Durusau @ 4:47 pm

How NetFlix Reverse Engineered Hollywood by Alexis C. Madrigal.

From the post:

If you use Netflix, you’ve probably wondered about the specific genres that it suggests to you. Some of them just seem so specific that it’s absurd. Emotional Fight-the-System Documentaries? Period Pieces About Royalty Based on Real Life? Foreign Satanic Stories from the 1980s?

If Netflix can show such tiny slices of cinema to any given user, and they have 40 million users, how vast did their set of “personalized genres” need to be to describe the entire Hollywood universe?

This idle wonder turned to rabid fascination when I realized that I could capture each and every microgenre that Netflix’s algorithm has ever created.

Through a combination of elbow grease and spam-level repetition, we discovered that Netflix possesses not several hundred genres, or even several thousand, but 76,897 unique ways to describe types of movies.

There are so many that just loading, copying, and pasting all of them took the little script I wrote more than 20 hours.

We’ve now spent several weeks understanding, analyzing, and reverse-engineering how Netflix’s vocabulary and grammar work. We’ve broken down its most popular descriptions, and counted its most popular actors and directors.

To my (and Netflix’s) knowledge, no one outside the company has ever assembled this data before.

What emerged from the work is this conclusion: Netflix has meticulously analyzed and tagged every movie and TV show imaginable. They possess a stockpile of data about Hollywood entertainment that is absolutely unprecedented. The genres that I scraped and that we caricature above are just the surface manifestation of this deeper database.

If you like data mining war stories in detail, then you will love this post by Alexis.

Along the way you will learn about:

  • Ubot Studio – Web scraping.
  • AntConc – Linguistic software.
  • Exploring other information to infer tagging practices.
  • More details about Netflix genres in general terms.

Be sure to read to the end to pick up on the Perry Mason mystery.

The Perry Mason mystery:

Netflix’s Favorite Actors (by number of genres)

  1. Raymond Burr (who played Perry Mason)
  2. Bruce Willis
  3. George Carlin
  4. Jackie Chan
  5. Andy Lau
  6. Robert De Niro
  7. Barbara Hale (also on Perry Mason)
  8. Clint Eastwood
  9. Elvis Presley
  10. Gene Autry

Question: Why is Raymond Burr in more genres than any other actor?

Some additional reading for this post: Sellling Blue Elephants

Just as a preview, the “Blue Elephants” book/site is about selling what consumers want to buy. Not about selling what you think is a world saving idea. Those are different. Sometimes very different.

I first saw this in a tweet by Gregory Piatetsky.

Ten Common Webinar Mistakes…

Filed under: Presentation,Web Conferencing — Patrick Durusau @ 3:16 pm

Ten Common Webinar Mistakes and How to Avoid Them

From the white paper (for which you have to register):

  1. The 1-week email promotion
  2. Failure to optimize registration and confirmation pages
  3. The vanilla webinar console.
  4. Leaving your audience out of the conversation
  5. Death by 1,000 bullets
  6. Selling, not helping
  7. The cell phone presenter
  8. Not respecting your audiences time
  9. Not having an on demand strategy
  10. Treating all leads equally

If you don’t understand the problem and/or its likely correction, register and download the white paper.

I haven’t encountered any of those problems as much as I have:

  1. General reviews of a software area during problem/issue webinars.
  2. Tag team presenters who offer little or no substantive content.
  3. No links for further information one sides.
  4. Intrusive registration forms (Don’t ask for telephone, address, etc.).
  5. Use of platform specific software for webinars.

Your webinars may be better lead generators if you fix the first ten problems.

Your webinars will be substantive contributions to your community if you correct the last five.

Your call.

Writing a full-text search engine using Bloom filters

Filed under: Bloom Filters,Indexing,Search Engines — Patrick Durusau @ 2:32 pm

Writing a full-text search engine using Bloom filters by Stavros Korokithakis.

A few minutes ago I came across a Hacker News post that detailed a method of adding search to your static site. As you probably know, adding search to a static site is a bit tricky, because you can’t just send the query to a server and have the server process it and return the results. If you want full-text search, you have to implement something like an inverted index.

How an inverted index works

An inverted index is a data structure that basically maps every word in every document to the ID of the document it can be found in. For example, such an index might look like {"python": [1, 3, 6], "raspberry": [3, 7, 19]}. To find the documents that mention both “python” and “raspberry”, you look those terms up in the index and find the common document IDs (in our example, that is only document with ID 3).

However, when you have very long documents with varied words, this can grow a lot. It’s a hefty data structure, and, when you want to implement a client-side search engine, every byte you transmit counts.

Client-side search engine caveats

The problem with client-side search engines is that you (obviously) have to do all the searching on the client, so you have to transmit all available information there. What static site generators do is generate every required file when generating your site, then making those available for the client to download. Usually, search-engine plugins limit themselves to tags and titles, to cut down on the amount of information that needs to be transmitted. How do we reduce the size? Easy, use a Bloom filter!

An interesting alternative to indexing a topic map with an inverted index.

I mention it in part because of one of the “weaknesses” of Bloom filters for searching:

You can’t weight pages by relevance, since you don’t know how many times a word appears in a page, all you know is whether it appears or not. You may or may not care about this.

Unlike documents, which are more or less relevant due to work occurrences, topic maps cluster information about a subject into separate topics (or proxies if you prefer).

That being the case, it isn’t the case that one topic/proxy is more “relevant” than another. The question is whether this topic/proxy represents the subject you want?

Or to put it another way, topics/proxies have already been arranged by “relevance” by a topic map author.

If a topic map interface gives you hundreds or thousands of “relevant” topics/proxies, how are you any better off than a more traditional search engine?

If you need to look like you are working, go search any of the social media sites for useful content. It’s there, the difficulty is going to be finding it.

Idempotence Is Not a Medical Condition

Filed under: Distributed Systems,Merging,Messaging — Patrick Durusau @ 2:06 pm

Idempotence Is Not a Medical Condition by Pat Helland.

From the post:

The definition of distributed computing can be confusing. Sometimes, it refers to a tightly coupled cluster of computers working together to look like one larger computer. More often, however, it refers to a bunch of loosely related applications chattering together without a lot of system-level support.

This lack of support in distributed computing environments makes it difficult to write applications that work together. Messages sent between systems do not have crisp guarantees for delivery. They can get lost, and so, after a timeout, they are retried. The application on the other side of the communication may see multiple messages arrive where one was intended. These messages may be reordered and interleaved with different messages. Ensuring that the application behaves as intended can be very hard to design and implement. It is even harder to test.

In a world full of retried messages, idempotence is an essential property for reliable systems. Idempotence is a mathematical term meaning that performing an operation multiple times will have the same effect as performing it exactly one time. The challenges occur when messages are related to each other and may have ordering constraints. How are messages associated? What can go wrong? How can an application developer build a correctly functioning app without losing his or her mojo?

A very good discussion of idempotence in the context of distributed (message passing) systems. You may recall the TMRM defining merging operators to be idempotent. (Section 8 )

Pat’s examples on idempotence include:

  1. Sweeping the floor is idempotent. If you sweep it multiple times, you still get a clean floor.
  2. Baking a cake is not idempotent.
  3. Baking a cake starting from a shopping list (if you don’t care about money) is idempotent.

As an aside, #2 is not idempotent because “a cake” means a particular cake. It can only be baked once, at least if you want to have an edible result. In #3, the act of baking from a shopping list (I prefer a recipe) and not the cake, is idempotent.

The post is quite good, particularly if you are interested in a reliable messaging based system.

I first saw this in Stuff The Internet Says On Scalability For January 3rd, 2014, which had the following note:

Pat Helland with a classically great article on Idempotence. Fortunately the article is not idempotent. Everytime you read it your brain updates with something new.

Loom and Graphs in Clojure

Filed under: Clojure,Graphs — Patrick Durusau @ 11:39 am

From the description:

Graph algorithms are cool and fascinating. We’ll look at a graph algorithms and visualization library, Loom, which is written in Clojure. We will discuss the graph API, look at implementation of the algorithms and learn about the integration of Loom with Titanium, which allows us to run the algorithms on and visualize data in graph databases.

Slides. Software at Github.

Walks through the Bellman-Ford algorithm (shortest path) and its implementation in Clojure, interfacing with Titanium, and visualizing clojure.core.async.

Loom should be high on your list of projects with graphs using Clojure.

January 3, 2014

Data Without Meaning? [Dark Data]

Filed under: Data,Data Analysis,Data Mining,Data Quality,Data Silos — Patrick Durusau @ 5:47 pm

I was reading IDC: Tons of Customer Data Going to Waste by Beth Schultz when I saw:

As much as companies understand the need for data and analytics and are evolving their relationships with both, they’re really not moving quickly enough, Schaub suggested during an IDC webinar earlier this week about the firm’s top 10 predictions for CMOs in 2014. “The aspiration is know that customer, and know what the customer wants at every single touch point. This is going to be impossible in today’s siloed, channel orientation.”

Companies must use analytics to help take today’s multichannel reality and recreate “the intimacy of the corner store,” she added.

Yes, great idea. But as IDC pointed out in the prediction I found most disturbing — especially with how much we hear about customer analytics — gobs of data go unused. In 2014, IDC predicted, “80% of customer data will be wasted due to immature enterprise data ‘value chains.’ ” That has to set CMOs to shivering, and certainly IDC found it surprising, according to Schaub.

That’s not all that surprising, either the 80% and/or the cause being “immature enterprise data ‘value chains.'”

What did surprise me was:

IDC’s data group researchers say that some 80% of data collected has no meaning whatsoever, Schaub said.

I’m willing to bet the wasted 80% of consumer data and the “no meaning” 80% of consumer data, is the same 80%.

Think about it.

If your information chain isn’t associating meaning with the data you collect, the data may as well be streaming to /dev/null.

The data isn’t without meaning, you just failed to capture it. Not the same thing as having “no meaning.”

Failing to capture meaning along with data is one way to produce what I call “dark data.”

I first saw this in a tweet by Gregory Piatetsky.

xslt3testbed

Filed under: XML,XPath,XSLT — Patrick Durusau @ 5:30 pm

xslt3testbed

From the post:

Testbed for trying out XSLT 3.0 (http://www.w3.org/TR/xslt-30/) techniques.

Since few people yet have much (or any) experience using XSLT 3.0 on more than toy examples, this is a public, medium-sized XSLT 3.0 project where people could try out new XSLT 3.0 features on the transformations to (X)HTML(5) and XSL-FO that are what we do most often and, along the way, maybe come up with new design patterns for doing transformations using the higher-order functions, partial function application, and other goodies that XSLT 3.0 gives us.

If you haven’t been investigating XSLT 3.0 (and related specifications) you need to take corrective action.

As an incentive, read Pearls Of XSLT And XPath 3.0 Design.

If you thought XSLT was useful for data operations, you will be amazed by XSLT 3.0!

Wikibase DataModel released!

Filed under: Data Models,Identification,Precision,Subject Identity,Wikidata,Wikipedia — Patrick Durusau @ 5:04 pm

Wikibase DataModel released! by Jeroen De Dauw.

From the post:

I’m happy to announce the 0.6 release of Wikibase DataModel. This is the first real release of this component.

DataModel?

Wikibase is the software behind Wikidata.org. At its core, this software is about describing entities. Entities are collections of claims, which can have qualifiers, references and values of various different types. How this all fits together is described in the DataModel document written by Markus and Denny at the start of the project. The Wikibase DataModel component contains (PHP) domain objects representing entities and their various parts, as well as associated domain logic.

I wanted to draw your attention to this discussion of “items:”

Items are Entities that are typically represented by a Wikipage (at least in some Wikipedia languages). They can be viewed as “the thing that a Wikipage is about,” which could be an individual thing (the person Albert Einstein), a general class of things (the class of all Physicists), and any other concept that is the subject of some Wikipedia page (including things like History of Berlin).

The IRI of an Item will typically be closely related to the URL of its page on Wikidata. It is expected that Items store a shorter ID string (for example, as a title string in MediaWiki) that is used in both cases. ID strings might have a standardized technical format such as “wd1234567890” and will usually not be seen by users. The ID of an Item should be stable and not change after it has been created.

The exact meaning of an Item cannot be captured in Wikidata (or any technical system), but is discussed and decided on by the community of editors, just as it is done with the subject of Wikipedia articles now. It is possible that an Item has multiple “aspects” to its meaning. For example, the page Orca describes a species of whales. It can be viewed as a class of all Orca whales, and an individual whale such as Keiko would be an element of this class. On the other hand, the species Orca is also a concept about which we can make individual statements. For example, one could say that the binomial name (a Property) of the Orca species has the Value “Orcinus orca (Linnaeus, 1758).”

However, it is intended that the information stored in Wikidata is generally about the topic of the Item. For example, the Item for History of Berlin should store data about this history (if there is any such data), not about Berlin (the city). It is not intended that data about one subject is distributed across multiple Wikidata Items: each Item fully represents one thing. This also helps for data integration across languages: many languages have no separate article about Berlin’s history, but most have an article about Berlin.

What do you make of the claim:

The exact meaning of an Item cannot be captured in Wikidata (or any technical system), but is discussed and decided on by the community of editors, just as it is done with the subject of Wikipedia articles now. It is possible that an Item has multiple “aspects” to its meaning. For example, the page Orca describes a species of whales. It can be viewed as a class of all Orca whales, and an individual whale such as Keiko would be an element of this class. On the other hand, the species Orca is also a concept about which we can make individual statements. For example, one could say that the binomial name (a Property) of the Orca species has the Value “Orcinus orca (Linnaeus, 1758).”

I may write an information system that fails to distinguish between a species of whales, a class of whales and a particular whale, but that is a design choice, not a foregone conclusion.

In the case of Wikipedia, which relies upon individuals repeating the task of extracting relevant information from loosely gathered data, that approach words quite well.

But there isn’t one degree of precision of identification that works for all cases.

My suspicion is that for more demanding search applications, such as drug interactions, less precise identifications could lead to unfortunate, even fatal, results.

Yes?

Open Source Release: java-hll

Filed under: Aggregation,HyperLogLog,Topic Map Software — Patrick Durusau @ 4:41 pm

Open Source Release: java-hll

From the post:

We’re happy to announce our newest open-source project, java-hll, a HyperLogLog implementation in Java that is storage-compatible with the previously released postgresql-hll and js-hll implementations. And as the rule of three dictates, we’ve also extracted the storage specification that makes them interoperable into it’s own repository. Currently, all three implementations support reading storage specification v1.0.0, while only the PostgreSQL and Java implementations fully support writing v1.0.0. We hope to bring the JS implementation up to speed, with respect to serialization, shortly.

For reasons to be excited, see my HyperLogLog post archive.

How to Give a Killer Presentation

Filed under: Marketing,Presentation — Patrick Durusau @ 3:58 pm

How to Give a Killer Presentation by Chris Anderson.

As the curator of the TED conference since 2002, Chris is no stranger to great presentations!

In How to Give a Killer Presentation (viewing is free but requires registration), he gives a synopsis of what to do and just as importantly, what not to do for a “killer” presentation.

Whether you are presenting a paper on topic maps at a conference, making a presentation to a class or to a small group of decision makers, you will benefit from the advice that Chris has in this article.

None of the advice is new but compare the conference presentations you have seen to any good TED talk. See what I mean?

Don’t neglect Chris’ advice if you are preparing videos. Keeping an audience engaged is even harder when a presentation isn’t “live.”

I first saw this at: How to give a killer talk by Chris Crockett. That is a post at an astronomy blog trying to improve presentations at astronomy conferences.

The concerns of topic mappers may seem unique to us but for the most part, they are shared across disciplines.

Hadoop Map Reduce For Google web graph

Filed under: Graphs,Hadoop,MapReduce — Patrick Durusau @ 2:56 pm

Hadoop Map Reduce For Google web graph

A good question from Stackoverflow:

we have been given as an assignment the task of creating map reduce functions that will output for each node n in the google web graph list the nodes that you can go from node n in 3 hops. (The actual data can be found here: http://snap.stanford.edu/data/web-Google.html)

The answer on Stackover does not provide a solution (it is a homework assignment) but does walk though an explanation of using MapReduce for graph computations.

If you are thinking about using Hadoop for large graph processing, you are likely to find this very useful.

The Ten Commandments of Statistical Inference

Filed under: Mathematics,Statistics — Patrick Durusau @ 2:45 pm

The Ten Commandments of Statistical Inference by Dr. Richard Lenski.

From the post:

1. Remember the type II error, for therein is reflected the power if not the glory.

These ten commandments (see the post for the other nine) are part and parcel of knowing your data and the assumptions of the processing applied to it.

Think of it as a short checklist to keep yourself and especially others, honest.

How Benjamin Franklin Would’ve Learned To Program

Filed under: Programming — Patrick Durusau @ 11:53 am

How Benjamin Franklin Would’ve Learned To Program by Louie Dinh.

From the post:

Good programming is notoriously difficult to teach. Programming books generally all start out in the same way: “Here is an example of an X, and here is an example.”. Teaching the building blocks is easy. There are only so many. The hard part is teaching the consequences of each choice. The common advice is to write a lot of code to get good. This is necessary but not sufficient. To learn we still need to decide what code to write, and how to improve that code.

We will explore the closely related field of writing to get advice on improving our craft. In many ways programming is like writing. Both are centrally concerned with getting your thoughts down into an easily communicated form. We find both hard because our ideas are densly cross-linked whereas text is depressingly linear. The infinite variety of ways in which thoughts can be represented in text makes learning the art of writing, as well as programming, difficult.

Thankfully, Benjamin Franklin recorded a method that he used to develop proficiency. As evidence of his writing prowess, we need only look at the Amazon Biography best seller’s list. His biography is still one of the best selling books after x hundred years. If that’s not proof then I don’t know what is.

Benjamin developed his method in his early teens and worked hard at practicing his craft. Here is the exceprt with a few added line breaks for legibility.

A better title might have been: “How Benjamin Franklin Would’ve Improved His Programming.”

I say that because Benjamin Franklin already knew the basics of writing but what he needed to learn how to improve the skills he already possessed.

Applying Franklin’s or Hunter S. Thompson’s (The value of typing code) methods to writing require work on your part but lists of great authors abound.

I don’t know of any lists of “great” programs with source code.

Pointers to such lists?

In lieu of pointers, what programs would you recommend as “great” programs? (Care to say why?)

…Scala and Breeze for statistical computing

Filed under: Functional Programming,Programming,Scala — Patrick Durusau @ 11:00 am

Brief introduction to Scala and Breeze for statistical computing by Darren Wilkinson.

From the post:

In the previous post I outlined why I think Scala is a good language for statistical computing and data science. In this post I want to give a quick taste of Scala and the Breeze numerical library to whet the appetite of the uninitiated. This post certainly won’t provide enough material to get started using Scala in anger – but I’ll try and provide a few pointers along the way. It also won’t be very interesting to anyone who knows Scala – I’m not introducing any of the very cool Scala stuff here – I think that some of the most powerful and interesting Scala language features can be a bit frightening for new users.

To reproduce the examples, you need to install Scala and Breeze. This isn’t very tricky, but I don’t want to get bogged down with a detailed walk-through here – I want to concentrate on the Scala language and Breeze library. You just need to install a recent version of Java, then Scala, and then Breeze. You might also want SBT and/or the ScalaIDE, though neither of these are necessary. Then you need to run the Scala REPL with the Breeze library in the classpath. There are several ways one can do this. The most obvious is to just run scala with the path to Breeze manually specified (or specified in an environment variable). Alternatively, you could run a console from an sbt session with a Breeze dependency (which is what I actually did for this post), or you could use a Scala Worksheet from inside a ScalaIDE project with a Breeze dependency.

It will help if you have an interest in or background with statistics as Darren introduces you to using Scala and the Breeze.

Breeze is described as:

Breeze is a library for numerical processing, machine learning, and natural language processing. Its primary focus is on being generic, clean, and powerful without sacrificing (much) efficiency. Breeze is the merger of the ScalaNLP and Scalala projects, because one of the original maintainers is unable to continue development.

so you are likely to encounter it in several different contexts.

I experience the move from “imperative” to “functional” programming being similar to moving from normalized to non-normalized data.

Normalized data, done by design prior to processing, makes some tasks easier for a CPU. Non-normalized data omits the normalization task (a burden on human operators) and puts that task on a CPU, if and when desired.

Decreasing the burden on people and increasing the burden on CPUs doesn’t trouble me.

You?

ACM Awards

Filed under: CS Lectures — Patrick Durusau @ 10:32 am

While I was writing about Jeff Huang’s Best Paper Awards in Computer Science (2013), which lists “best paper” awards, I thought about the ACM awards for dissertations and other contributions to computer science.

I mostly follow the ACM Doctoral Dissertation Award but you won’t lack for high grade reading material following any of the other award categories.

Dissertation links take you to the author’s entry in the ACM Digital library, not the dissertation in question.

Another idiosyncratic “feature” of the ACM website. Tech support at the ACM opines that some secret group, that members cannot contact directly, is responsible the “features” of the ACM website. Such as not being able to download multiple citations at one time.

I wrote to the editor at CACM about the “features” process. If you haven’t seen that letter in CACM, well, I haven’t either.

Letters critical of the opaque web “features” process don’t rate high on the priority list for publication.

If you have any improvements you want to suggest to the ACM site, please do so. I will be interested in hearing if your experience is different from mine.

January 2, 2014

A Million First Steps in Topic Maps [318 Example Topic Maps]

Filed under: Ontopia,Topic Maps,Wandora — Patrick Durusau @ 7:45 pm

A Million First Steps in Topic Maps by Aki Kivela.

From the post:

British Library released images and information from the 17th, 18th and 19th century books under a title “A million first steps”. The information was released as a series of structured text files placed at the GITHUB. The images were stored into the Flickr. License of the images and the information is public domain.

Wandora Team has converted the data files in GITHUB into the topic map serializations. Topic map serializations are XTM 2.0 formatted and can be viewed/edited in many topic map applications such as Wandora and Ontopia. Information has been divided into separate XTM files each containing information about books published during one year. Filename reflects the publishing year. License of the topic map conversions is same as the license of original data files i.e. public domain. Topic map files doesn’t contain actual images or image files but links to images in Flickr.

Information about the used topic map data model:

  • Each book topic has a basename that is a combination of book’s title and identifier.
  • Each book topic has a subject identifier that is derived from book’s identifier. Identifiers doesn’t resolve.
  • Each book topic has an English display name that is book’s title.
  • If book has a Digital Service Library identifier, it is attached to the book topic as an occurrence. Also, PDF link to the book is attached to the book topic as a separate occurrence.
  • If book has an Ark id, it is attached to the book as an occurrence.
  • Author topic is associated with the book topic.
  • Publication date topic is associated with the book topic.
  • Image topics are associated with the book topic.
  • Place of publishing topic is associated with the book topic.
  • Image topic has a subject identifier and a subject locator that resolve original image file in Flickr.
  • Image topic has a basename that is image’s identifier.
  • Image topic has occurrences for the image number, the page number and the volume number.

What can be done with the topic map conversions of the “Million first steps”? Next chapters describe some ideas.

Wandora and other topic map applications can provide a nice viewer for the book data and especially images. Topic map applications can also provide alternative publishing options that create a WWW site or a specific visualization out of the topic maps.

The user can easily enrich the information captured into the topic map, either manually or semiautomatically. A topic map is fundamentally a graph and topic map applications contain powerful tools to alter and modify the graph. Also, topic maps are incremental and two or more different topic maps can be merged. This enables linked data type merging of book information with some other information sources. Wandora has over 50 different information extractors.

Download

Download XTM conversions of the Million first steps (26.8 MB).

If you have been looking for example topic maps, here are three hundred and eighteen (318) of them. Not every year has a topic map in case you are wondering about the missing years.

Kudos to the Wandora team for splitting the topic maps by year of publication of the books containing the images!

Library interfaces often enable date range searching and that will help identify other materials to associate with the images in question.

Not to mention that annotating images from a particular year will make it easier to make a noticeable impact on the starting topic map.

So, which year are you going to take?

I was going to pick 1611 because of the King James Bible but interestingly, there appear to be no entries for the KJV in that year.

Will have to look around the images at Flickr and pick another year.

Algorithms for manipulating large geometric data

Filed under: Graphics,Visualization — Patrick Durusau @ 7:25 pm

Algorithms for manipulating large geometric data by Jiri Skala.

Abstract:

This thesis deals with manipulating huge geometric data in the field of computer graphics. The proposed approach uses a data stream technique to allow processing gigantic datasets that by far exceed the size of the main memory. The amount of data is hierarchically reduced by clustering and replacing each cluster by a representative. The input data is organised into a hierarchical structure which is stored on the hard disk. Particular clusters from various levels of the hierarchy can be loaded on demand. Such a multiresolution model provides an efficient access to the data in various resolutions. The Delaunay triangulation (either 2D or 3D) can be constructed to introduce additional structure into the data. The triangulation of the top level of the hierarchy (the lowest resolution) constitutes a coarse model of the whole dataset. The level of detail can be locally increased in selected parts by loading data from lower levels of the hierarchy. This can be done interactively in real time. Such a dynamic triangulation is a versatile tool for visualisation and maintenance of large geometric models. Further applications include local computations, such as height field interpolation, gradient estimation, and mesh smoothing. The algorithms can take advantage of a high local detail and a coarse context around. The method was tested on large digital elevation maps (digital terrain models) and on large laser scanned 3D objects, up to half a billion points. The data stream clustering processes roughly 4 million points per minute, which is rather slow, but it is done only once as a preprocessing. The dynamic triangulation works interactively in real time.

The touchstone for this paper is a scan of David which contains 468.6 million vertices.

Visualization isn’t traditional graph processing but then traditional graph traversal isn’t the only way to process a graph.

Perhaps future graph structures will avoid being hard coded for particular graph processing models.

Best Paper Awards in Computer Science (2013)

Filed under: Conferences,CS Lectures — Patrick Durusau @ 6:08 pm

Best Paper Awards in Computer Science (2013)

Jeff Huang’s list of the best paper awards from 29 CS conferences since 1996 up to and including 2013.

I have updated my listing for the conference abbreviations Jeff uses. That added eight (8) new conferences to the list.

Standards

Filed under: Humor,Marketing,Topic Maps — Patrick Durusau @ 5:05 pm

standards

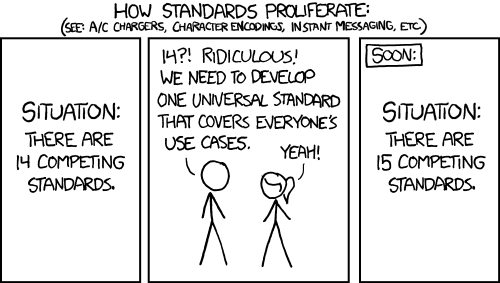
Standards proliferation is driven by standards organizations, their staffs, their members and others.

Topic maps can’t stop the proliferation of standards any more than endless ontology discussions will result in a single ontology.

Topic maps can provide one or more views of a mapping between standards.

Views to help you transition between standards or to produce data serialized according to different standards.

« Newer PostsOlder Posts »

Powered by WordPress