Another Word For It Patrick Durusau on Topic Maps and Semantic Diversity

January 16, 2014

Library of Congress RSS Feeds

Filed under: Library — Patrick Durusau @ 5:34 pm

Library of Congress RSS Feeds

Quite by accident I stumbled upon a list of Library of Congress RSS feeds and email subscriptions in the following categories:

  • Collections Preservation
  • Copyright
  • Digital Preservation
  • Events
  • Folklife
  • For Librarians
  • For Teachers
  • General News
  • Hispanic Division
  • Legal
  • Music Division
  • Journalism
  • Poetry & Literature
  • Science
  • Site Updates
  • Veterans History
  • Visual Resources

If you think about it, libraries are aggregations of diverse semantics from across many domains.

Quite at odds with any particular cultural monotone of the day.

Subversive places. That must be why I like them so much!

…Digital Asset Sustainability…

Filed under: Archives,Digital Library,Library,Preservation — Patrick Durusau @ 5:14 pm

A National Agenda Bibliography for Digital Asset Sustainability and Preservation Cost Modeling by Butch Lazorchak.

From the post:

The 2014 National Digital Stewardship Agenda, released in July 2013, is still a must-read (have you read it yet?). It integrates the perspective of dozens of experts to provide funders and decision-makers with insight into emerging technological trends, gaps in digital stewardship capacity and key areas for development.

The Agenda suggests a number of important research areas for the digital stewardship community to consider, but the need for more coordinated applied research in cost modeling and sustainability is high on the list of areas prime for research and scholarship.

The section in the Agenda on “Applied Research for Cost Modeling and Audit Modeling” suggests some areas for exploration:

“Currently there are limited models for cost estimation for ongoing storage of digital content; cost estimation models need to be robust and flexible. Furthermore, as discussed below…there are virtually no models available to systematically and reliably predict the future value of preserved content. Different approaches to cost estimation should be explored and compared to existing models with emphasis on reproducibility of results. The development of a cost calculator would benefit organizations in making estimates of the long‐term storage costs for their digital content.”

In June of 2012 I put together a bibliography of resources touching on the economic sustainability of digital resources. I’m pleasantly surprised as all the new work that’s been done in the meantime, but as the Agenda suggests, there’s more room for directed research in this area. Or perhaps, as Paul Wheatley suggests in this blog post, what’s really needed are coordinated responses to sustainability challenges that build directly on this rich body of work, and that effectively communicate the results out to a wide audience.

I’ve updated the bibliography, hoping that researchers and funders will explore the existing body of projects, approaches and research, note the gaps in coverage suggested by the Agenda and make efforts to address the gaps in the near future through new research or funding.

I count some seventy-one (71) items in this bibliography.

Digital preservation is an area where topic maps can help maintain access over changing customs and vocabularies, but just like migrating from one form of media to another, it doesn’t happen by itself.

Nor is there any “free lunch,” because the data is culturally important, rare, etc. Someone has to pay the bill for it being preserved.

Having the cost of semantic access included in digital preservation would not hurt the cause of topic maps.

Yes?

MS SQL Server -> Hadoop

Filed under: Hadoop,Hortonworks,SQL Server,Sqoop — Patrick Durusau @ 2:59 pm

Community Tutorial 04: Import from Microsoft SQL Server into the Hortonworks Sandbox using Sqoop

From the webpage:

For a simple proof of concept I wanted to get data from MS SQL Server into the Hortonworks Sandbox in an automated fasion using Sqoop. Apache Sqoop provides a way of efficiently transferring bulk data between Apache Hadoop and relational databases. This tutorial will show you how to use Sqoop to import data into the Hortonworks Sandbox from a Microsoft SQL Server data source.

You’ll have to test this one without me.

I have thought about setting up a MS SQL Server but never got around to it. 😉

Do NSA’s Bulk Surveillance Programs Stop Terrorists?

Filed under: NSA,Security — Patrick Durusau @ 2:50 pm

Do NSA’s Bulk Surveillance Programs Stop Terrorists? by Peter Bergen, David Sterman, Emily Schneider, Bailey Cahall, New America Foundation.

From the summary of the full report:

However, our review of the government’s claims about the role that NSA “bulk” surveillance of phone and email communications records has had in keeping the United States safe from terrorism shows that these claims are overblown and even misleading. An in-depth analysis of 225 individuals recruited by al-Qaeda or a like-minded group or inspired by al-Qaeda’s ideology, and charged in the United States with an act of terrorism since 9/11, demonstrates that traditional investigative methods, such as the use of informants, tips from local communities, and targeted intelligence operations, provided the initial impetus for investigations in the majority of cases, while the contribution of NSA’s bulk surveillance programs to these cases was minimal. Indeed, the controversial bulk collection of American telephone metadata, which includes the telephone numbers that originate and receive calls, as well as the time and date of those calls but not their content, under Section 215 of the USA PATRIOT Act, appears to have played an identifiable role in initiating, at most, 1.8 percent of these cases. NSA programs involving the surveillance of non-U.S. persons outside of the United States under Section 702 of the FISA Amendments Act played a role in 4.4 percent of the terrorism cases we examined, and NSA surveillance under an unidentified authority played a role in 1.3 percent of the cases we examined.

Looking at the actual cases, it turns out that traditional law enforcement is the most effective means of finding terrorists. By a large margin.

Out of 225 cases (including murders by the U.S. overseas), only 17 of them were initiated by the NSA. Or 7.7%.

Think of it this way, would you prefer your car to start 92 times out of 100 or only 8 times out of 100?

Now add in that you are spending $billions for that 8 times out of 100.

Does that give you a new perspective on funding the NSA?

LxMLS 2013

Filed under: Conferences,Machine Learning — Patrick Durusau @ 2:11 pm

LxMLS 2013: 3rd Lisbon Machine Learning School (videos)

If you missed the lectures you can view them at techtalk.tv!

Now available:

Enjoy!

JSON-LD Is A W3C Recommendation

Filed under: JSON,Linked Data,LOD,RDF — Patrick Durusau @ 1:53 pm

JSON-LD Is A W3C Recommendation

From the post:

The RDF Working Group has published two Recommendations today:

  • JSON-LD 1.0. JSON is a useful data serialization and messaging format. This specification defines JSON-LD, a JSON-based format to serialize Linked Data. The syntax is designed to easily integrate into deployed systems that already use JSON, and provides a smooth upgrade path from JSON to JSON-LD. It is primarily intended to be a way to use Linked Data in Web-based programming environments, to build interoperable Web services, and to store Linked Data in JSON-based storage engines.
  • JSON-LD 1.0 Processing Algorithms and API. This specification defines a set of algorithms for programmatic transformations of JSON-LD documents. Restructuring data according to the defined transformations often dramatically simplifies its usage. Furthermore, this document proposes an Application Programming Interface (API) for developers implementing the specified algorithms.

It would make a great question on a markup exam to ask whether JSON reminded you more of the “Multicode Basic Concrete Syntax” or a “Variant Concrete Syntax?” For either answer, explain.

In any event, you will be encountering JSON-LD so these recommendations will be helpful.

FoundationDB Developer Guide & API Reference

Filed under: FoundationDB,Key-Value Stores — Patrick Durusau @ 1:38 pm

FoundationDB Developer Guide & API Reference

From the webpage:

Foundation’s scalability and performance make it an ideal back end for supporting the operation of critical applications. FoundationDB provides a simple data model coupled with powerful transactional integrity. This document gives an overview of application development using FoundationDB, including use of the API, working with transactions, and performance considerations.

When I saw a tweet from FoundationDB that read:

More into theory or practice? Either way, check out the FoundationDB Developer Guide & API Reference

I just had to go look! 😉

Enjoy!

Apache Crunch User Guide (new and improved)

Filed under: Apache Crunch,Hadoop,MapReduce — Patrick Durusau @ 10:13 am

Apache Crunch User Guide

From the motivation section:

Let’s start with a basic question: why should you use any high-level tool for writing data pipelines, as opposed to developing against the MapReduce, Spark, or Tez APIs directly? Doesn’t adding another layer of abstraction just increase the number of moving pieces you need to worry about, ala the Law of Leaky Abstractions?

As with any decision like this, the answer is “it depends.” For a long time, the primary payoff of using a high-level tool was being able to take advantage of the work done by other developers to support common MapReduce patterns, such as joins and aggregations, without having to learn and rewrite them yourself. If you were going to need to take advantage of these patterns often in your work, it was worth the investment to learn about how to use the tool and deal with the inevitable leaks in the tool’s abstractions.

With Hadoop 2.0, we’re beginning to see the emergence of new engines for executing data pipelines on top of data stored in HDFS. In addition to MapReduce, there are new projects like Apache Spark and Apache Tez. Developers now have more choices for how to implement and execute their pipelines, and it can be difficult to know in advance which engine is best for your problem, especially since pipelines tend to evolve over time to process more data sources and larger data volumes. This choice means that there is a new reason to use a high-level tool for expressing your data pipeline: as the tools add support for new execution frameworks, you can test the performance of your pipeline on the new framework without having to rewrite your logic against new APIs.

There are many high-level tools available for creating data pipelines on top of Apache Hadoop, and they each have pros and cons depending on the developer and the use case. Apache Hive and Apache Pig define domain-specific languages (DSLs) that are intended to make it easy for data analysts to work with data stored in Hadoop, while Cascading and Apache Crunch develop Java libraries that are aimed at developers who are building pipelines and applications with a focus on performance and testability.

So which tool is right for your problem? If most of your pipeline work involves relational data and operations, than Hive, Pig, or Cascading provide lots of high-level functionality and tools that will make your life easier. If your problem involves working with non-relational data (complex records, HBase tables, vectors, geospatial data, etc.) or requires that you write lots of custom logic via user-defined functions (UDFs), then Crunch is most likely the right choice.

As topic mappers you are likely to work with both relational as well as complex non-relational data so this should be on your reading list.

I didn’t read the prior Apache Crunch documentation so I will have to take Josh Wills at his word that:

A (largely) new and (vastly) improved user guide for Apache Crunch, including details on the new Spark-based impl:

It reads well and makes a good case for investing time in learning Apache Crunch.

I first saw this in a tweet by Josh Wills.

January 15, 2014

D3 – Cheatsheet (correction)

Filed under: D3,Graphics,Visualization — Patrick Durusau @ 7:31 pm

D3 – Cheatsheet

Scott Murray (@alignedleft) has corrected a typo in the Array.push() example.

You might want to grab a new copy.

Marin’s Year on SlideShare

Filed under: Communication,Marketing — Patrick Durusau @ 7:24 pm

Marin’s Year on SlideShare

Marin Dimitrov tweeted today:

SlideShare says my content is among the top 1% of most viewed on SlideShare in 2013

Since I am interested in promoting topic maps and SlideShare is a venue for that, I checked the Slideshare summary, looking for clues.

First, Marin hasn’t overloaded SlideShare, some 14 slideshares to date.

Second, none of the slideshares with high ratings are particularly recent (2010).

Third, 19.5 slides per presentation against the average of 14.4.

Fourth, average words per slide, 35.4 compared to average slideshare of 10.

Is that the magic bullet?

We have all been told to avoid “death by powerpoint.”

There is a presentation with that name: Death by PowerPoint (and how to fight it) by Alexei Kapterev. (July 31, 2007)

Great presentation but at slide 40 Alexei says:

People read faster than you speak. This means you are useless.

(written over a solid text background)

How to explain Marin’s high amount of text versus Alexei saying to not have much text?

Marin’s NoSQL Databases, most of the sixty (60) slides are chock full of text. Useful text to be sure but very full of it.

My suspicion is that what works for a presentation to a live audience, were you can fill out the points, explain pictures, etc., isn’t the same thing as a set of slides for readers who didn’t see the floor show.

Readers who didn’t hear the details are likely to find “great” slides for a live presentation to be too sparse to be useful.

So my working theory is that slides for live presentations should be quite different from slides for posting to Slideshare. What can be left for you to ad lib for the live audience should be spelled out on the slides. (my working hypothesis)

Suggestions/comments?

PS: I intend to test this theory with some slides on topic maps at the end of January.

What’s Hiding In Your Classification System?

Filed under: Classification,Graphics,Patents,Visualization — Patrick Durusau @ 5:10 pm

Patent Overlay Mapping: Visualizing Technological Distance by Luciano Kay, Nils Newman, Jan Youtie, Alan L. Porter, Ismael Rafols.

Abstract:

This paper presents a new global patent map that represents all technological categories, and a method to locate patent data of individual organizations and technological fields on the global map. This overlay map technique may support competitive intelligence and policy decision-making. The global patent map is based on similarities in citing-to-cited relationships between categories of theInternational Patent Classification (IPC) of European Patent Office (EPO) patents from 2000 to 2006. This patent dataset, extracted from the PATSTAT database, includes 760,000 patent records in 466 IPC-based categories. We compare the global patent maps derived from this categorization to related efforts of other global patent maps. The paper overlays nanotechnology-related patenting activities of two companies and two different nanotechnology subfields on the global patent map. The exercise shows the potential of patent overlay maps to visualize technological areas and potentially support decision-making. Furthermore, this study shows that IPC categories that are similar to one another based on citing-to-cited patterns (and thus are close in the global patent map) are not necessarily in the same hierarchical IPC branch, thus revealing new relationships between technologies that are classified as pertaining to different (and sometimes distant) subject areas in the IPC scheme.

The most interesting discovery in the paper was summarized as follows:

One of the most interesting findings is that IPC categories that are close to one another in the patent map are not necessarily in the same hierarchical IPC branch. This finding reveals new patterns of relationships among technologies that pertain to different (and sometimes distant) subject areas in the IPC classification. The finding suggests that technological distance is not always well proxied by relying on the IPC administrative structure, for example, by assuming that a set of patents represents substantial technological distance because the set references different IPC sections. This paper shows that patents in certain technology areas tend to cite multiple and diverse IPC sections.

That being the case, what is being hidden in other classification systems?

For example, how does the ACM Computing Classification System compare when the citations used by authors are taken into account?

Perhaps this is a method to compare classifications as seen by experts versus a community of users.

BTW, the authors have posted supplemental materials online:

Supplementary File 1 is an MS Excel file containing the labels of IPC categories, citation and similarity matrices, factor analysis of IPC categories. It can be found at: http://www.sussex.ac.uk/Users/ir28/patmap/KaySupplementary1.xls

Supplementary File 2 is an MS PowerPoint file with examples of overlay maps of firms and research topics. It can be found at: http://www.sussex.ac.uk/Users/ir28/patmap/KaySupplementary2.ppt

Supplementary File 3 is an interactive version of map in Figure 1visualized with the freeware VOSviewer. It can be found at: http://www.vosviewer.com/vosviewer.php?map=http://www.sussex.ac.uk/Users/ir28/patmap/KaySupplementary3.txt

Vega

Filed under: BigData,Graphics,Visualization,XDATA — Patrick Durusau @ 4:40 pm

Vega

From the webpage:

Vega is a visualization grammar, a declarative format for creating, saving and sharing visualization designs.

With Vega you can describe data visualizations in a JSON format, and generate interactive views using either HTML5 Canvas or SVG.

Read the tutorial, browse the documentation, join the discussion, and explore visualizations using the web-based Vega Editor.

vega.min.js (120K)

Source (GitHub)

Of interest mostly because of its use with XDATA@Kitware for example.

XDATA@Kitware

Filed under: BigData,Data Analysis,Graphs,Vega,Virtualization,XDATA — Patrick Durusau @ 4:21 pm

XDATA@Kitware Big data unlocked, with the power of the Web.

From the webpage:

XDATA@Kitware is the engineering and research effort of a DARPA XDATA visualization team consisting of expertise from Kitware, Inc., Harvard University, University of Utah, Stanford University, Georgia Tech, and KnowledgeVis, LLC. XDATA is a DARPA-funded project to develop big data analysis and visualization solutions through utilizing and expanding open-source frameworks.

We are in the process of developing the Visualization Design Environment (VDE), a powerful yet intuitive user interface that will enable rapid development of visualization solutions with no programming required, using the Vega visualization grammar. The following index of web apps, hosted on the modular and flexible Tangelo web server framework, demonstrates some of the capabilities these tools will provide to solve a wide range of big data problems.

Examples:

Document Entity Relationships: Discover the network of named entities hidden within text documents

SSCI Predictive Database: Explore the progression of table partitioning in a predictive database.

Enron: Enron email visualization.

Flickr Metadata Maps: Explore the locations where millions of Flickr photos were taken

Biofabric Graph Visualization: An implementation of the Biofabric algorithm for visualizing large graphs.

SFC (Safe for c-suite) if you are there to explain them.

Related:

Vega (Trifacta, Inc.) – A visualization grammar, based on JSON, for specifying and representing visualizations.

MPGraph: [GPU = 3 Billion Traversed Edges Per Second]

Filed under: GPU,Graphs,Parallel Programming — Patrick Durusau @ 3:32 pm

mpgraph Beta: Massively Parallel Graph processing on GPUs

From the webpage:

MPGraph is Massively Parallel Graph processing on GPUs.

The MPGraph API makes it easy to develop high performance graph analytics on GPUs. The API is based on the Gather-Apply-Scatter (GAS) model as used in GraphLab. To deliver high performance computation and efficiently utilize the high memory bandwidth of GPUs, MPGraph’s CUDA kernels use multiple sophisticated strategies, such as vertex-degree-dependent dynamic parallelism granularity and frontier compaction.

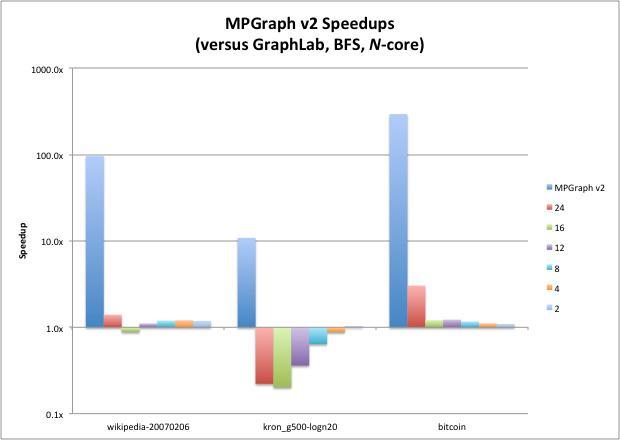
MPGraph is up to two order of magnitude faster than parallel CPU implementations on up 24 CPU cores and has performance comparable to a state-of-the-art manually optimized GPU implementation.

New algorithms can be implemented in a few hours that fully exploit the data-level parallelism of the GPU and offer throughput of up to 3 billion traversed edges per second on a single GPU.

Before some wag blows off the “3 billion traversed edges per second on a single GPU” by calling MPGraph a “graph compute engine,” consider this performance graphic:

MPGraph performance

Screenshot 1 / 1 MPGraph showing BFS speedup over graphlab. Comparison is a single NVIDIA K20 verus up to 24 CPU cores using an 3.33 GHz X5680 CPU chipset.

Don’t let name calling keep you from seeking the graph performance you need.

Flying an F-16 requires more user skill than a VW. But when you need an F-16, don’t settle for a VW because its easier.

GTC On-Demand

Filed under: Conferences,GPU,HPC — Patrick Durusau @ 3:05 pm

GTC On-Demand

While running down presentations at prior GPU Technology Conferences, I found this gold mine of presentations and slides on GPU computing.

Counting “presentationTitle” in the page source says 385 presentations!

Enjoy!

Hardware for Big Data, Graphs and Large-scale Computation

Filed under: BigData,GPU,Graphs,NVIDIA — Patrick Durusau @ 2:51 pm

Hardware for Big Data, Graphs and Large-scale Computation by Rob Farber.

From the post:

Recent announcements by Intel and NVIDIA indicate that massively parallel computing with GPUs and Intel Xeon Phi will no longer require passing data via the PCIe bus. The bad news is that these standalone devices are still in the design phase and are not yet available for purchase. Instead of residing on the PCIe bus as a second-class system component like a disk or network controller, the new Knights Landing processor announced by Intel at ISC’13 will be able to run as a standalone processor just like a Sandy Bridge or any other multi-core CPU. Meanwhile, NVIDIA’s release of native ARM compilation in CUDA 5.5 provides a necessary next step toward Project Denver, which is NVIDIAs integration of a 64-bit ARM processor and a GPU. This combination, termed a CP-GP (or ceepee-geepee) in the media, can leverage the energy savings and performance of both architectures.

Of course, the NVIDIA strategy also opens the door to the GPU acceleration of mobile phone and other devices in the ARM dominated low-power, consumer and real-time markets. In the near 12- to 24-month timeframe, customers should start seeing big-memory standalone systems based on Intel and NVIDIA technology that only require power and a network connection. The need for a separate x86 computer to host one or more GPU or Intel Xeon Phi coprocessors will no longer be a requirement.

The introduction of standalone GPU and Intel Xeon Phi devices will affect the design decisions made when planning the next generation of leadership class supercomputers, enterprise data center procurements, and teraflop/s workstations. It also will affect the software view in programming these devices, because the performance limitations of the PCIe bus and the need to work with multiple memory spaces will no longer be compulsory.

Ray provides a great peek at hardware that is coming and current high performance computing, in particular, processing graphs.

Resources mentioned in Rob’s post without links:

Rob’s Intel Xeon Phi tutorial at Dr. Dobbs:

Programming Intel’s Xeon Phi: A Jumpstart Introduction

CUDA vs. Phi: Phi Programming for CUDA Developers

Getting to 1 Teraflop on the Intel Phi Coprocessor

Numerical and Computational Optimization on the Intel Phi

Rob’s GPU Technology Conference presentations:

Simplifying Portable Killer Apps with OpenACC and CUDA-5 Concisely and Efficiently.

Clicking GPUs into a Portable, Persistent and Scalable Massive Data Framework.

(The links are correct but put you one presentation below Rob’s. Scroll up one. Sorry. It was that or use an incorrect link to put you at the right location.)

mpgraph (part of XDATA)

Other resources you may find of interest:

Ray Farber – Dr. Dobbs – Current article listing.

Hot-Rodding Windows and Linux App Performance with CUDA-Based Plugins by Rob Farber (with source code for Windows and Linux).

Ray Farber’s wiki: http://gpucomputing.net/ (Warning: The site seems to be flaky. If it doesn’t load, try again.)

OpenCL (Khronos)

Ray Farber’s Code Project tutorials:

(Part 9 was published in February of 2012. Some updating may be necessary.)

January 14, 2014

Balisage 2014: Near the Belly of the Beast

Filed under: Conferences,HyTime,XML,XML Schema,XPath,XQuery,XSLT — Patrick Durusau @ 7:29 pm

Balisage: The Markup Conference 2014 Bethesda North Marriott Hotel & Conference Center, just outside Washington, DC

Key dates:
– 28 March 2014 — Peer review applications due
– 18 April 2014 — Paper submissions due
– 18 April 2014 — Applications for student support awards due
– 20 May 2014 — Speakers notified
– 11 July 2014 — Final papers due
– 4 August 2014 — Pre-conference Symposium
– 5–8 August 2014 — Balisage: The Markup Conference

From the call for participation:

Balisage is the premier conference on the theory, practice, design, development, and application of markup. We solicit papers on any aspect of markup and its uses; topics include but are not limited to:

  • Cutting-edge applications of XML and related technologies
  • Integration of XML with other technologies (e.g., content management, XSLT, XQuery)
  • Performance issues in parsing, XML database retrieval, or XSLT processing
  • Development of angle-bracket-free user interfaces for non-technical users
  • Deployment of XML systems for enterprise data
  • Design and implementation of XML vocabularies
  • Case studies of the use of XML for publishing, interchange, or archving
  • Alternatives to XML
  • Expressive power and application adequacy of XSD, Relax NG, DTDs, Schematron, and other schema languages

Detailed Call for Participation: http://balisage.net/Call4Participation.html
About Balisage: http://balisage.net/Call4Participation.html
Instructions for authors: http://balisage.net/authorinstructions.html

For more information: info@balisage.net or +1 301 315 9631

I checked, from the conference hotel you are anywhere from 25.6 to 27.9 miles by car from the NSA Visitor Center at Fort Meade.

Take appropriate security measures.

When I heard Balisage was going to be in Bethesda, the first song that came to mind was: Back in the U.S.S.R.. Followed quickly by Leonard Cohen’s Democracy Is Coming to the U.S.A..

I don’t know where the equivalent of St. Catherine Street of Montreal is in Bethesda. But when I find out, you will be the first to know!

Balisage is simply the best markup technology conference. (full stop) Start working on your manager now to get time to write a paper and to attend Balisage.

When the time comes for “big data” to make sense, markup will be there to answer the call. You should be too.

Online Training: Getting Started with Neo4j

Filed under: Graphs,Neo4j — Patrick Durusau @ 5:59 pm

Online Training: Getting Started with Neo4j

From the webpage:

Course Description: Getting Started with Neo4j

You’re beginning with Neo4j? Invest 4 hours of interactive, engaging learning to get familiar with Neo4j. With this online course you can control your progress at your own leisure and pause and resume at any time.

Audience

  • Developers, System Administrators, DevOps engineers, DBAs, Business Analysts, CTOs, CIOs, and students.
  • Also, we invite anyone who is interested in getting an overview of graph databases and Neo4j.

Skills taught

  • An understanding of graph databases
  • How to use graph databases
  • Introduction to data modeling with Graph databases
  • How to get started working with Neo4j

Free, well, you have to become a marketing lead, but free otherwise, online training on Neo4j.

I never have understood the marketing lead approach to “free” training, white papers, etc.

Reminds me of a local church that sponsored a “safe” Halloween with games and candy for children. Until they realized the resulting number of children enrolling at their church wasn’t high enough. So they stopped giving out candy at Halloween.

Quality products attract customers. Promise.

Star Date: M83

Filed under: Astroinformatics,Crowd Sourcing — Patrick Durusau @ 5:44 pm

Star Date: M83 – Uncovering the ages of star clusters in the Southern Pinwheel Galaxy

From the homepage:

Most of the billions of stars that reside in galaxies start their lives grouped together into clusters. In this activity, you will pair your discerning eye with Hubble’s detailed images to identify the ages of M83’s many star clusters. This info helps us learn how star clusters are born, evolve and eventually fall apart in spiral galaxies.

A great citizen scientist project for when it is too cold to go outside (even if CNN doesn’t make it headline news).

The success of citizen science at “recognition” tasks (what else would you call subject identification?) has me convinced the average person is fully capable of authoring a topic map.

They will not author a topic map the same way I would but that’s a relief. I don’t want more than one me around. 😉

Has anyone done a systematic study of the “citizen science” interfaces? What appears to work better or worse?

Thanks!

SKOSsy – Thesauri on the fly!

Filed under: DBpedia,LOD,Thesaurus — Patrick Durusau @ 5:25 pm

SKOSsy – Thesauri on the fly!

From the webpage:

SKOSsy extracts data from LOD sources like DBpedia (and basically from any RDF based knowledge base you like) and works well for automatic text mining and whenever a seed thesaurus should be generated for a certain domain, organisation or a project.

If automatically generated thesauri are loaded into an editor like PoolParty Thesaurus Manager (PPT) you can start to enrich the knowledge model by additional concepts, relations and links to other LOD sources. With SKOSsy, thesaurus projects you don´t have to be started in the open countryside anymore. See also how SKOSsy is integrated into PPT.

  • SKOSsy makes heavy use of Linked Data sources, especially DBpedia
  • SKOSsy can generate SKOS thesauri for virtually any domain within a few minutes
  • Such thesauri can be improved, curated and extended to one´s individual needs but they serve usually as “good-enough” knowledge models for any semantic search application you like
  • SKOSsy thesauri serve as a basis for domain specific text extraction and knowledge enrichment
  • SKOSsy based semantic search usually outperform search algorithms based on pure statistics since they contain high-quality information about relations, labels and disambiguation
  • SKOSsy works perfectly together with PoolParty product family

DBpedia is probably closer to some user’s vocabulary than most formal ones. 😉

I have the sense that rather than asking experts for their semantics (and how to represent them), we are about to turn to users to ask about their semantics (and choose simple ways to represent them).

If results that are useful to the average user are the goal, it is a move in the right direction.

Create better SKOS vocabularies

Filed under: SKOS,Vocabularies — Patrick Durusau @ 5:10 pm

Create better SKOS vocabularies

From the webpage:

PoolParty SKOS Quality Checker allows you to perform automated quality checks on controlled vocabularies. You will receive a report of our findings.

This service is based on qSKOS and is able to make checks on over 20 quality issues.

You will organize uploaded vocabularies by giving a name for which you may provide different versions of the same vocabulary. This way you can easily track quality improvements over time.

You won’t need this for simple vocabularies (think schema.org) but could be useful for more complex vocabularies.

Blocking NSA’s Lawful Interception

Filed under: Cybersecurity,NSA,Security — Patrick Durusau @ 5:05 pm

Researcher describes ease to detect, derail and exploit NSA’s Lawful Interception by Violet Blue.

From the post:

While headlines from European hacking conference 30c3 featured speakers vying for U.S. National Security Agency revelation sensationalism, one notorious hacker delivered an explosive talk that dismantled one thing the NSA, law enforcement, and global intelligence agencies depend on: “Lawful Interception” systems.

And German researcher Felix “FX” Lindner did exactly that, in what was stealthily 30c3’s most controversial bombshell of the conference.

In a talk titled CounterStrike: Lawful Interception, Lindner explained to a standing-room-only theater of 3,000 hackers how easy it is to find out if you’re under legally imposed surveillance, detailing how easily a user can jam the shoddy legacy systems running Lawful Interception (LI).

In explaining how LI works, Lindner revealed the shocking lack of accountability in its implementation and the “perverted incentive situation of all parties involved” that makes it easy to perform interception of communications without any record left behind.
….

When you get past all the hype, “notorious,” “controversial bombshell,” “shocking,” “perverted,” etc. it is a good article and worth reading.

For your reading/viewing pleasure:

CounterStrike: Lawful Interception: Complete slide deck

YouTube: CounterStrike – Lawful Interception [30c3]

When debating NSA disclosures or ineffectual plans to curb the NSA, remember the security community’s “I’ve got a secret” game enabled the NSA and others.

I can’t say that was its intention but it certainly was the result.

Speculative Popcount Data Creation

Filed under: Patents,Sampling — Patrick Durusau @ 4:28 pm

Cognitive systems speculate on big data by Ravi Arimilli.

From the post:

Our brains don’t need to tell our lungs to breathe or our hearts to pump blood. Unfortunately, computers require instructions for everything they do. But what if machines could analyze big data and determine what to do, based on the content of the data, without specific instructions? Patent #8,387,065 establishes a way for computer systems to analyze data in a whole new way, using “speculative” population count (popcount) operations.

Popcount technology has been around for several years. It uses algorithms to pair down the number of traditional instructions a system has to run through to solve a problem. For example, if a problem takes 10,000 instructions to be solved using standard computing, popcount techniques can reduce the number of instructions by more than half.

This is how IBM Watson played Jeopardy! It did not need to be given instructions to look for every possible bit of data to answer a question. Its Power 7-based system used popcount operations to make assumptions about the domain of data in question, to come up with a real time answer.

Reading the patent: Patent #8,387,065, you will find this statement:

An actual method or mechanism by which the popcount is calculated is not described herein because the invention applies to any one of the various popcount algorithms that may be executed by CPU to determine a popcount. (under DETAILED DESCRIPTION OF AN ILLUSTRATIVE EMBODIMENT. There are no section/paragraph numbers, etc.)

IBM patented a process to house a sampling method without ever describing the sampling method. As Ben Stein would say: “wow.”

When I think of IBM patents, I think of eWeek’s IBM Patent: 100 Years of High-Tech Innovations top ten (10) list:

Sampling methods, just like naive Bayes classifiers, work if and only if certain assumptions are met. Naive Bayes classifiers assume all features are independent. Sampling methods, on the other hand, assume a data set is uniform. Meaning that a sample is an accurate reflection of an entire data set.

Uniformity is a chancy assumption because in order to confirm that is the right choice, you have to process data that sampling allows you to avoid.

There are methods to reduce the risks of sampling but it isn’t possible to tell from IBM’s “patent” in this case which of any of them are being used.

Algorithmic Music Discovery at Spotify

Filed under: Algorithms,Machine Learning,Matrix,Music,Music Retrieval,Python — Patrick Durusau @ 3:19 pm

Algorithmic Music Discovery at Spotify by Chris Johnson.

From the description:

In this presentation I introduce various Machine Learning methods that we utilize for music recommendations and discovery at Spotify. Specifically, I focus on Implicit Matrix Factorization for Collaborative Filtering, how to implement a small scale version using python, numpy, and scipy, as well as how to scale up to 20 Million users and 24 Million songs using Hadoop and Spark.

Among a number of interesting points, Chris points out differences between movie and music data.

One difference is that songs are consumed over and over again. Another is that users rate movies but “vote” by their streaming behavior on songs.*

While leads to Chris’ main point, implicit matrix factorization. Code. The source code page points to: Collaborative Filtering for Implicit Feedback Datasets by Yifan Hu, Yehuda Koren, and Chris Volinsky.

Scaling that process is represented in blocks for Hadoop and Spark.

* I suspect that “behavior” is more reliable than “ratings” from the same user. Reasoning ratings are more likely to be subject to social influences. I don’t have any research at my fingertips on that issue. Do you?

Home Invasion by Google

Filed under: Data Integration,Privacy,Transparency — Patrick Durusau @ 2:58 pm

When Google closes the Nest deal, privacy issues for the internet of things will hit the big time by Stacey Higginbotham.

From the post:

Google rocked the smart home market Monday with its intention to purchase connected home thermostat maker Nest for $3.2 billion, which will force a much-needed conversation about data privacy and security for the internet of things.

It’s a conversation that has seemingly stalled as advocates for the connected home expound upon the benefits in convenience, energy efficiency and even the health of people who are collecting and connecting their data and devices together through a variety of gadgets and services. On the other side are hackers and security researchers who warn how easy some of the devices are to exploit — gaining control of data or even video streams about what’s going on in the home.

So far the government, in the form of the Federal Trade Commission — has been reluctant to make rules and is still gathering information. A security research told the FTC at a Nov. 19 event that companies should be fined for data breaches, which would encourage companies to design data protection into their products from the beginning. Needless to say, industry representatives were concerned that such an approach would “stifle innovation.” Even at CES an FTC commissioner expressed a similar sentiment — namely that the industry was too young for rules.

Stacey writes a bit further down:

Google’s race to gather data isn’t evil, but it could be a problem

My assumption is that Google intends to use the data it is racing to gather. Google may not know or foresee all the potential uses for the data it collects (sales to the NSA?) but it has been said: “Data is the new oil.” Big Data Is Not the New Oil by Jer Thorp.

Think of Google as a successful data wildcatter, which in the oil patch resulted in heirs wealthy enough to attempt to corner the world silver market.

Don’t be mislead by Jer’s title, he means to decry the c-suite use of a phrase read on a newsstand cover. Later he writes:

Still, there are some ways in which the metaphor might be useful.

Perhaps the “data as oil” idea can foster some much-needed criticality. Our experience with oil has been fraught; fortunes made have been balanced with dwindling resources, bloody mercenary conflicts, and a terrifying climate crisis. If we are indeed making the first steps into economic terrain that will be as transformative (and possibly as risky) as that of the petroleum industry, foresight will be key. We have already seen “data spills” happen (when large amounts of personal data are inadvertently leaked). Will it be much longer until we see dangerous data drilling practices? Or until we start to see long term effects from “data pollution”?

An accurate account of our experience with oil, as far as it goes.

Unlike Jer, I see data continuing to follow the same path as oil, coal, timber, gold, silver, gemstones, etc.

I say continuing because scribes were the original data brokers. And enjoyed a privileged role in society. Printing reduced the power of scribes but new data brokers took their place. Libraries and universities and those they trained had more “data” than others. Specific examples of scientia potentia est (“knowledge is power”), are found in: The Information Master: Jean-Baptiste Colbert‘s Secret State Intelligence System (Louis XiV) and IBM and the Holocaust. (Not to forget the NSA.)

Information, or “data” if you prefer, has always been used to advance some interests and used against others. The electronic storage of data has reduced the cost of using data that was known to exist but was too expensive or inaccessible for use.

Consider marital history. For the most part, with enough manual effort and travel, a person’s marital history has been available for the last couple of centuries. Records are kept of marriages, divorces, etc. But accessing that information wasn’t a few strokes on a keyboard and perhaps an access fee. Same data, different cost of access.

Jer’s proposals and others I have read, are all premised on people foregoing power, advantage, profit or other benefits from obtaining, analyzing and acting upon data.

I don’t know of any examples in the history where that has happened.

Do you?
Access to State Supreme Court Data

Filed under: Government,Law,Law - Sources,Transparency — Patrick Durusau @ 10:10 am

Public access to the states’ highest courts: a report card

The post focuses on the Virginia Supreme Court, not surprisingly since it is the Open Virginia Law project.

But it also mentions Public Access to the States’ Highest Courts: A Report Card (PDF), which is a great summary of public access to state (United States) supreme court data. With hyperlinks to relevant resources.

The report card will definitely be of interest to law students, researchers, librarians, lawyers and even members of the public.

In addition to being a quick synopsis for public policy discussions, it makes a great hand list of state court resources.

An earlier blog post pointed out that the Virginia Supreme Court is now posting audio recordings of oral arguments.

Could be test data for speech recognition and other NLP tasks or used if you are simply short of white noise. 😉

January 13, 2014

Exploiting Parallelism and Scalability (XPS)

Filed under: HPC,Parallelism,Scalability — Patrick Durusau @ 8:10 pm

Exploiting Parallelism and Scalability (XPS) NSF

Full Proposal Window: February 10, 2014 – February 24, 2014

Synopsis:

Computing systems have undergone a fundamental transformation from the single-processor devices of the turn of the century to today’s ubiquitous and networked devices and warehouse-scale computing via the cloud. Parallelism is abundant at many levels. At the same time, semiconductor technology is facing fundamental physical limits and single processor performance has plateaued. This means that the ability to achieve predictable performance improvements through improved processor technologies alone has ended. Thus, parallelism has become critically important.

The Exploiting Parallelism and Scalability (XPS) program aims to support groundbreaking research leading to a new era of parallel computing. Achieving the needed breakthroughs will require a collaborative effort among researchers representing all areas– from services and applications down to the micro-architecture– and will be built on new concepts, theories, and foundational principles. New approaches to achieve scalable performance and usability need new abstract models and algorithms, new programming models and languages, new hardware architectures, compilers, operating systems and run-time systems, and must exploit domain and application-specific knowledge. Research is also needed on energy efficiency, communication efficiency, and on enabling the division of effort between edge devices and clouds.

The January 10th webinar for this activity hasn’t been posted yet.

Without semantics, XPS will establish a new metric:

GFS: Garbage per Femtosecond.

Multi level composite-id routing in SolrCloud

Filed under: Lucene,SolrCloud — Patrick Durusau @ 7:57 pm

Multi level composite-id routing in SolrCloud by Anshum Gupta.

From the post:

SolrCloud over the last year has evolved into a rather intelligent system with a lot of interesting and useful features going in. One of them has been the work for intelligent routing of documents and queries.

SolrCloud started off with a basic hash based routing in 4.0. It then got interesting with the composite id router being introduced with 4.1 which enabled smarter routing of documents and queries to achieve things like multi-tenancy and co-location. With 4.7, the 2-level composite id routing will be expanded to work for 3-levels (SOLR-5320).

A good post about how document routing generally works can be found here. Now, let’s look at how the composite-id routing extends to 3-levels and how we can really use it to query specific documents in our corpus.

An important thing to note here is that the 3-level router only extends the 2-level one. It’s the same router and the same java class i.e. you don’t really need to ‘set it up’.

Where would you want to use the multi-level composite-id router?

The multi-level implementation further extends the support for multi tenancy and co-location of documents provided by the already existing composite-id router. Consider a scenario where a single setup is used to host data for multiple applications (or departments) and each of them have a set of users. Each user further has documents associated with them. Using a 3-level composite-id router, a user can route the documents to the right shards at index time without having to really worry about the actual routing. This would also enable users to target queries for specific users or applications using the shard.keys parameter at query time.

Does that sound related to topic maps?

What if you remembered that “document” for Lucene means:

Documents are the unit of indexing and search. A Document is a set of fields. Each field has a name and a textual value. A field may be stored with the document, in which case it is returned with search hits on the document. Thus each document should typically contain one or more stored fields which uniquely identify it.

Probably not an efficient way to handle multiple identifiers but that depends on your use case.

The Art of Data Visualization (Spring 2014)

Filed under: Graphics,Visualization — Patrick Durusau @ 7:45 pm

The Art of Data Visualization (Spring 2014) by Kaiser Fung.

February 8, 2014 – March 29, 2014
Saturday
9:00AM – 12:00PM

Description:

Data visualization is storytelling in a graphical medium. The format of this course is inspired by the workshops used extensively to train budding writers, in which you gain knowledge by doing and redoing, by offering and receiving critique, and above all, by learning from each another. Present your project while other students offer critique and suggestions for improvement. The course offers immersion into the creative process, the discipline of sketching and revising, and the practical use of tools. Develop a discriminating eye for good visualizations. Readings on aspects of the craft are assigned throughout the term.

Kaiser is teaching this course at NYU’s School of Continuing and Professional Studies.

And yes, it is a physical presence offering.

If you follow Kaiser’s blog you know this is going to be a real treat.

Even if you can’t attend, pass this along to someone who can.

« Newer PostsOlder Posts »

Powered by WordPress