Another Word For It Patrick Durusau on Topic Maps and Semantic Diversity

October 17, 2013

Docear 1.0 (stable),…

Filed under: Annotation,PDF,Research Methods,Topic Maps — Patrick Durusau @ 1:03 pm

Docear 1.0 (stable), a new video, new manual, new homepage, new details page, … by Joeran Beel.

From the post:

It’s been almost two years since we released the first private Alpha of Docear and today, October 17 2013, Docear 1.0 (stable) is finally available for Windows, Mac, and Linux to download. We are really proud of what we accomplished in the past years and we think that Docear is better than ever. In addition to all the enhancements we made during the past years, we completely rewrote the manual with step-by-step instructions including an overview of supported PDF viewers, we changed the homepage, we created a new video, and we made the features & details page much more comprehensive. For those who already use Docear 1.0 RC4, there are not many changes (just a few bug fixes). For new users, we would like to explain what Docear is and what makes it so special.

Docear is a unique solution to academic literature management that helps you to organize, create, and discover academic literature. The three most distinct features of Docear are:

  1. A single-section user-interface that differs significantly from the interfaces you know from Zotero, JabRef, Mendeley, Endnote, … and that allows a more comprehensive organization of your electronic literature (PDFs) and the annotations you created (i.e highlighted text, comments, and bookmarks).
  2. A ‘literature suite concept’ that allows you to draft and write your own assignments, papers, theses, books, etc. based on the annotations you previously created.
  3. A research paper recommender system that allows you to discover new academic literature.

Aside from Docear’s unique approach, Docear offers many features more. In particular, we would like to point out that Docear is free, open source, not evil, and Docear gives you full control over your data. Docear works with standard PDF annotations, so you can use your favorite PDF viewer. Your reference data is directly stored as BibTeX (a text-based format that can be read by almost any other reference manager). Your drafts and folders are stored in Freeplane’s XML format, again a text-based format that is easy to process and understood by several other applications. And although we offer several online services such as PDF metadata retrieval, backup space, and online viewer, we do not force you to register. You can just install Docear on your computer, without any registration, and use 99% of Docear’s functionality.

But let’s get back to Docear’s unique approach for literature management…

Impressive “academic literature management” package!

I have done a lot of research over the years but unaided in large part by citation management software. Perhaps it is time to try a new approach.

Just scanning the documentation it does not appear that I can share my Docear annotations with another user.

Unless we were fortunate enough to have used the same terminology the same way while doing our research.

That is to say any research project I undertake will result in the building of a silo that is useful to me, but that others will have to duplicate.

If true, I just scanned the documentation, that is an observation and not a criticism.

I will keep track of my experience with a view towards suggesting changes that could make Docear more transparent.
October 16, 2013

Faunus & Titan 0.4.0 Released

Filed under: Faunus,Graphs,Titan — Patrick Durusau @ 6:59 pm

Faunus & Titan 0.4.0 Released by Dan LaRocque.

Dan’s post:

Aurelius is pleased to announce the release of Titan and Faunus 0.4.0.

This is a new major release which changes Titan’s client API, internal architecture, and storage format, and as such should be considered non-stable for now.

Downloads:

* https://github.com/thinkaurelius/titan/wiki/Downloads#titan-040-experimental-release

* https://github.com/thinkaurelius/faunus/wiki/Downloads

The artifacts have propagated to Maven Central, though they have yet to appear in the search index on search.maven.org.

New Titan features:

* MultiQuery, which speeds up traversal queries by an order of magnitude for common branching factors

* Initial Fulgora release with the introduction of an in-memory storage backend for Titan based on Hazelcast

* A new Persistit backend (special thanks to Blake Eggleston)

* Completely refactored query optimization and execution framework which makes query answering faster – in particular for GraphQuery

* Metrics integration for monitoring

* additional GraphQuery primitives and support in ElasticSearch and Lucene

* refactoring and deeper testing of the standard locking implementation

* redesigned type definition API

* much more

Titan 0.4.0 uses a new storage format which is incompatible with older versions of Titan. It also introduces backwards-incompatible API changes around type definition.

Titan release notes:

https://github.com/thinkaurelius/titan/wiki/Release-Notes#version-040-october-16-2013

Titan upgrade instructions:

https://github.com/thinkaurelius/titan/wiki/Upgrade-Instructions#version-040-october-16-2013

New Faunus features:

* Added FaunusRexsterExecutorExtension which allows remote execution of a Faunus script and tracking of its progress

* Global GremlinFaunus variables are now available in ScriptEngine use cases

* Simplified ResultHookClosure with new Gremlin 2.4.0 classes

* The variables hdfs and local are available to `gremlin.sh -e`

Faunus release notes:

https://github.com/thinkaurelius/faunus/wiki/Release-Notes

Both Faunus and Titan now support version 2.4.0 of the Tinkerpop stack, including Blueprints.

Both Faunus and Titan now require Java 7.

Thanks to everybody who contributed code and reported bugs in the 0.3.x series and helped us improve this release.

Enjoy!

Exploiting Discourse Analysis…

Filed under: Discourse,Language,Rhetoric,Temporal Semantic Analysis — Patrick Durusau @ 6:49 pm

Exploiting Discourse Analysis for Article-Wide Temporal Classification by Jun-Ping Ng, Min-Yen Kan, Ziheng Lin, Wei Feng, Bin Chen, Jian Su, Chew-Lim Tan.

Abstract:

In this paper we classify the temporal relations between pairs of events on an article-wide basis. This is in contrast to much of the existing literature which focuses on just event pairs which are found within the same or adjacent sentences. To achieve this, we leverage on discourse analysis as we believe that it provides more useful semantic information than typical lexico-syntactic features. We propose the use of several discourse analysis frameworks, including 1) Rhetorical Structure Theory (RST), 2) PDTB-styled discourse relations, and 3) topical text segmentation. We explain how features derived from these frameworks can be effectively used with support vector machines (SVM) paired with convolution kernels. Experiments show that our proposal is effective in improving on the state-of-the-art significantly by as much as 16% in terms of F1, even if we only adopt less-than-perfect automatic discourse analyzers and parsers. Making use of more accurate discourse analysis can further boost gains to 35%

Cutting edge of discourse analysis, which should be interesting if you are automatically populating topic maps based upon textual analysis.

It won’t be perfect, but even human editors are not perfect. (Or so rumor has it.)

A robust topic map system should accept, track and if approved, apply user submitted corrections and changes.

The LaTeX for Linguists Home Page

Filed under: Linguistics,TeX/LaTeX — Patrick Durusau @ 6:28 pm

The LaTeX for Linguists Home Page

From the webpage:

These pages provide information on how to use LaTeX for writing Linguistics papers (articles, books, etc.). In particular, they provide instructions and advice on creating the things Linguists standardly need, like trees, numbered examples, and so on, as well as advice on some things that most people need (like bibliographies), but with an eye to standard Linguistic practice.

Topic maps being a methodology to reconcile divergent uses of language, tools for the study of language seem like a close fit.

R Cheat Sheets

Filed under: R — Patrick Durusau @ 6:22 pm

R Cheat Sheets by Mark the Graph.

Basic

Brief Introduction to Language Elements and Control Structures

Data Frames

Basic List of Useful Functions

tRips and tRaps for new players

Vectors and Lists

Intermediate

Avoiding For-Loops

Factors

OOP and S3 Classes

Writing Functions

Advanced

Environments, Frames and the Call Stack

R5 Reference Classes

The only disadvantage to using someone else’s cheat sheet is that you miss the experience of making your own.

Which may be one of the primary reasons for taking the time and effort to create them.

But if you need a quick answer….

LIBMF: …

Filed under: Machine Learning,Matrix,Recommendation — Patrick Durusau @ 6:04 pm

LIBMF: A Matrix-factorization Library for Recommender Systems by Machine Learning Group at National Taiwan University.

From the webpage:

LIBMF is an open source tool for approximating an incomplete matrix using the product of two matrices in a latent space. Matrix factorization is commonly used in collaborative filtering. Main features of LIBMF include

  • In addition to the latent user and item features, we add user bias, item bias, and average terms for better performance.
  • LIBMF can be parallelized in a multi-core machine. To make our package more efficient, we use SSE instructions to accelerate the vector product operations.

    For a data sets of 250M ratings, LIBMF takes less then eight minutes to converge to a reasonable level.

  • Download

    The current release (Version 1.0, Sept 2013) of LIBMF can be obtained by downloading the zip file or tar.gz file.

    Please read the COPYRIGHT notice before using LIBMF.

    Documentation

    The algorithms of LIBMF is described in the following paper.

    Y. Zhuang, W.-S. Chin, Y.-C. Juan, and C.-J. Lin. A Fast Parallel SGD for Matrix Factorization in Shared Memory Systems. Proceedings of ACM Recommender Systems 2013.

    See README in the package for the practical use.

Being curious about what “practical use” would be in the README, ;-), I discovered a demo data set. And basic instructions for use.

For the details of application for recommendations, see the paper.

Announcing BioCoder

Filed under: Bioinformatics,Biology,Genomics — Patrick Durusau @ 5:08 pm

Announcing BioCoder by Mike Loukides.

From the post:

We’re pleased to announce BioCoder, a newsletter on the rapidly expanding field of biology. We’re focusing on DIY bio and synthetic biology, but we’re open to anything that’s interesting.

Why biology? Why now? Biology is currently going through a revolution as radical as the personal computer revolution. Up until the mid-70s, computing was dominated by large, extremely expensive machines that were installed in special rooms and operated by people wearing white lab coats. Programming was the domain of professionals. That changed radically with the advent of microprocessors, the homebrew computer club, and the first generation of personal computers. I put the beginning of the shift in 1975, when a friend of mine built a computer in his dorm room. But whenever it started, the phase transition was thorough and radical. We’ve built a new economy around computing: we’ve seen several startups become gigantic enterprises, and we’ve seen several giants collapse because they couldn’t compete with the more nimble startups.

Bioinformatics and amateur genome exploration is growing hobby area. Yes, hobby area.

For background, see: Playing with genes by David Smith.

Your bioinformatics skills, which you learned for cross-over use in other fields, could come in handy.

A couple of resources to get you started:

DYIgenomics

DYI Genomics

Seems like a ripe field for mining and organization.

There is no publication date set on Weaponized Viruses in a Nutshell.

Hadoop Tutorials – Hortonworks

Filed under: Hadoop,HCatalog,HDFS,Hive,Hortonworks,MapReduce,Pig — Patrick Durusau @ 4:49 pm

With the GA release of Hadoop 2, it seems appropriate to list a set of tutorials for the Hortonworks Sandbox.

Tutorial 1: Hello World – An Overview of Hadoop with HCatalog, Hive and Pig

Tutorial 2: How To Process Data with Apache Pig

Tutorial 3: How to Process Data with Apache Hive

Tutorial 4: How to Use HCatalog, Pig & Hive Commands

Tutorial 5: How to Use Basic Pig Commands

Tutorial 6: How to Load Data for Hadoop into the Hortonworks Sandbox

Tutorial 7: How to Install and Configure the Hortonworks ODBC driver on Windows 7

Tutorial 8: How to Use Excel 2013 to Access Hadoop Data

Tutorial 9: How to Use Excel 2013 to Analyze Hadoop Data

Tutorial 10: How to Visualize Website Clickstream Data

Tutorial 11: How to Install and Configure the Hortonworks ODBC driver on Mac OS X

Tutorial 12: How to Refine and Visualize Server Log Data

Tutorial 13: How To Refine and Visualize Sentiment Data

Tutorial 14: How To Analyze Machine and Sensor Data

By the time you finish these, I am sure there will be more tutorials or even proposed additions to the Hadoop stack!

(Updated December 3, 2013 to add #13 and #14.)

Apache Hadoop 2 is now GA!

Filed under: BigData,Hadoop,Hadoop YARN — Patrick Durusau @ 4:37 pm

Apache Hadoop 2 is now GA! by Arun Murthy.

From the post:

I’m thrilled to note that the Apache Hadoop community has declared Apache Hadoop 2.x as Generally Available with the release of hadoop-2.2.0!

This represents the realization of a massive effort by the entire Apache Hadoop community which started nearly 4 years to date, and we’re sure you’ll agree it’s cause for a big celebration. Equally, it’s a great credit to the Apache Software Foundation which provides an environment where contributors from various places and organizations can collaborate to achieve a goal which is as significant as Apache Hadoop v2.

Congratulations to everyone!
(emphasis in the original)

See Arun’s post for his summary of Hadoop 2.

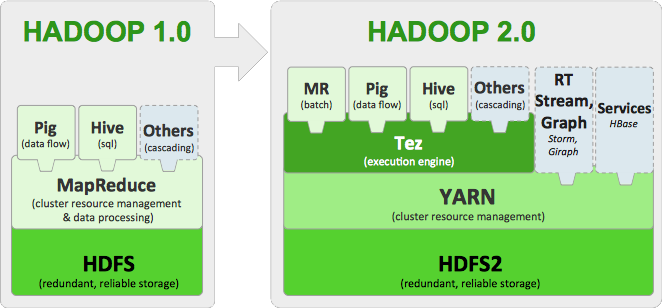
Take the following graphic I stole from his post as motivation to do so:

Hadoop Stack

Titanium

Filed under: Clojure,Graphs,Titan — Patrick Durusau @ 4:24 pm

Titanium

From the homepage:

Clojure library for using the Titan graph database, built on top of Archimedes and Ogre.

The Get Started! page is slightly more verbose:

This guide is meant to provide a quick taste of Titanium and all the power it provides. It should take about 10 minutes to read and study the provided code examples. The contents include:

  • What Titanium is
  • What Titanium is not
  • Clojure and Titan version requirements
  • How to include Titanium in your project
  • A very brief introduction to graph databases
  • How to create vertices and edges
  • How to find vertices again
  • How to execute simple queries
  • How to remove objects
  • Graph theory for smug lisp weenies

You may also like:

Read doc guides

Join the Mailing List (Google group)

Research Methodology [How Good Is Your Data?]

Filed under: Data Collection,Data Quality,Data Science — Patrick Durusau @ 3:42 pm

The presenters in a recent webinar took great pains to point out all the questions a user should be asking about data.

Questions like how representative a population was surveyed or how representative is the data, how were survey questions tested, selection biases, etc., it was like a flash back to empirical methodology in a political science course I took years ago.

It hadn’t occurred to me that some users of data (or “big data” if you prefer) might not have empirical methodology reflexes.

That would account for people who use Survey Monkey and think the results aren’t a reflection of themselves.

Doesn’t have to be. A professional survey person could use the same technology and possibly get valid results.

But the ability to hold a violin doesn’t mean you can play one.

Resources that you may find useful:

Political Science Scope and Methods

Description:

This course is designed to provide an introduction to a variety of empirical research methods used by political scientists. The primary aims of the course are to make you a more sophisticated consumer of diverse empirical research and to allow you to conduct advanced independent work in your junior and senior years. This is not a course in data analysis. Rather, it is a course on how to approach political science research.

Berinsky, Adam. 17.869 Political Science Scope and Methods, Fall 2010. (MIT OpenCourseWare: Massachusetts Institute of Technology), http://ocw.mit.edu/courses/political-science/17-869-political-science-scope-and-methods-fall-2010 (Accessed 16 Oct, 2013). License: Creative Commons BY-NC-SA

Qualitative Research: Design and Methods

Description:

This course is intended for graduate students planning to conduct qualitative research in a variety of different settings. Its topics include: Case studies, interviews, documentary evidence, participant observation, and survey research. The primary goal of this course is to assist students in preparing their (Masters and PhD) dissertation proposals.

Locke, Richard. 17.878 Qualitative Research: Design and Methods, Fall 2007. (MIT OpenCourseWare: Massachusetts Institute of Technology), http://ocw.mit.edu/courses/political-science/17-878-qualitative-research-design-and-methods-fall-2007 (Accessed 16 Oct, 2013). License: Creative Commons BY-NC-SA

Introduction to Statistical Method in Economics

Description:

This course is a self-contained introduction to statistics with economic applications. Elements of probability theory, sampling theory, statistical estimation, regression analysis, and hypothesis testing. It uses elementary econometrics and other applications of statistical tools to economic data. It also provides a solid foundation in probability and statistics for economists and other social scientists. We will emphasize topics needed in the further study of econometrics and provide basic preparation for 14.32. No prior preparation in probability and statistics is required, but familiarity with basic algebra and calculus is assumed.

Bennett, Herman. 14.30 Introduction to Statistical Method in Economics, Spring 2006. (MIT OpenCourseWare: Massachusetts Institute of Technology), http://ocw.mit.edu/courses/economics/14-30-introduction-to-statistical-method-in-economics-spring-2006 (Accessed 16 Oct, 2013). License: Creative Commons BY-NC-SA

Every science program, social or otherwise, will offer some type of research methods course. The ones I have listed are only the tip of a very large iceberg of courses and literature.

With a little effort you can acquire an awareness of what wasn’t said about data collection, processing or analysis.

October 15, 2013

3 Myths about graph query languages…

Filed under: Graphs,Gremlin,Hypergraphs,Query Language,TinkerPop — Patrick Durusau @ 8:31 pm

3 Myths about graph query languages. Busted by Pixy. by Sridhar Ramachandran.

A very short slide deck that leaves you wanting more information.

It got my attention because I didn’t know there were any myths about graph query languages. 😉

I think the sense of “myth” here is more “misunderstanding” or simply “incorrect information.”

Some references that may be helpful while reading these slides:

I must confess that “Myth #3: GQLs [Graph Query Languages] can’t be relational” has always puzzled me.

In part because hypergraphs have been used to model databases for quite some time.

For example:

Making use of arguments from information theory it is shown that a boolean function can represent multivalued dependencies. A method is described by which a hypergraph can be constructed to represent dependencies in a relation. A new normal form called generalized Boyce-Codd normal form is defined. An explicit formula is derived for representing dependencies that would remain in a projection of a relation. A definition of join is given which makes the derivation of many theoretical results easy. Another definition given is that of information in a relation. The information gets conserved whenever lossless decompositions are involved. It is shown that the use of null elements is important in handling data.

Would you believe: Some analytic tools for the design of relational database systems by K. K. Nambiar in 1980?

So far as I know, hypergraphs are a form of graph so it isn’t true that “graphs can only express binary relations/predicates.”

One difference (there are others) is that a hypergraph database doesn’t require derivation of relationships because those relationships are already captured by a hyperedge.

Moreover, a vertex can (whether it “may” or not in a particular hypergraph is another issue) be a member of more than one hyperedge.

Determination of common members becomes a straight forward query as opposed to two or more derivations of associations and then calculation of any intersection.

For all of that, it remains important as notice of a new declarative graph query language (GQL).

DatumBox

Filed under: Machine Learning — Patrick Durusau @ 8:01 pm

DatumBox

From the webpage:

Datumbox offers a large number of off-the-shelf Classifiers and Natural Language Processing services which can be used in a broad spectrum of applications including: Sentiment Analysis, Topic Classification, Language Detection, Subjectivity Analysis, Spam Detection, Reading Assessment, Keyword and Text Extraction and more. All services are accessible via our powerful REST API which allows you to develop your own smart Applications in no time.

I am taking a machine learning course based on Weka and that may be why this service caught my eye.

Particularly the part that reads:

Datumbox eliminates the complex and time consuming process of designing and training Machine Learning models. Our service gives you access to classifiers that can be directly used in your software.

I would agree that designing from scratch a machine learning model would be a time consuming task. And largely unnecessary for most applications in light of the large number of machine learning models that are already available.

However, I’m not sure how any machine learning model is going to avoid training? At least if it is going to provide you with meaningful results.

Still, it is a free service so I am applying for an API key and will report back with more details.

Diving into Clojure

Filed under: Clojure,Lisp,Programming — Patrick Durusau @ 7:44 pm

Diving into Clojure

A collection of Clojure resources focused on “people who want to start learning Clojure.”

There are a number of such collections on the Net.

It occurs to me that it would be interesting to mine a data set like Common Crawl for Clojure resources.

Deduping the results but retaining the number of references to each resource for ranking purposes.

That could be a useful resource.

Particularly if all the cited resources were retrieved, indexed, mapped and burned to a DVD as conference swag.

Sentiment Analysis and “Human Analytics” (Conference)

Filed under: Conferences,Sentiment Analysis — Patrick Durusau @ 7:27 pm

Call for Speakers: Sentiment Analysis and “Human Analytics” (March 6, NYC) by Seth Grimes.

Call for Speakers: Closes October 28, 2013.

Symposium: March 6, 2014 New York City.

From the post:

Sentiment, mood, opinion, and emotion play a central role in social and online media, enterprise feedback, and the range of consumer, business, and public data sources. Together with connection, expressed as influence and advocacy in and across social and business networks, they capture immense business value.

“Human Analytics” solutions unlock this value and are the focus of the next Sentiment Analysis Symposium, March 6, 2014 in New York. The Call for Speakers is now open, through October 28.

The key to a great conference is great speakers. Whether you’re a business visionary, experienced user, or technologist, please consider proposing a presentation. Submit your proposal at sentimentsymposium.com/call-for-speakers.html. Choose from among the suggested topics or surprise us.

The New York symposium will be the 7th, covering solutions that measure and exploit emotion, attitude, opinion, and connection in online, social, and enterprise sources. It will be a great program… with your participation!

(For those not familiar with the symposium: Check out FREE videos of presentations and panels from the May, 2013 New York symposium and from prior symposiums.)

More conference material for your enjoyment!

As you know, bot traffic accounts for a large percentage of tweets but if the customer wants sentiment analysis of bots trading tweets, why not?

Opens an interesting potential of botnets, not in a malicious sense but that are organized to simulate public dialogue on current issues.

Measuring the Evolution of Ontology Complexity:…

Filed under: Evoluntionary,Ontology — Patrick Durusau @ 7:04 pm

Measuring the Evolution of Ontology Complexity: The Gene Ontology Case Study by Olivier Dameron, Charles Bettembourg, Nolwenn Le Meur. (Dameron O, Bettembourg C, Le Meur N (2013) Measuring the Evolution of Ontology Complexity: The Gene Ontology Case Study. PLoS ONE 8(10): e75993. doi:10.1371/journal.pone.0075993)

Abstract:

Ontologies support automatic sharing, combination and analysis of life sciences data. They undergo regular curation and enrichment. We studied the impact of an ontology evolution on its structural complexity. As a case study we used the sixty monthly releases between January 2008 and December 2012 of the Gene Ontology and its three independent branches, i.e. biological processes (BP), cellular components (CC) and molecular functions (MF). For each case, we measured complexity by computing metrics related to the size, the nodes connectivity and the hierarchical structure.

The number of classes and relations increased monotonously for each branch, with different growth rates. BP and CC had similar connectivity, superior to that of MF. Connectivity increased monotonously for BP, decreased for CC and remained stable for MF, with a marked increase for the three branches in November and December 2012. Hierarchy-related measures showed that CC and MF had similar proportions of leaves, average depths and average heights. BP had a lower proportion of leaves, and a higher average depth and average height. For BP and MF, the late 2012 increase of connectivity resulted in an increase of the average depth and average height and a decrease of the proportion of leaves, indicating that a major enrichment effort of the intermediate-level hierarchy occurred.

The variation of the number of classes and relations in an ontology does not provide enough information about the evolution of its complexity. However, connectivity and hierarchy-related metrics revealed different patterns of values as well as of evolution for the three branches of the Gene Ontology. CC was similar to BP in terms of connectivity, and similar to MF in terms of hierarchy. Overall, BP complexity increased, CC was refined with the addition of leaves providing a finer level of annotations but decreasing slightly its complexity, and MF complexity remained stable.

Prospective ontology authors and ontology authors need to read this paper carefully.

Over a period of only four years, the ontologies studied in this paper evolved.

Which is a good thing, because the understandings that underpinned the original ontologies changed over those four years.

The lesson here being that for all of their apparent fixity, a useful ontology is no more fixed than authors who create and maintain it and the users who use it.

At any point in time an ontology may be “fixed” for some purpose or in some view, but that is a snapshot in time, not an eternal view.

As ontologies evolve, so must the mappings that bind them with and to other ontologies.

A blind mapping, simple juxtaposition of terms from ontologies is one form of mapping. A form that makes maintenance a difficult and chancy affair.

If on the other hand, each term had properties that supported the recorded mapping, any maintainer could follow enunciated rules for maintenance of that mapping.

Blind mapping: Pay the cost of mapping every time ontology mappings become out of synchronization enough to pinch (or lead to disaster).

Sustainable mapping: Pay the full cost of mapping once and then maintain the mapping.

What’s your comfort level with risk?

  • Discovery of a “smoking gun” memo on tests of consumer products.
  • Inappropriate access to spending or financial records.
  • Preservation of inappropriate emails.
  • etc.

What are you not able to find with an unmaintained ontology?

Nearest Neighbor Search in Google Correlate

Filed under: Algorithms,Google Correlate,Nearest Neighbor — Patrick Durusau @ 6:41 pm

Nearest Neighbor Search in Google Correlate by Dan Vanderkam, Rob Schonberger, Henry Rowley, Sanjiv Kumar.

Abstract:

This paper presents the algorithms which power Google Correlate, a tool which finds web search terms whose popularity over time best matches a user-provided time series. Correlate was developed to generalize the query-based modeling techniques pioneered by Google Flu Trends and make them available to end users.

Correlate searches across millions of candidate query time series to find the best matches, returning results in less than 200 milliseconds. Its feature set and requirements present unique challenges for Approximate Nearest Neighbor (ANN) search techniques. In this paper, we present Asymmetric Hashing (AH), the technique used by Correlate, and show how it can be adapted to the specific needs of the product.

We then develop experiments to test the throughput and recall of Asymmetric Hashing as compared to a brute-force search. For “full” search vectors, we achieve a 10x speedup over brute force search while maintaining 97% recall. For search vectors which contain holdout periods, we achieve a 4x speedup over brute force search, also with 97% recall. (I followed the paragraphing in the PDF for the abstract.)

Ten-x speedups on Google Flu Trends size data sets are non-trivial.

If you are playing in that size sand box, this is a must read.

How to design better data visualisations

Filed under: Graphics,Perception,Psychology,Visualization — Patrick Durusau @ 6:25 pm

How to design better data visualisations by Graham Odds.

From the post:

Over the last couple of centuries, data visualisation has developed to the point where it is in everyday use across all walks of life. Many recognise it as an effective tool for both storytelling and analysis, overcoming most language and educational barriers. But why is this? How are abstract shapes and colours often able to communicate large amounts of data more effectively than a table of numbers or paragraphs of text? An understanding of human perception will not only answer this question, but will also provide clear guidance and tools for improving the design of your own visualisations.

In order to understand how we are able to interpret data visualisations so effectively, we must start by examining the basics of how we perceive and process information, in particular visual information.

Graham pushes all of my buttons by covering:

A reading list from this post would take months to read and years to fully digest.

No time like the present!

9th International Digital Curation Conference

Filed under: Conferences,Curation,Digital Research — Patrick Durusau @ 5:57 pm

Commodity, catalyst or change-agent? Data-driven transformations in research, education, business & society.

From the post:

24 – 27 February 2014
Omni San Francisco Hotel, San Francisco

Overview

#idcc14

The 9th International Digital Curation Conference (IDCC) will be held from Monday 24 February to Thursday 27 February 2014 at the Omni San Francisco Hotel (at Montgomery).

The Omni hotel is in the heart of downtown San Francisco. It is located right on the cable car line and is only a short walk to Union Square, the San Francisco neighborhood that has become a mecca for high-end shopping and art galleries.

This year the IDCC will focus on how data-driven developments are changing the world around us, recognising that the growing volume and complexity of data provides institutions, researchers, businesses and communities with a range of exciting opportunities and challenges. The Conference will explore the expanding portfolio of tools and data services, as well as the diverse skills that are essential to explore, manage, use and benefit from valuable data assets. The programme will reflect cultural, technical and economic perspectives and will illustrate the progress made in this arena in recent months

There will be a programme of workshops on Monday 24 and Thursday 27 February. The main conference programme will run from Tuesday 25 – Wednesday 26 February.

Registration will open in October (but it doesn’t say when in October).

While you are waiting:

Our last IDCC took place in Amsterdam, 14-17 January 2013. If you were not able to attend you can now access all the presentations, videos and photos online, and much more!

Enjoy!

a Google example: preattentive attributes

Filed under: Interface Research/Design,Perception,Visualization — Patrick Durusau @ 4:30 pm

a Google example: preattentive attributes

From the post:

The topic of my short preso at the visual.ly meet up last week in Mountain View was preattentive attributes. I started by discussing exactly what preattentive attributes are (those aspects of a visual that our iconic memory picks up, like color, size, orientation, and placement on page) and how they can be used strategically in data visualization (for more on this, check out my last blog post). Next, I talked through a Google before-and-after example applying the lesson, which I’ll now share with you here.

Preattentive attributes.

Now there is a concept to work into interface/presentation design!

Would its opposite be:

Counter-intuitive attributes?

Are you using “preattentive attributes” in interfaces/presentations or do you rely on what you find intuitive/transparent?

I first saw this cited at Chart Porn.

The science behind data visualisation

Filed under: Perception,Visualization — Patrick Durusau @ 4:16 pm

The science behind data visualisation

From the post:

Over the last couple of centuries, data visualisation has developed to the point where it is in everyday use across all walks of life. Many recognise it as an effective tool for both storytelling and analysis, overcoming most language and educational barriers. But why is this? How are abstract shapes and colours often able to communicate large amounts of data more effectively than a table of numbers or paragraphs of text? An understanding of human perception will not only answer this question, but will also provide clear guidance and tools for improving the design of your own visualisations.

In order to understand how we are able to interpret data visualisations so effectively, we must start by examining the basics of how we perceive and process information, in particular visual information.

A great summary of work on human perception of visualizations.

How you visualize data will impact how quickly (if at all) others “understand” the visualization and what conclusions they will draw from it.

One of the classic papers cited by the author is: Graphical Perception: Theory, Experimentation, and Application to the Development of Graphical Methods. William S. Cleveland; Robert McGill (PDF)

I first saw this at Chart Porn.

October 14, 2013

Astrophysics Source Code Library…

Filed under: Algorithms,Astroinformatics,Programming,Software — Patrick Durusau @ 4:25 pm

Astrophysics Source Code Library: Where do we go from here? by Ms. Alice Allen.

From the introduction:

This week I am featuring a guest post by Ms. Alice Allen, the Editor of the the Astrophysics Source Code Library, an on-line index of codes used in astronomical research and that have been referenced in peer-reviewed journal articles. The post is essentially a talk given by Ms. Allen at the recent ADASS XXIII meeting. The impact of the ASCL is growing – a poster by Associate Editor Kim DuPrie at ADASS XXIII showed that there are now 700+ codes indexed, and quarterly page views have quadrupled from Q1/2011 to 24,ooo. Researchers are explicitly citing the code in papers that use the software, the ADS is linking software to papers about the code, and the ASCL is sponsoring workshops and discussion forums to identify obstacles to code sharing and propose solutions. And now, over to you, Alice: (emphasis in original)

Alice describes “success” as:

Success for us is this: you read a paper, want to see the code, click a link or two, and can look at the code for its underlying assumptions, methods, and computations. Alternately, if you want to investigate an unfamiliar domain, you can peruse the ASCL to see what codes have been written in that area.

Imagine having that level of “success” for data sets or data extraction source code.

Data Science Association

Filed under: Data Science — Patrick Durusau @ 3:24 pm

Data Science Association

From the homepage:

The Data Science Association is a non-profit professional group that offers education, professional certification, a “Data Science Code of Professional Conduct” and conferences / meetups to discuss data science (e.g. predictive / prescriptive analytics, algorithm design and execution, applied machine learning, statistical modeling, and data visualization). Our members are professionals, students, researchers, academics and others with a deep interest in data science and related technologies.

From the news/blog it looks like the Data Science Association came online in late March of 2013.

Rather sparse in terms of resources, although there is a listing of videos of indeterminate length. I say “indeterminate length” because on FireFox, Chrome and IE running on a virtual box, the video listing does not scroll. It appear to have content located below the bottom of my screen. I checked that by reducing the browser window and yes, there is content “lower” down on the list.

The code of conduct is quite long but I thought you might be interested in the following passages:

(g) A data scientist shall use reasonable diligence when designing, creating and implementing algorithms to avoid harm. The data scientist shall disclose to the client any real, perceived or hidden risks from using the algorithm. After full disclosure, the client is responsible for making the decision to use or not use the algorithm. If a data scientist reasonably believes an algorithm will cause harm, the data scientist shall take reasonable remedial measures, including disclosure to the client, and including, if necessary, disclosure to the proper authorities. The data scientist shall take reasonable measures to persuade the client to use the algorithm appropriately.

(h) A data scientist shall use reasonable diligence when designing, creating and implementing machine learning systems to avoid harm. The data scientist shall disclose to the client any real, perceived or hidden risks from using a machine learning system. After full disclosure, the client is responsible for making the decision to use or not use the machine learning system. If a data scientist reasonably believes the machine learning system will cause harm, the data scientist shall take reasonable remedial measures, including disclosure to the client, and including, if necessary, disclosure to the proper authorities. The data scientist shall take reasonable measures to persuade the client to use the machine learning system appropriately.

I would much prefer Canon 4: A Lawyer Should Preserve The Confidences And Secrets of a Client:

EC 4-1

Both the fiduciary relationship existing between lawyer and client and the proper functioning of the legal system require the preservation by the lawyer of confidences and secrets of one who has employed or sought to employ the lawyer. A client must feel free to discuss anything with his or her lawyer and a lawyer must be equally free to obtain information beyond that volunteered by the client. A lawyer should be fully informed of all the facts of the matter being handled in order for the client to obtain the full advantage of our legal system. It is for the lawyer in the exercise of independent professional judgment to separate the relevant and important from the irrelevant and unimportant. The observance of the ethical obligation of a lawyer to hold inviolate the confidences and secrets of a client not only facilitates the full development of facts essential to proper representation of the client but also encourages non-lawyers to seek early legal assistance. (NEW YORK LAWYER’S CODE OF PROFESSIONAL RESPONSIBILITY)

You could easily fit “data scientist” and “data science” as appropriate in that passage.

Playing the role of Jiminy Cricket or moral conscience of a client seems problematic to me.

In part because there are professionals, priests, rabbis, imans, ministers who are better trained to recognize and counsel on moral issues.

But in part because of the difficulty of treating all clients equally. Are you more concerned about the “harm” that may be done by a client of Middle Eastern extraction than one from New York (Timothy McVeigh)?

Or putting in extra effort to detect “harm” because the government doesn’t like someone?

Personally I think the government has too many snitches and/or potential snitches as it is. Data scientists should not be too quick to join that crowd.

Diagrams for hierarchical models – we need your opinion

Filed under: Bayesian Data Analysis,Bayesian Models,Graphics,Statistics — Patrick Durusau @ 10:49 am

Diagrams for hierarchical models – we need your opinion by John K. Kruschke.

If you haven’t done any good deeds lately, here is a chance to contribute to the common good.

From the post:

When trying to understand a hierarchical model, I find it helpful to make a diagram of the dependencies between variables. But I have found the traditional directed acyclic graphs (DAGs) to be incomplete at best and downright confusing at worst. Therefore I created differently styled diagrams for Doing Bayesian Data Analysis (DBDA). I have found them to be very useful for explaining models, inventing models, and programming models. But my idiosyncratic impression might be only that, and I would like your insights about the pros and cons of the two styles of diagrams. (emphasis in original)

John’s post has the details of the different diagram styles.

Which do you like better?

John is also the author of: Doing Bayesian data analysis : a tutorial with R and BUGS. My library system doesn’t have a copy but I can report that it has gotten really good reviews.

Findability As Value Proposition

Filed under: Marketing,Topic Maps — Patrick Durusau @ 10:33 am

Seth Maislin has some interesting statistics on findability as a value proposition:

Findability is something most people are willing to pay for. One industry estimate suggests that 14% of our workdays are spent looking for information; others say it’s more like 23%, 25%, 30%, or even 35%. IBM suggests that 42% of people use wrong information to make decisions, while IDC suggests that 40% of corporate users can’t find the information they need at all – and that 50% of intranet searches are abandoned. This is the world into which every document is born. Improving findability with a user-focused information strategy can give all of your documents a huge boost in value – or, if you prefer, those few documents you think deserve special treatment. Remember: If you can’t find it, you might as well not have it. (From: Improving the Value of Fixed Content.

I rather like his conclusion:

“Remember: If you can’t find it, you might as well not have it.”

To make the numbers more concrete, chart your prospective client’s payroll hours X 14%, 23%, 25%, 30% and 35%.

That should be a real eye opener!

The survey I have not seen though is one that tracks how many employees are searching for the same information.

A “many employees searching for the same information” number would be valuable for two reasons:

  1. It would quantify how much duplicate search effort a topic map could eliminate, and
  2. The information area they are searching would be the logical focus of topic mapping efforts. Why topic map ten year old corporate minutes that no one ever searches for?

Seth mentions a webinar on precise search results:

“Attend our upcoming webinar on October 23, Driving Knowledge-Worker Performance with Precision Search Results, which is likely to address many of these ideas!”

The webinar is described as:

Intended for a non-technical audience, this webinar will focus on how to identify and prioritize where these solutions can deliver value.

If nothing else, you may pick up some good examples and rhetoric on the value of better search capabilities.

October 13, 2013

Eurostat regional yearbook 2013 [PDF as Topic Map Interface?]

Filed under: EU,Government,Interface Research/Design,Statistics — Patrick Durusau @ 9:02 pm

Eurostat regional yearbook 2013

From the webpage:

Statistical information is an important tool for understanding and quantifying the impact of political decisions in a specific territory or region. The Eurostat regional yearbook 2013 gives a detailed picture relating to a broad range of statistical topics across the regions of the Member States of the European Union (EU), as well as the regions of EFTA and candidate countries. Each chapter presents statistical information in maps, figures and tables, accompanied by a description of the main findings, data sources and policy context. These regional indicators are presented for the following 11 subjects: economy, population, health, education, the labour market, structural business statistics, tourism, the information society, agriculture, transport, and science, technology and innovation. In addition, four special focus chapters are included in this edition: these look at European cities, the definition of city and metro regions, income and living conditions according to the degree of urbanisation, and rural development.

The Statistical Atlas is an interactive map viewer, which contains statistical maps from the Eurostat regional yearbook and provides the possibility to download these maps as high-resolution PDFs.

PDF version of the Eurostat regional yearbook 2013

But this isn’t a dead PDF file:

Under each table, figure or map in all Eurostat publications you will find hyperlinks with Eurostat online data codes, allowing easy access to the most recent data in Eurobase, Eurostat’s online database. A data code leads to either a two- or three-dimensional table in the TGM (table, graph, map) interface or to an open dataset which generally contains more dimensions and longer time series using the Data Explorer interface (3). In the Eurostat regional yearbook, these online data codes are given as part of the source below each table, figure and map.

In the PDF version of this publication, the reader is led directly to the freshest data when clicking on the hyperlinks for Eurostat online data codes. Readers of the printed version can access the freshest data by typing a standardised hyperlink into a web browser, for example:

http://ec.europa.eu/eurostat/product?code=&mode=view, where is to be replaced by the online data code in question.

A great data collection for anyone interested in the EU.

Take particular note of how delivery in PDF format does not preclude accessing additional information.

I assume that would extend to topic map-based content as well.

Where there is a tradition of delivery of information in a particular form, why would you want to change it?

Or to put it differently, what evidence is there of a pay-off from another form of delivery?

Noting that I don’t consider hyperlinks to be substantively different from other formal references.

Formal references are a staple of useful writing, albeit hyperlinks (can) take less effort to follow.

October 12, 2013

Sixth International Joint Conference on Natural Language Processing (Papers)

Filed under: Natural Language Processing — Patrick Durusau @ 7:32 pm

Proceedings of the Sixth International Joint Conference on Natural Language Processing

Not counting the system demonstration papers, one hundred and ninety-seven (197) papers on natural language processing!

Any attempt to summarize the collection would be unfair.

I will be going over the proceeding for papers that look particularly useful for topic maps.

I would appreciate your suggesting your favorites or even better yet, writing/blogging about your favorites and sending me a link.

Happy reading!

NYCPedia

Filed under: Encyclopedia,Linked Data — Patrick Durusau @ 7:21 pm

NYCPedia

From the about page:

NYCpedia is a new data encyclopedia about New York City.

This is a beta preview, so bear with us as we work out the bugs, add tons more features and add new data.

NYCpedia is organized so you can search for information about a borough, neighborhood, or zip code. From there you can find insights about jobs, education, healthy living, real estate, transportation and more. We pull up-to-date information from open data sources and link it up so it’s easier to explore, but you can always check out the original source. We are constantly looking to add new data sources, so if you know of a great dataset that should be in NYCpedia, let us know.

Need data services for your NYC-based business, non-profit, or academic institution? Contact us to find out how you can link your organization’s data to NYCpedia.

Based on the PediaCities platform, whose about page says:

Ontodia created the PediaCities platform to curate, organize, and link data about cities. Check out our first PediaCities knowledgebase at NYCpedia.com for a demonstration of what clean linked data looks like. Ontodia was founded in 2012 by Joel Natividad and Sami Baig following their success at NYCBigApps 3.0, where they won the Grand Prize for NYCFacets. The PediaCities platform, with NYCpedia as the first PediaCity, is our attempt to add value on top of NYC’s incredible open data ecosystem.

I was disappointed until I got deep enough in the map.

Try: http://nyc.pediacities.com/Resource/CommunityStats/10006, which is the 10006 zip code.

It’s clean, easy to navigate, not all the data possible but targeted at the usual user.

I suspect a fairly homogeneous data set but I can’t say for sure.

Probably because it is in beta, there did not appear to be any non-English interfaces? Would suspect that is going to be an early added feature if it isn’t already on the development map.

BTW, if you are interested in data from New York City, try NYC Open Data with over 1100 data sets currently available.

October 11, 2013

Security Patch Bounties!

Filed under: Cybersecurity,NSA,Programming,Security,Software — Patrick Durusau @ 6:17 pm

Google Offers New Bounty Program For Securing Open-Source Software by Kelly Jackson Higgins.

From the post:

First there was the bug bounty, and now there’s the patch bounty: Google has launched a new program that pays researchers for security fixes to open-source software.

The new experimental program offers rewards from $500 to $3,133.70 for coming up with security improvements to key open-source software projects. It is geared to complement Google’s bug bounty program for Google Web applications and Chrome.

Google’s program initially will encompass network services OpenSSH, BIND, ISC DHCP; image parsers libjpeg, libjpeg-turbo, libpng, giflib; Chromium and Blink in Chrome; libraries for OpenSSh and zlib; and Linux kernel components, including KVM. Google plans to next include Web servers Apache httpd, lighttpd, ngix; SMTP services Sendmail, Postfix, Exim; and GCC, binutils, and llvm; and OpenVPN.

Industry concerns over security flaws in open-source code have escalated as more applications rely on these components. Michal Zalewski of the Google Security Team says the search engine giant initially considered a bug bounty program for open-source software, but decided to provide financial incentives for better locking down open-source code.

“We all benefit from the amazing volunteer work done by the open-source community. That’s why we keep asking ourselves how to take the model pioneered with our Vulnerability Reward Program — and employ it to improve the security of key third-party software critical to the health of the entire Internet,” Zalewski said in a blog post. “We thought about simply kicking off an OSS bug-hunting program, but this approach can easily backfire. In addition to valid reports, bug bounties invite a significant volume of spurious traffic — enough to completely overwhelm a small community of volunteers. On top of this, fixing a problem often requires more effort than finding it.”

So Google went with offering money for improving the security of open-source software “that goes beyond merely fixing a known security bug,” he blogged. “Whether you want to switch to a more secure allocator, to add privilege separation, to clean up a bunch of sketchy calls to strcat(), or even just to enable ASLR – we want to help.”

The official rules include this statement:

Reactive patches that merely address a single, previously discovered vulnerability will typically not be eligible for rewards.

I read that to mean that hardening the security of the covered projects may qualify for an award (must be accepted by the project first).

I wonder if Google will consider a bonus if the patch repairs an NSA induced security weakness?

What’s Your Elevator Speech for Topic Maps?

Filed under: Marketing,Topic Maps — Patrick Durusau @ 6:01 pm

I ask because Sam Hunting uncovered and posted a note about: How to Write an Elevator Pitch by Babak Nivi.

See the post for the template but be mindful of this comment from the post:

Your e-mail should be no longer than this example, which is already too long. Challenge yourself to keep the pitch under 100 words. And keep the product description brief — this pitch describes the product in one paragraph with 29 words.

100 words!? I don’t think I can introduce Steve Newcomb in less than 100 words. 😉

I don’t have a 100 word topic map pitch, at least not yet.

Look for an early cut on one sometime next week.

Start polishing yours because that is going to be my next question.

« Newer PostsOlder Posts »

Powered by WordPress