Another Word For It Patrick Durusau on Topic Maps and Semantic Diversity

April 6, 2013

Data-Plundering at Amazon

Filed under: Cybersecurity,Marketing,Security,Topic Maps — Patrick Durusau @ 10:52 am

Amazon S3 storage buckets set to ‘public’ are ripe for data-plundering by Ted Samson.

From the post:

Using a combination of relatively low-tech techniques and tools, security researchers have discovered that they can access the contents of one in six Amazon Simple Storage Service (S3) buckets. Those contents range from sales records and personal employee information to source code and unprotected database backups. Much of the data could be used to stage a network attack, to compromise users accounts, or to sell on the black market.

All told, researchers managed to discover and explore nearly 2,000 buckets from which they gathered a list of more than 126 billion files. They reviewed over 40,000 publicly visible files, many of which contained sensitive information, according to Rapid 7 Senior Security Consultant Will Vandevanter.

….

The root of the problem isn’t a security hole in Amazon’s storage cloud, according to Vandevanter. Rather, he credited Amazon S3 account holders who have failed to set their buckets to private — or to put it more bluntly, organizations that have embraced the cloud without fully understanding it. The fact that all S3 buckets have predictable, publically accessible URLs doesn’t help, though.

That was close!

From the headline I thought Chinese government hackers had carelessly left Amazon S3 storage buckets open after downloading. 😉

If you want an even lower tech technique for hacking into your network, try the following (with permission):

Call users from your internal phone system and say system passwords have been stolen and IT will monitor all logins for 72 hours. To monitor access, IT needs users logins and passwords to put tracers on accounts. Could make the difference in next quarter earnings being up or being non-existent.

After testing, are you in more danger from your internal staff than external hackers?

As you might suspect, I would be using a topic map to provide security accountability across both IT and users.

With the goal of assisting security risks to become someone else’s security risks.

K-Nearest Neighbors: dangerously simple

Filed under: Data Mining,K-Nearest-Neighbors,Marketing,Topic Maps — Patrick Durusau @ 10:31 am

K-Nearest Neighbors: dangerously simple by Cathy O’Neil.

From the post:

I spend my time at work nowadays thinking about how to start a company in data science. Since there are tons of companies now collecting tons of data, and they don’t know what do to do with it, nor who to ask, part of me wants to design (yet another) dumbed-down “analytics platform” so that business people can import their data onto the platform, and then perform simple algorithms themselves, without even having a data scientist to supervise.

After all, a good data scientist is hard to find. Sometimes you don’t even know if you want to invest in this whole big data thing, you’re not sure the data you’re collecting is all that great or whether the whole thing is just a bunch of hype. It’s tempting to bypass professional data scientists altogether and try to replace them with software.

I’m here to say, it’s not clear that’s possible. Even the simplest algorithm, like k-Nearest Neighbor (k-NN), can be naively misused by someone who doesn’t understand it well. Let me explain.

The devil is all in the detail of what you mean by close. And to make things trickier, as in easier to be deceptively easy, there are default choices you could make (and which you would make) which would probably be totally stupid. Namely, the raw numbers, and Euclidean distance.

Read and think about Cathy’s post.

All those nice, clean, clear number values and a simple math equation, muddied by meaning.

Undocumented meaning.

And undocumented relationships between the variables the number values represent.

You could document your meaning and the relationships between variables and still make dumb decisions.

The hope is you or your successor will use documented meaning and relationships to make better decisions.

For documentation you can:

  • Try to remember the meaning of “close” and the relationships for all uses of K-Nearest Neighbors where you work.
  • Write meaning and relationships down on sticky notes collected in your desk draw.
  • Write meaning and relationships on paper or in electronic files, the latter somewhere on the server.
  • Document meaning and relationships with a topic map, so you can leverage on information already known. Including identifiers for the VP who ordered you to use particular values, for example. (Along with digitally signed copies of the email(s) in question.)

Which one are you using?

PS: This link was forwarded to me by Sam Hunting.

Indexing PDF for OSINT and Pentesting [or Not!]

Filed under: Cybersecurity,Indexing,PDF,Security,Solr — Patrick Durusau @ 9:11 am

Indexing PDF for OSINT and Pentesting by Alejandro Nolla.

From the post:

Most of us, when conducting OSINT tasks or gathering information for preparing a pentest, draw on Google hacking techniques like site:company.acme filetype:pdf “for internal use only” or something similar to search for potential sensitive information uploaded by mistake. At other times, a customer will ask us to find out if through negligence they have leaked this kind of sensitive information and we proceed to make some google hacking fu.

But, what happens if we don’t want to make this queries against Google and, furthermore, follow links from search that could potentially leak referrers? Sure we could download documents and review them manually in local but it’s boring and time consuming. Here is where Apache Solr comes into play for processing documents and creating an index of them to give us almost real time searching capabilities.

A nice outline of using Solr for internal security testing of PDF files.

At the same time, a nice outline of using Solr for external security testing of PDF files. 😉

You can sweep sites for new PDF files on a periodic basis and retain only those meeting a particular criteria.

Low grade ore but even low grade ore can have a small diamond every now and again.

A Programmer’s Guide to Data Mining

Filed under: Data Mining,Python — Patrick Durusau @ 8:56 am

A Programmer’s Guide to Data Mining – The Ancient Art of the Numerati by Ron Zacharski.

From the webpage:

Before you is a tool for learning basic data mining techniques. Most data mining textbooks focus on providing a theoretical foundation for data mining, and as result, may seem notoriously difficult to understand. Don’t get me wrong, the information in those books is extremely important. However, if you are a programmer interested in learning a bit about data mining you might be interested in a beginner’s hands-on guide as a first step. That’s what this book provides.

This guide follows a learn-by-doing approach. Instead of passively reading the book, I encourage you to work through the exercises and experiment with the Python code I provide. I hope you will be actively involved in trying out and programming data mining techniques. The textbook is laid out as a series of small steps that build on each other until, by the time you complete the book, you have laid the foundation for understanding data mining techniques. This book is available for download for free under a Creative Commons license (see link in footer). You are free to share the book, and remix it. Someday I may offer a paper copy, but the online version will always be free.

If you are looking for explanations of data mining that fall between the “dummies” variety and arXiv.org papers, you are at the right place!

Not new information but well presented information, always a rare thing.

Take the time to read this book.

If not for the content, to get some ideas on how to improve your next book.

April 5, 2013

Topic Maps and Bookmarks

Filed under: Bookmarks,Topic Maps,Web Browser — Patrick Durusau @ 4:54 pm

A comment recently suggested web bookmarks as an ideal topic map use case for most users.

There has been work along those lines. I haven’t found/remembered every paper/proposal so chime in the ones I miss.

The one that first came to mind was Thomas Passin’s Browser bookmark management with Topic Maps at Extreme Markup in 2003.

Abstract:

Making effective use of large collections of browser bookmarks is difficult. The user faces major challenges in finding specific entries, in finding specific or general kinds of entries, and in finding related references. In addition, the ability to add annotations would be very valuable.

This paper discusses a practical model for a bookmark collection that has been organized into nested folders. It is shown convincingly that the folder structure in no way implies a hierarchical taxonomy, nor does it reflect a faceted classification scheme. The model is presented as a topic map.

A number of simple enhancements to the basic information are described, including a very modest amount of semantic analysis on the bookmark titles. An approach for preserving user-entered annotations across bookmark updates is delineated. Some issues of user interface are discussed. In toto, the model, the computed enrichment, and the user interface work together to provide effective collocation and navigation capabilities.

A bookmark application that embodies this model has been implemented entirely within a standard browser The topic map engine is written entirely in javascript. The utility of this application, which the author uses daily, is remarkable considering the simplicity of the underlying model. It is planned to give a live demonstration during the presentation.

Then there was Tobias Hofmann and Martin Pradella, BookMap — A Topic Map Based Web Application for Organizing Bookmarks. (TMRA 2007)

Description:

This talk proposes a basic Ontology for use in Topic Maps storing semantic information on bookmark collections. Furthermore, we introduce a data model allowing to implement such a system on a LAMP (Linux, Apache, MySQL, PHP) platform, extended with the Cake-PHP framework. A prototype has been developed as proof of concept, where the use of AJAX and drag and drop capabilities in the browser resulted in a good user experience during a preliminary user evaluation.

and,

Toward a Topic Maps Amanuensis by Jack Park (2007)

Abstract:

The CALO project at SRI International provides unique opportunities to explore the boundaries of knowledge representation and organization in a learning environment. A goal reported here is to develop methods for assistance in the preparation of documents through a topic map framework populated by combinations of machine learning and recorded social gestures. This work in progress continues the evolution of Tagomizer, our social bookmarking application, adding features necessary for annotations of websites beyond simple bookmark-like tagging, including the creation of new subjects in the topic map. We report on the coupling of Tagomizer with a Java wiki engine, and show how this new framework will serve as a platform for CALO’s DocAssist application.

More recently:

ToMaBoM, Topic Map Bookmark Manager – Firefox Extension by Dieter Steiner (last updated 2012-11-05)

Features:

  • Create and Safe Weblinks in a Topic Map
  • Organize and Mange Entrys
  • Change Topic Map Meta-Model
  • Safe copy of Webpages locally and access them from within the extension
  • Import and Export the Topic Map as XML Topic Map

I need to mention Gabriel Hopmans is working on a topic map bookmark app but I don’t have a link to share. Gabriel?

Over the weekend, read up on the older proposals and take a look at ToMaBoM.

What do you like/dislike, would like to see, not just there but in any topic map bookmark app?

PS: I am wiling to bet that curated bookmarks, delivered to users (TM based searching), will be more popular than users doing the work themselves.

Probability and Statistics Cookbook

Filed under: Mathematics,Probability,Statistics — Patrick Durusau @ 3:02 pm

Probability and Statistics Cookbook by Matthias Vallentin.

From the webpage:

The cookbook contains a succinct representation of various topics in probability theory and statistics. It provides a comprehensive reference reduced to the mathematical essence, rather than aiming for elaborate explanations.

When Matthias says “succient,” he is quite serious:

Probability Screenshot

But by the time you master the twenty-seven pages of this “cookbook,” you will have a very good grounding on probability and statistics.

Saddle

Filed under: Data Structures,Scala — Patrick Durusau @ 2:56 pm

Saddle

From the webpage:

Saddle is a data manipulation library for Scala that provides array-backed, indexed, one- and two-dimensional data structures that are judiciously specialized on JVM primitives to avoid the overhead of boxing and unboxing.

Saddle offers vectorized numerical calculations, automatic alignment of data along indices, robustness to missing (N/A) values, and facilities for I/O.

Saddle draws inspiration from several sources, among them the R programming language & statistical environment, the numpy and pandas Python libraries, and the Scala collections library.

I have heard some one and two dimensional data structures can be quite useful. 😉

Something to play with over the weekend.

Enjoy!

Building Attribute and Value Crosswalks… [Please Verify]

Filed under: Crosswalk,Crosswalks,GIS,Topic Maps — Patrick Durusau @ 2:46 pm

Building Attribute and Value Crosswalks Using Esri’s Data Interoperability Extension by Nathan Lebel.

From the post:

The Esri Data Interoperability Extension gives GIS professionals the ability to build complex spatial extraction, transformation, and loading (ETL) tools. Traditionally the crosswalking of feature classes and attributes is done prior to setting up the migration tools and is used only as a guide. The drawback to this method is that it takes a considerable amount of time to build the crosswalks and then to build the ETL tools.

GISI’s article, “Building Attribute and Value Crosswalks in ESRI Data Interoperability Extension the Scalable/Dynamic Way” outlines the use of the SchemaMapper transformer within Data Interoperability Extension which can pull crosswalk information directly from properly formatted tables. For large projects this means you can store crosswalk information in a single repository and point each ETL tool to that repository without needing to manage multiple crosswalk documents. For projects that might change during the lifecycle of the project the use of SchemaMapper means that changes can be made to the repository without requiring any additional changes to the ETL tool. There are three examples used in this article which encompasses a majority of crosswalking tasks; feature class to feature class, attribute to attribute, and attribute value to attribute value crosswalking. All of the examples use CSV files to store the crosswalk information; however the transformer can pull directly from RDBMS tables as well which gives you the ability to build a user interface to create and update crosswalks which is recommended for large scale projects.

The full article can be accessed on GISI’s blog or as a PDF or Ebook in either EPUB or Kindle or format.

If you have time, please read the original article. Obtain it from the links listed in the final paragraph.

I need for you to verify my reading of the process described in that article.

As far as I can tell, the author never say “why” or on what basis the various mappings are being made.

I would be hard pressed to duplicate the mapping based on the information given about the original data sources.

Having an opaque mapping can be useful, as the article says but what if I stumble upon the mapping five years from now? Or two years? Or perhaps even six months from now?

Specifying the “why” of a mapping is something topic maps are uniquely qualified to do.

You can define merging rules that require the basis for mapping to be specified.

If that basis is absent, no merging occurs.

Bioinformatics Workshops and Training Resources

Filed under: Bioinformatics — Patrick Durusau @ 2:15 pm

List of Bioinformatics Workshops and Training Resources by Stephen Turner.

Stephen as created List of Bioinformatics Workshops and Training Resources, a listing:

of both online learning resources and in-person workshops (preferentially highlighting those where workshop materials are freely available online)

Update Stephen if you discover new resources and/or create new resources that should be listed.

As in most areas, bioinformatics has a wealth of semantic issues for topic maps to address.

Concurrent and Parallel Programming

Filed under: Graphics,Marketing,Visualization — Patrick Durusau @ 1:39 pm

Concurrent and Parallel Programming by Joe Armstrong.

Joe explains the difference between concurrency and parallelism to a five year old.

This is the type of stark clarity that I am seeking for topic map explanations.

At least the first ones someone sees. Time enough later for the gory details.

Suggestions welcome!

The GitHub Data Challenge II

Filed under: Challenges,Github — Patrick Durusau @ 1:36 pm

The GitHub Data Challenge II

From the webpage:

There are millions of projects on GitHub. Every day, people from around the world are working to make these projects better. Opening issues, pushing code, submitting Pull Requests, discussing project details — GitHub activity is a papertrail of progress. Have you ever wondered what all that data looks like? There are millions of stories to tell; you just have to look.

Last year we held our first data challenge. We saw incredible visualizations, interesting timelines and compelling analysis.

What stories will be told this year? It’s up to you!

To Enter

Send a link to a GitHub repository or gist with your graph(s) along with a description to data@github.com before midnight, May 8th, 2013 PST.

Approaching 100M rows, how would you visualize the data and what questions would you explore?

Successful PROV Tutorial at EDBT

Filed under: Design,Modeling,Provenance — Patrick Durusau @ 1:13 pm

Successful PROV Tutorial at EDBT by Paul Groth.

From the post:

On March 20th, 2013 members of the Provenance Working Group gave a tutorial on the PROV family of specifications at the EDBT conference in Genova, Italy. EDBT (“Extending Database Technology”) is widely regarded as one of the prime venues in Europe for dissemination of data management research.

The 1.5 hours tutorial was attended by about 26 participants, mostly from academia. It was structured into three parts of approximately the same length. The first two parts introduced PROV as a relational data model with constraints and inference rules, supported by a (nearly) relational notation (PROV-N). The third part presented known extensions and applications of PROV, based on the extensive PROV implementation report and implementations known to the presenter at the time.

All the presentation material is available here.

As the first part of the tutorial notes:

  • Provenance is not a new subject
    • workflow systems
    • databases
    • knowledge representation
    • information retrieval
  • Existing community-grown vocabularies
    • Open Provenance Model (OPM)
    • Dublin Core
    • Provenir ontology
    • Provenance vocabulary
    • SWAN provenance ontology
    • etc.

The existence of “other” vocabularies isn’t an issue for topic maps.

You can query on “your” vocabulary and obtain results from “other” vocabularies.

Enriches your information and that of others.

You will need to know about the vocabularies of others and their oddities.

For the W3C work on provenance, follow this tutorial and the others it mentions.

Crowdsourcing Chemistry for the Community…

Filed under: Authoring Topic Maps,Cheminformatics,Crowd Sourcing — Patrick Durusau @ 12:57 pm

Crowdsourcing Chemistry for the Community — 5 Year of Experiences by Antony Williams.

From the description:

ChemSpider is one of the internet’s primary resources for chemists. ChemSpider is a structure-centric platform and hosts over 26 million unique chemical entities sourced from over 400 different data sources and delivers information including commercial availability, associated publications, patents, analytical data, experimental and predicted properties. ChemSpider serves a rather unique role to the community in that any chemist has the ability to deposit, curate and annotate data. In this manner they can contribute their skills, and data, to any chemist using the system. A number of parallel projects have been developed from the initial platform including ChemSpider SyntheticPages, a community generated database of reaction syntheses, and the Learn Chemistry wiki, an educational wiki for secondary school students.

This presentation will provide an overview of the project in terms of our success in engaging scientists to contribute to crowdsouring chemistry. We will also discuss some of our plans to encourage future participation and engagement in this and related projects.

Perhaps not encouraging in terms of the rate of participation but certainly encouraging in terms of the impact of those who do participate.

I suspect the ratio of contributors to users isn’t that far off from those observed in open source projects.

On the whole, I take this as a plus sign for crowd-sourced curation projects, including topic maps.

I first saw this in a tweet by ChemConnector.

Lazy D3 on some astronomical data

Filed under: Astroinformatics,D3,Graphics,Ontology,Visualization — Patrick Durusau @ 6:03 am

Lazy D3 on some astronomical data by simonraper.

From the post:

I can’t claim to be anything near an expert on D3 (a JavaScript library for data visualisation) but being both greedy and lazy I wondered if I could get some nice results with minimum effort. In any case the hardest thing about D3 for a novice to the world of web design seems to be getting started at all so perhaps this post will be useful for getting people up and running.

astronomy ontology

The images above and below are visualisations using D3 of a classification hierarchy for astronomical objects provided by the IVOA (International Virtual Observatory Alliance). I take no credit for the layout. The designs are taken straight from the D3 examples gallery but I will show you how I got the environment set up and my data into the graphs. The process should be replicable for any hierarchical dataset stored in a similar fashion.

Even better than the static images are various interactive versions such as the rotating Reingold–Tilford Tree, the collapsible dendrogram and collapsible indented tree . These were all created fairly easily by substituting the astronomical object data for the data in the original examples. (I say fairly easily as you need to get the hierarchy into the right format but more on that later.)

Easier to start with visualization of standard information structures and then move onto more exotic ones.

A Newspaper Clipping Service with Cascading

Filed under: Authoring Topic Maps,Cascading,Data Mining,News — Patrick Durusau @ 5:34 am

A Newspaper Clipping Service with Cascading by Sujit Pal.

From the post:

This post describes a possible implementation for an automated Newspaper Clipping Service. The end-user is a researcher (or team of researchers) in a particular discipline who registers an interest in a set of topics (or web-pages). An assistant (or team of assistants) then scour information sources to find more documents of interest to the researcher based on these topics identified. In this particular case, the information sources were limited to a set of “approved” newspapers, hence the name “Newspaper Clipping Service”. The goal is to replace the assistants with an automated system.

The solution I came up with was to analyze the original web pages and treat keywords extracted out of these pages as topics, then for each keyword, query a popular search engine and gather the top 10 results from each query. The search engine can be customized so the sites it looks at is restricted by the list of approved newspapers. Finally the URLs of the results are aggregated together, and only URLs which were returned by more than 1 keyword topic are given back to the user.

The entire flow can be thought of as a series of Hadoop Map-Reduce jobs, to first download, extract and count keywords from (web pages corresponding to) URLs, and then to extract and count search result URLs from the keywords. I’ve been wanting to play with Cascading for a while, and this seemed like a good candidate, so the solution is implemented with Cascading.

Hmmm, but an “automated system” leaves the user to sort, create associations, etc., for themselves.

Assistants with such a “clipping service” could curate the clippings by creating associations with other materials and adding non-obvious but useful connections.

Think of the front page of the New York Times as an interface to curated content behind the stories that appear on it.

Where “home” is the article on the front page.

Not only more prose but a web of connections to material you might not even know existed.

For example, in Beijing Flaunts Cross-Border Clout in Search for Drug Lord by Jane Perlez and Bree Feng (NYT) we learn that:

Under Lao norms, law enforcement activity is not done after dark, (Liu Yuejin, leader of the antinarcotics bureau of the Ministry of Public Security)

Could be important information, depending upon your reasons for being in Laos.

April 4, 2013

Big Data Defined

Filed under: BigData,Humor — Patrick Durusau @ 2:43 pm

Big Data Defined by Russell Jurney.

From the post:

Specifically, a Big Data system has four properties:

  • It uses local storage to be fast but inexpensive
  • It uses clusters of commodity hardware to be inexpensive
  • It uses free software to be inexpensive
  • It is open source to avoid expensive vendor lock-in

It has been raining all day but I had to laugh when I saw Russell’s definition of “a Big Data system.”

Does it remind you of any particular player in the Big Data pack? 😉

That’s one way to build marketshare, you define yourself to be the measuring stick.

Let’s walk through the list and see what comments or alternatives suggest themselves:

  • It uses local storage to be fast but inexpensive

    [What? No cloud? Have you compared all the cost of local hardware against the cloud?]

  • It uses clusters of commodity hardware to be inexpensive

    [Wonder why NCSA build Blue Waters “from Cray hardware, operates at a sustained performance of more than 1 petaflop (1 quadrillion calculations per second) and is capable of peak performance of 11.61 petaflops (11.6 quadrillion calculations per second).” Must not be “big data.]

  • It uses free software to be inexpensive

    [They say that so often. I wonder what they are using as a basis for comparison? LaTeX versus MS Word? Have you paid anyone to typeset a paper in LaTeX versus asking your staff to type it in MS Word?]

  • It is open source to avoid expensive vendor lock-in

    [Actually it is open formats that avoid vendor lock-in, expensive or otherwise]

I enjoy a bit of marketing fluff as much as the next person but it should at least be plausible.

Data Points: Preview

Filed under: Graphics,Modeling,Visualization — Patrick Durusau @ 2:18 pm

Data Points: Preview by Nathan Yau.

As you already know, Nathan is a rich source for interesting graphics and visualizations, some of which I have the good sense to point to.

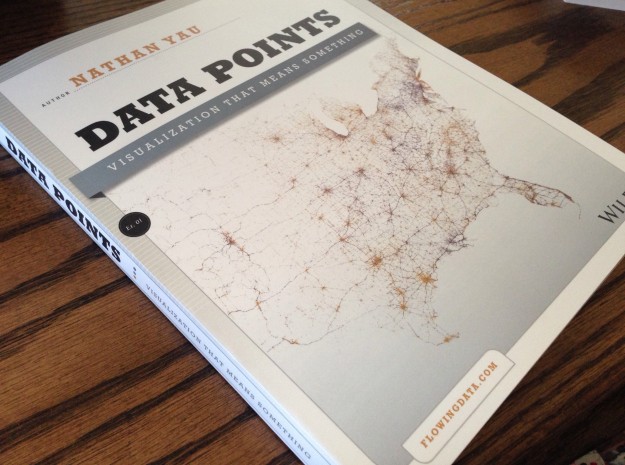
What you may not know is that Nathan has a new book out: Data Points: Visualizations That Mean Something.

Data Points

Not a book about coding to visualize data but rather:

Data Points is all about process from a non-programming point of view. Start with the data, really understand it, and then go from there. Data Points is about looking at your data from different perspectives and how it relates to real life. Then design accordingly.

That’s the hard part isn’t it?

Like the ongoing discussion here about modeling for topic maps.

Unless you understand the data, models and visualizations alike are going to be meaningless.

Check out Nathan’s new book to increase your chances of models and visualizations that mean something.

R 3.0 Launched

Filed under: R — Patrick Durusau @ 2:01 pm

R 3.0 Launched by Ajay Ohri.

Ajay picks some highlights from the R 3.0 release and points you to the full news for a complete list.

The Ubuntu update servers don’t have R 3.0, yet. If you are in a hurry, see cran.r-project.org for a source list.

Visualizing Biological Data Using the SVGmap Browser

Filed under: Biology,Biomedical,Graphics,Mapping,Maps,SVG,Visualization — Patrick Durusau @ 1:26 pm

Visualizing Biological Data Using the SVGmap Browser by Casey Bergman.

From the post:

Early in 2012, Nuria Lopez-Bigas‘ Biomedical Genomics Group published a paper in Bioinformatics describing a very interesting tool for visualizing biological data in a spatial context called SVGmap. The basic idea behind SVGMap is (like most good ideas) quite straightforward – to plot numerical data on a pre-defined image to give biological context to the data in an easy-to-interpret visual form.

To do this, SVGmap takes as input an image in Scalable Vector Graphics (SVG) format where elements of the image are tagged with an identifier, plus a table of numerical data with values assigned to the same identifier as in the elements of the image. SVGMap then integrates these files using either a graphical user interface that runs in standard web browser or a command line interface application that runs in your terminal, allowing the user to display color-coded numerical data on the original image. The overall framework of SVGMap is shown below in an image taken from a post on the Biomedical Genomics Group blog.

svgmap image

We’ve been using SVGMap over the last year to visualize tissue-specific gene expression data in Drosophila melanogaster from the FlyAtlas project, which comes as one of the pre-configured “experiments” in the SVGMap web application.

More recently, we’ve been also using the source distribution of SVGMap to display information about the insertion preferences of transposable elements in a tissue-specific context, which as required installing and configuring a local instance of SVGMap and run it via the browser. The documentation for SVGMap is good enough to do this on your own, but it took a while for us to get a working instance the first time around. We ran into the same issues again the second time, so I thought I write up my notes for future reference and to help others get SVGMap up and running as fast as possible.

Topic map interfaces aren’t required to take a particular form.

A drawing of a fly could be topic map interface.

Useful for people studying flies, less useful (maybe) if you are mapping Lady Gaga discography.

What interface do you want to create for a topic map?

Targeting Developers?

Filed under: Marketing,Topic Maps — Patrick Durusau @ 11:15 am

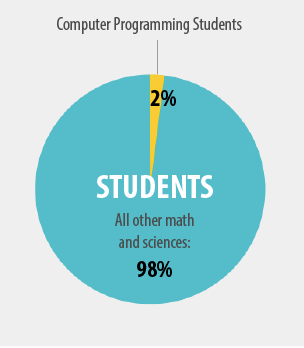
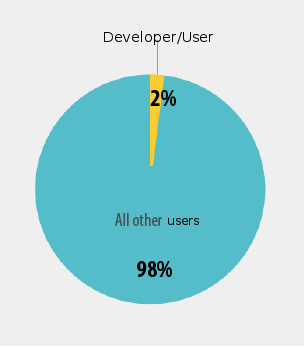
Most topic map software, either explicitly or implicitly, is targeted at developers.

I ran across a graphic today that highlights what I consider to be a flaw in that strategy.

The original graphic concerns the number of students enrolled in computer science:

CS enrollment

I first saw that in a tweet by Matt Asay.

I need to practice (read learn) Gimp skills so my first attempt to re-purpose the graphic was:

CS student enrollment

But that leaves my main point implied, so after some fiddling, I got:

Marketing image

Even without a marketing degree, I can pick the better marketing target.

What about you?

BTW, the experience with Hadoop supports my side, not the targeting for developers argument.

Yes, a lot of Hadoop tools are difficult to use, if not black arts.

However, Hadoop marketing has more hand waving and arm flapping than you will see among Democrats on entitlement reform and Republicans on tax reform, combined.

The Hadoop ecosystem (which I like a lot by the way) is billed to consumers as curing everything but AIDS and that is just a matter of application.

Consumer demand, from people who aren’t going to run Hadoop clusters, write pig scripts, etc. is driving developers to build better tools and to learn the harder ones.

Suggestions on how to build consumer oriented marketing of topic maps will be greatly appreciated!

ETL into Neo4j

Filed under: Graphs,Neo4j — Patrick Durusau @ 5:37 am

ETL into Neo4j by Max De Marzi.

Max covers four different methods to load data into Neo4j.

Definitely worth a stop.

Directed Graph Editor

Filed under: Authoring Topic Maps,D3,Graphs — Patrick Durusau @ 5:32 am

Directed Graph Editor

This is a live directed graph editor so you will need to follow the link.

The instructions:

Click in the open space to add a node, drag from one node to another to add an edge.
Ctrl-drag a node to move the graph layout.
Click a node or an edge to select it.

When a node is selected: R toggles reflexivity, Delete removes the node.
When an edge is selected: L(eft), R(ight), B(oth) change direction, Delete removes the edge.

To see this example as part of a larger project, check out Modal Logic Playground!

Just an example of what is possible with current web technology.

Add the ability to record properties, well, could be interesting.

One of the display issues with a graph representation of a topic map is the proliferation of links, which can make the display too “busy.”

What if edges only appeared when mousing over a node? Or you had the ability to toggle some class of edges on/off? Or types of nodes on/off?

Something to keep in mind.

I first saw this in a tweet by Carter Cole.

Introducing Tabula

Filed under: Conversion,PDF,Tables,Tabula — Patrick Durusau @ 5:16 am

Introducing Tabula by Manuel AristarĂĄn, Mike Tigas.

From the post:

Tabula lets you upload a (text-based) PDF file into a simple web interface and magically pull tabular data into CSV format.

It is hard to say why governments and other imprison tabular data in PDF files.

I suspect they see some advantage in preventing comparison to other data or even checking the consistency of data in a single report.

Whatever their motivations, let’s disappoint them!

Details on how to help are in the blog post.

The Project With No Name

Filed under: Linked Data,LOD,Open Data — Patrick Durusau @ 4:53 am

Fujitsu Labs And DERI To Offer Free, Cloud-Based Platform To Store And Query Linked Open Data by Jennifer Zaino.

From the post:

The Semantic Web Blog reported last year about a relationship formed between the Digital Enterprise Research Institute (DERI) and Fujitsu Laboratories Ltd. in Japan, focused on a project to build a large-scale RDF store in the cloud capable of processing hundreds of billions of triples. At the time, Dr. Michael Hausenblas, who was then a DERI research fellow, discussed Fujitsu Lab’s research efforts related to the cloud, its huge cloud infrastructure, and its identification of Big Data as an important trend, noting that “Linked Data is involved with answering at least two of the three Big Data questions” – that is, how to deal with volume and variety (velocity is the third).

This week, the DERI and Fujitsu Lab partners have announced a new data storage technology that stores and queries interconnected Linked Open Data, to be available this year, free of charge, on a cloud-based platform. According to a press release about the announcement, the data store technology collects and stores Linked Open Data that is published across the globe, and facilitates search processing through the development of a caching structure that is specifically adapted to LOD.

Typically, search performance deteriorates when searching for common elements that are linked together within data because of requirements around cross-referencing of massive data sets, the release says. The algorithm it has developed — which takes advantage of links in LOD link structures typically being concentrated in only a portion of server nodes, and of past usage frequency — caches only the data that is heavily accessed in cross-referencing to reduce disk accesses, and so accelerate searching.

Not sure what it means for the project between DERI and Fujitsu to have no name. Or at least no name in the press releases.

Until that changes, may I suggest: DERI and Fujitsu Project With No Name (DFPWNN)? 😉

With or without a name I was glad for DERI because, well, I like research and they do it quite well.

DFPWNN’s better query technology for LOD will demonstrate, in my opinion, the same semantic diversity found at Swoogle.

Linking up semantically diverse content means just that, a lot of semantically diverse content, linked up.

The bill for leaving semantic diversity as a problem to address “later” is about to come due.

April 3, 2013

Requirements for an Authoring Tool for Topic Maps

Filed under: Authoring Topic Maps,Topic Maps — Patrick Durusau @ 6:35 pm

I appreciated the recent comment that made it clear I was conflating several things under “authoring.”

One of those things was the conceptual design topic map, another was the transformation or importing of data into a topic map.

A third one was the authoring of a topic map in the sense of using an editor, much like a writer using a typewriter.

Not to denigrate the other two aspects of authoring but I haven’t thought about them as long as the sense of writing a topic map.

Today I wanted to raise the issue of requirements for a authoring/writing tool for topic maps.

I appreciate the mention of Wandora, which is a very powerful topic map tool.

But Wandora has more features than a beginning topic map author will need.

An author could graduate to Wandora, but it makes a difficult starting place.

Here is my sketch of requirements for a topic map authoring/writing tool:

  • Text entry (Unicode)
  • Prompts/Guides for required/optional properties (subject identifier, subject locator or item identifier)
  • Prompts/Guides for required/optional components (Think roles in an associations)
  • Types (nice to have constrained to existing topic)
  • Scope (nice to have constrained to be existing topic)
  • Separation of topics, associations, occurrences (TMDM as legend)
  • As little topic map lingo as possible
  • Pre-defined topics

What requirements am I missing for a topic map authoring tool that is more helpful than a text editor but less complicated than TeX?

BTW, as I wrote this, it occurred to me to ask: How did you learn to write HTML?

5 heuristics for writing better SPARQL queries

Filed under: RDF,SPARQL — Patrick Durusau @ 2:48 pm

5 heuristics for writing better SPARQL queries by Paul Groth.

From the post:

In the context of the Open PHACTS and the Linked Data Benchmark Council projects, Antonis Loizou and I have been looking at how to write better SPARQL queries. In the Open PHACTS project, we’ve been writing super complicated queries to integrate multiple data sources and from experience we realized that different combinations and factors can dramatically impact performance. With this experience, we decided to do something more systematic and test how different techniques we came up with mapped to database theory and worked in practice. We just submitted a paper for review on the outcome. You can find a preprint (On the Formulation of Performant SPARQL Queries) on arxiv.org at http://arxiv.org/abs/1304.0567. The abstract is below. The fancy graphs are in the paper.

Paper Abstract:

The combination of the flexibility of RDF and the expressiveness of SPARQL provides a powerful mechanism to model, integrate and query data. However, these properties also mean that it is nontrivial to write performant SPARQL queries. Indeed, it is quite easy to create queries that tax even the most optimised triple stores. Currently, application developers have little concrete guidance on how to write “good” queries. The goal of this paper is to begin to bridge this gap. It describes 5 heuristics that can be applied to create optimised queries. The heuristics are informed by formal results in the literature on the semantics and complexity of evaluating SPARQL queries, which ensures that queries following these rules can be optimised effectively by an underlying RDF store. Moreover, we empirically verify the efficacy of the heuristics using a set of openly available datasets and corresponding SPARQL queries developed by a large pharmacology data integration project. The experimental results show improvements in performance across 6 state-of-the-art RDF stores.

Just in case you have to query RDF stores as part of your topic map work.

Be aware that: The effectiveness of your SPARQL query will vary based on the RDF Store.

Or as the authors say:

SPARQL, due to its expressiveness , provides a plethora of different ways to express the same constraints, thus, developers need to be aware of the performance implications of the combination of query formulation and RDF Store. This work provides empirical evidence that can help developers in designing queries for their selected RDF Store. However, this raises questions about the effectives of writing complex generic queries that work across open SPARQL endpoints available in the Linked Open Data Cloud. We view the optimisation of queries independent of underlying RDF Store technology as a critical area of research to enable the most effective use of these endpoints. (page 21)

I hope their research is successful.

Varying performance, especially as reported in their paper, doesn’t bode well for cross-RDF Store queries.

Outing Censors

Filed under: Marketing,Topic Maps — Patrick Durusau @ 1:45 pm

You may already be aware of threats and legal proceedings by Edwin Mellen Press against criticism of itself and its publications.

For one recent update, see: Posts Removed Because We’ve Received Letters From Edwin Mellen Press’ Attorney by Kent Anderson.

For further background, see: When Sellers and Buyers Disagree — Edwin Mellen Press vs. a Critical Librarian by Rick Anderson.

The thought occurs to me that over the years there must be a treasure trove of letters and other communications from Edwin Mellen Press, not to mention litigation files, depositions, etc.

But any story about Edwin Mellen Press will be written with access to only part of that historical information.

What if McMaster University were to publicize the “…demands and considerable pressure from the Edwin Mellen Press….?” And those demands could be mapped to other demands against others?

The demands by Edwin Mellen Press have been made against librarians. The very people who excel at the collection and creation of archives.

Is it time for the library community to pool its knowledge about Edwin Mellen Press?

My time resources are limited but I would be willing to contribute as I am able to such an effort.

You?

Information Management – Gartner 2013 “Predictions”

Filed under: Data Management,Marketing,Topic Maps — Patrick Durusau @ 10:58 am

I hesitate to call Gartner reports “predictions.”

The public ones I have seen are c-suite summaries of information already known to the semi-informed.

Are Gartner “predictions” about what c-suite types may become informed about in the coming year?

That qualifies for the dictionary sense of “prediction.”

More importantly, what c-suite types may become informed about are clues on how to promote topic maps.

If you don’t have access to the real Gartner reports, Andy Price has summarized information management predictions in: IT trends: Gartner’s 2013 predictions for information management.

The ones primarily relevant to topic maps are:

  • Big data
  • Semantic technologies
  • The logical data warehouse
  • NoSQL DBMSs
  • Information stewardship applications
  • Information valuation/infonomics

One possible way to capitalize on these “predictions” would be to create a word cloud from the articles reporting on these “predictions.”

Every article with use slightly different language and the most popular terms are the ones to use for marketing.

Thinking they will be repeated often enough to resonate with potential customers.

Capturing the business needs answered by those terms would be a separate step.

2nd GraphLab workshop [Early Bird Registration]

Filed under: Conferences,GraphLab,Graphs,Networks — Patrick Durusau @ 10:14 am

The 2nd GraphLab workshop is coming up! by Danny Bickson.

Danny also says there is a 30% discount if you email him: danny.bickson@gmail.com. Don’t know when that runs out but worth a try.

From the post:

Following the great success of the first GraphLab workshop, we have started to organize this year event, in July at the bay area. To remind you, last year we wanted to organize a 15-20 people event, which eventually got a participation of 300+ researchers from 100+ companies.

The main aim of this year workshop is to bring together top researchers from academia, as well as top data scientists from industry with the special focus of large scale machine learning on sparse graphs.

The event will take place Monday July 1st, 2013 in San Francisco. Early bird registration is now open!

Preliminary agenda.

Definitely one to have on your calendar!

Project Falcon…

Filed under: Data Management,Falcon,Workflow — Patrick Durusau @ 9:16 am

Project Falcon: Tackling Hadoop Data Lifecycle Management via Community Driven Open Source by Venkatesh Seetharam.

From the post:

Today we are excited to see another example of the power of community at work as we highlight the newly approved Apache Software Foundation incubator project named Falcon. This incubation project was initiated by the team at InMobi together with engineers from Hortonworks. Falcon is useful to anyone building apps on Hadoop as it simplifies data management through the introduction of a data lifecycle management framework.

All About Falcon and Data Lifecycle Management

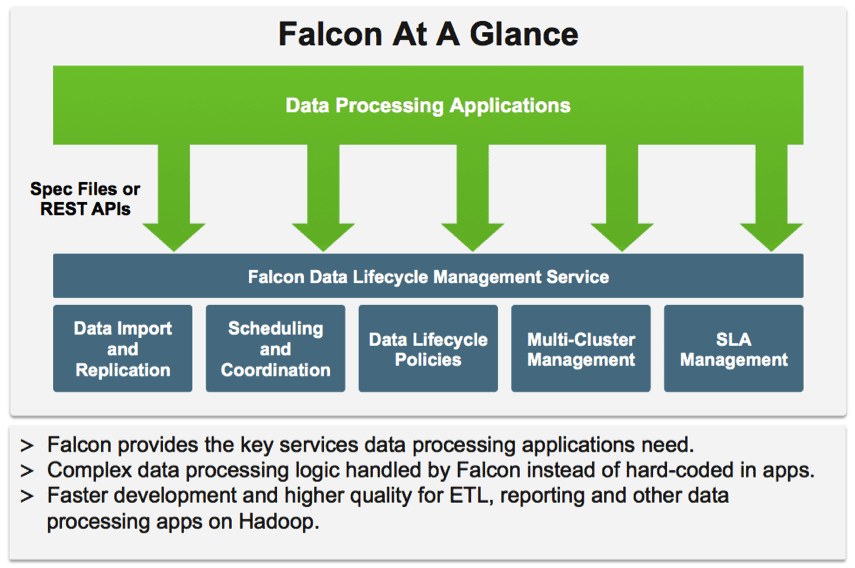
Falcon is a data lifecycle management framework for Apache Hadoop that enables users to configure, manage and orchestrate data motion, disaster recovery, and data retention workflows in support of business continuity and data governance use cases.

Falcon workflow

I am certain a topic map based workflow solution could be created.

However, using a solution being promoted by others removes one thing from the topic map “to do” list.

Not to mention giving topic maps an introduction to other communities.

« Newer PostsOlder Posts »

Powered by WordPress