Another Word For It Patrick Durusau on Topic Maps and Semantic Diversity

January 7, 2013

European Commission’s Low Attack on Open Source [TMs and Transparency]

Filed under: EU,Open Source,Topic Maps,Transparency — Patrick Durusau @ 7:22 am

European Commission’s Low Attack on Open Source by Glyn Moody.

From the post:

If ACTA was the biggest global story of 2012, more locally there’s no doubt that the UK government’s consultation on open standards was the key event. As readers will remember, this was the final stage in a long-running saga with many twists and turns, mostly brought about by some uncricket-like behaviour by proprietary software companies who dread a truly level playing-field for government software procurement.

Justice prevailed in that particular battle, with open standards being defined as those with any claimed patents being made available on a royalty-free basis. But of course these things are never that simple. While the UK has seen the light, the EU has actually gone backwards on open standards in recent times.

Again, as long-suffering readers may recall, the original European Interoperability Framework also required royalty-free licensing, but what was doubtless a pretty intense wave of lobbying in Brussels overturned that, and EIF v2 ended up pushing FRAND, which effectively locks out open source – the whole point of the exercise.

Shamefully, some parts of the European Commission are still attacking open source, as I revealed a couple of months ago when Simon Phipps spotted a strange little conference with the giveaway title of “Implementing FRAND standards in Open Source: Business as usual or mission impossible?”

The plan was pretty transparent: organise something in the shadows, so that the open source world would be caught hopping. The fact that I only heard about it a few weeks beforehand, when I spend most of my waking hours scouting out information on the open source world, open standards and Europe, reading thousands of posts and tweets a week, shows how quiet the Commission kept about this.

This secrecy allowed the organisers to cherry pick participants to tilt the discussion in favour of software patents in Europe (which shouldn’t even exist, of course, according to the European Patent Convention), FRAND supporters and proprietary software companies, even though the latter are overwhelmingly American (so much for loyalty to the European ideal.) The plan was clearly to produce the desired result that open source was perfectly compatible with FRAND, because enough people at this conference said so.

But the “EU” hasn’t “gone backwards” on open standards. Organizations, as juridical entities, can’t go backwards or forwards on any topic. Officers, members, representatives of organizations, that is a different matter.

That is where topic maps could help bring transparency to a process such as the opposition to open source software.

For example, it is not:

  • “some parts of the European Commission” but named individuals with photographs and locations
  • “the organizers” but named individuals with specified relationships to commercial software vendors
  • “enough people at this conference” but paid representatives of software vendors and others financially interested in a no open source outcome

TM’s can help tear aware the governmental and corporate veil over these “consultations.”

What you will find are people who are profiting or intend to do so from their opposition to open source software.

Their choice, but they should be forced to declare their allegiance to seek personal profit over public good.

I first saw this at: EU Experiences Setback in Open Source.

Machine Learning based Vocabulary Management Tool

Filed under: Language,Vocabularies,VocBench — Patrick Durusau @ 6:55 am

Machine Learning based Vocabulary Management Tool – Assessment for the Linked Open Data by Ahsan Morshed and Ritaban Dutta.

Abstract:

Reusing domain vocabularies in the context of developing the knowledge based Linked Open data system is the most important discipline on the web. Many editors are available for developing and managing the vocabularies or Ontologies. However, selecting the most relevant editor is very difficult since each vocabulary construction initiative requires its own budget, time, resources. In this paper a novel unsupervised machine learning based comparative assessment mechanism has been proposed for selecting the most relevant editor. Defined evaluation criterions were functionality, reusability, data storage, complexity, association, maintainability, resilience, reliability, robustness, learnability, availability, flexibility, and visibility. Principal component analysis (PCA) was applied on the feedback data set collected from a survey involving sixty users. Focus was to identify the least correlated features carrying the most independent information variance to optimize the tool selection process. An automatic evaluation method based on Bagging Decision Trees has been used to identify the most suitable editor. Three tools namely Vocbench, TopBraid EVN and Pool Party Thesaurus Manager have been evaluated. Decision tree based analysis recommended the Vocbench and the Pool Party Thesaurus Manager are the better performer than the TopBraid EVN tool with very similar recommendation scores.

With the caveat that sixty (60) users in your organization (the number tested in this study), might reach different results, a useful study of vocabulary software.

More useful for the evaluation criteria to use with vocabulary software than in any absolute guide to the appropriate software.

I first saw this at: New article on vocabulary management tools.

…Self-Destructing Ads for Lingerie

Filed under: Ad Targeting,Advertising,Topic Maps — Patrick Durusau @ 6:41 am

Grey Uses the New Facebook Poke to Create Self-Destructing Ads for Lingerie Onetime clip for onetime sale by Rebecca Cullers.

From the post:

Facebook has redesigned its Poke feature to allow people to send their friends video clips that self-destruct 10 seconds after opening. “Hey, that would be great for safe sexting!” you probably thought immediately. So, it shouldn’t come as a shock that the first advertiser to use the new Facebook Poke is a lingerie company. Delta Lingerie crafted a campaign with Grey Tel Aviv in which a 10-second clip of a model pulling on some Delta stockings—a video that couldn’t be saved or even shared—was sent to the model’s friends. A few seconds at the end directed them to Delta’s website to claim a “one-time” discount on the stockings. Since Facebook allows you to poke only 40 people at a time—and the app deletes the video on the sender’s end, too—the model’s agent had to shoot the same clip over and over again.

Certainly an interesting idea, self-destructing messages, particularly for college football coaches and others with lots of texting time on their hands.

Rather specialized though.

And for whatever reason people keep those sorts of messages.

Rather than encryption, which always attracts attention, what about transforming messages into “box scores” for some sport?

Something that might be overlooked when looking for “sexting” messages on a coaches phone?

Particularly if the transformation was a hidden part of message management, discoverable only on examination of the source code.

1,002 uses of topic maps?

What do you think?

English Letter Frequency Counts: Mayzner Revisited…

Filed under: Language,Linguistics — Patrick Durusau @ 6:27 am

English Letter Frequency Counts: Mayzner Revisited or ETAOIN SRHLDCU by Peter Norvig.

From the post:

On December 17th 2012, I got a nice letter from Mark Mayzner, a retired 85-year-old researcher who studied the frequency of letter combinations in English words in the early 1960s. His 1965 publication has been cited in hundreds of articles. Mayzner describes his work:

I culled a corpus of 20,000 words from a variety of sources, e.g., newspapers, magazines, books, etc. For each source selected, a starting place was chosen at random. In proceeding forward from this point, all three, four, five, six, and seven-letter words were recorded until a total of 200 words had been selected. This procedure was duplicated 100 times, each time with a different source, thus yielding a grand total of 20,000 words. This sample broke down as follows: three-letter words, 6,807 tokens, 187 types; four-letter words, 5,456 tokens, 641 types; five-letter words, 3,422 tokens, 856 types; six-letter words, 2,264 tokens, 868 types; seven-letter words, 2,051 tokens, 924 types. I then proceeded to construct tables that showed the frequency counts for three, four, five, six, and seven-letter words, but most importantly, broken down by word length and letter position, which had never been done before to my knowledge.

and he wonders if:

perhaps your group at Google might be interested in using the computing power that is now available to significantly expand and produce such tables as I constructed some 50 years ago, but now using the Google Corpus Data, not the tiny 20,000 word sample that I used.

The answer is: yes indeed, I am interested! And it will be a lot easier for me than it was for Mayzner. Working 60s-style, Mayzner had to gather his collection of text sources, then go through them and select individual words, punch them on Hollerith cards, and use a card-sorting machine.

Peter rises to the occasion, using thirty-seven (37) times as much data as Mayzner. Not to mention detailing his analysis and posting the resulting data sets for more analysis.

Ten Simple Rules for the Open Development of Scientific Software

Filed under: Open Source — Patrick Durusau @ 6:08 am

Ten Simple Rules for the Open Development of Scientific Software (Prlić A, Procter JB (2012) Ten Simple Rules for the Open Development of Scientific Software. PLoS Comput Biol 8(12): e1002802. doi:10.1371/journal.pcbi.1002802)

The ten rules:

Rule 1: Don’t Reinvent the Wheel

Rule 2: Code Well

Rule 3: Be Your Own User

Rule 4: Be Transparent

Rule 5: Be Simple

Rule 6: Don’t Be a Perfectionist

Rule 7: Nurture and Grow Your Community

Rule 8: Promote Your Project

Rule 9: Find Sponsors

Rule 10: Science Counts

The same ten rules should work for development of open development of semantic annotations for data.

What do you think?

I first saw this at: PLOS Computational Biology: Ten Simple Rules for the Open Development of Scientific Software by Kevin Davies.

January 6, 2013

CartoDB makes D3 maps a breeze

Filed under: CartoDB,D3,Geographic Data,Mapping,Maps — Patrick Durusau @ 9:59 pm

CartoDB makes D3 maps a breeze

From the post:

Anybody who loves maps and data can’t help but notice all the beautiful visualizations people are making with D3 right now. Huge thanks to Mike Bostock for such a cool technology.

We have done a lot of client-side rendering expirements over the past year or so and have to say, D3 is totally awesome. This is why we felt it might be helpful to show you how easy it is to use D3 with CartoDB. In the near future, we’ll be adding a few tutorials for D3 to our developer pages, but for now, let’s have a look.

Very impressive.

But populating a map with data isn’t the same as creating a useful map with data.

Take a look at the earthquake example.

What data would you add to it to make the information actionable?

Reco4j

Filed under: Graphs,Neo4j,Recommendation — Patrick Durusau @ 9:42 pm

Reco4j

From the webpage:

Reco4j is an open source project that aims at developing a recommendation framework based on graph data sources. We choose graph databases for several reasons. They are NoSQL databases that are “schemaless”. This means that it is possible to extend the basic data structure with intermediate information, i.e. similarity value between item and so on. Moreover, since every information are expressed with some properties, nodes and relations, the recommendation process can be customized to work on every graph.

Indeed Reco4j can be used on every graph where “user” and “item” are represented by nodes and the preferences are modelled as relationship between them.

The current implementation leverages on Neo4j as first example of graph database integrated in our framework.

The main features of Reco4j are:

  1. Performance, leveraging on the graph database and storing information in it for future retrieving it produce fast recommendations also after a system restart;
  2. Use of Network structure, integrating the simple recommendation algorithms with (social) network analisys;
  3. General purpose, it can be used with preexisting databases;
  4. Customizability, editing the properties file the recommender framework can be adapted to the current graph structure and use several types of the recommendation algorithms;
  5. Ready for Cloud, leveraging on the graph database cloud features the recommendation process can be splitted on several nodes.

The current version has two different projects:

  • reco4j-core: this project contains the base structure, the interface and the recommendation engine;
  • reco4j-neo4j: this project contains the neo4j implementation of the framework.

The “similarity value” comment caught my eye.

How much similarity between two or more items do you need, to have the same item, for some particular purpose?

I first saw this in a tweet by Peter Neubauer.

January 5, 2013

The Semantic Link [ODI Drug Example?]

Filed under: Open Data,Semantic Web — Patrick Durusau @ 3:10 pm

The Semantic Link

Archive of the Semantic Link podcasts.

Semantic Link is a monthly podcast on Semantic Technologies from Semanticweb.com.

In December of 2012, Nigel Shadbolt, chairman and co-founder of ODI (Open Data Institute) is a special guest.

Nigel offers an odd example of the value of open data. See what you think:

The prescriptions, but not for who, written by all physicians, are made public. A start-up company noticed that many prescribed drugs were “off-license” (generic to use the U.S. terminology) but doctors were still prescribing the brand name drug.

Reported savings of 200 million £ in one drug area.

That success isn’t a function of having “open data” but having an intelligent person review the data. Whether open or not.

I can assure you my drug company knows the precise day when it anticipates a generic version of a drug will become available. 😉

The IUPAC International Chemical Identifier (InChI)….

Filed under: Cheminformatics,Identifiers — Patrick Durusau @ 2:39 pm

The IUPAC International Chemical Identifier (InChI) and its influence on the domain of chemical information edited by Dr. Anthony Williams.

From the webpage:

The International Chemical Identifier (InChI) has had a dramatic impact on providing a means by which to deduplicate, validate and link together chemical compounds and related information across databases. Its influence has been especially valuable as the internet has exploded in terms of the amount of chemistry related information available online. This thematic issue aggregates a number of contributions demonstrating the value of InChI as an enabling technology in the world of cheminformatics and its continuing value for linking chemistry data.

If you are interested in chemistry/cheminformatics or in the development and use of identifers, this is an issue to not miss!

You will find:

InChIKey collision resistance: an experimental testing by Igor Pletnev, Andrey Erin, Alan McNaught, Kirill Blinov, Dmitrii Tchekhovskoi, Steve Heller.

Consistency of systematic chemical identifiers within and between small-molecule databases by Saber A Akhondi, Jan A Kors, Sorel Muresan.

InChI: a user’s perspective by Steven M Bachrach.

InChI: connecting and navigating chemistry by Antony J Williams.

I particularly enjoyed Steven Bachrach’s comment:

It is important to recognize that in no way does InChI replace or make outmoded any other chemical identifier. A company that has developed their own registry system or one that uses one of the many other identifiers, like a MOLfile [13], can continue to use their internal system. Adding the InChI to their system provides a means for connecting to external resources in a simple fashion, without exposing any of their own internal technologies.

Or to put it differently, InChl increased the value of existing chemical identifiers.

How’s that for a recipe for adoption?

Semantically enabling a genome-wide association study database

Filed under: Bioinformatics,Biomedical,Genomics,Medical Informatics,Ontology — Patrick Durusau @ 2:20 pm

Semantically enabling a genome-wide association study database by Tim Beck, Robert C Free, Gudmundur A Thorisson and Anthony J Brookes. Journal of Biomedical Semantics 2012, 3:9 doi:10.1186/2041-1480-3-9.

Abstract:

Background

The amount of data generated from genome-wide association studies (GWAS) has grown rapidly, but considerations for GWAS phenotype data reuse and interchange have not kept pace. This impacts on the work of GWAS Central — a free and open access resource for the advanced querying and comparison of summary-level genetic association data. The benefits of employing ontologies for standardising and structuring data are widely accepted. The complex spectrum of observed human phenotypes (and traits), and the requirement for cross-species phenotype comparisons, calls for reflection on the most appropriate solution for the organisation of human phenotype data. The Semantic Web provides standards for the possibility of further integration of GWAS data and the ability to contribute to the web of Linked Data.

Results

A pragmatic consideration when applying phenotype ontologies to GWAS data is the ability to retrieve all data, at the most granular level possible, from querying a single ontology graph. We found the Medical Subject Headings (MeSH) terminology suitable for describing all traits (diseases and medical signs and symptoms) at various levels of granularity and the Human Phenotype Ontology (HPO) most suitable for describing phenotypic abnormalities (medical signs and symptoms) at the most granular level. Diseases within MeSH are mapped to HPO to infer the phenotypic abnormalities associated with diseases. Building on the rich semantic phenotype annotation layer, we are able to make cross-species phenotype comparisons and publish a core subset of GWAS data as RDF nanopublications.

Conclusions

We present a methodology for applying phenotype annotations to a comprehensive genome-wide association dataset and for ensuring compatibility with the Semantic Web. The annotations are used to assist with cross-species genotype and phenotype comparisons. However, further processing and deconstructions of terms may be required to facilitate automatic phenotype comparisons. The provision of GWAS nanopublications enables a new dimension for exploring GWAS data, by way of intrinsic links to related data resources within the Linked Data web. The value of such annotation and integration will grow as more biomedical resources adopt the standards of the Semantic Web.

Rather than:

The benefits of employing ontologies for standardising and structuring data are widely accepted.

I would rephrase that to read:

The benefits and limitations of employing ontologies for standardising and structuring data are widely known.

Decades of use of relational database schemas, informal equivalents of ontologies, leave no doubt governing structures for data have benefits.

Less often acknowledged is those same governing structures impose limitations on data and what may be represented.

That’s not a dig at relational databases.

Just an observation that ontologies and their equivalents aren’t unalloyed precious metals.

Beginning with Neo4j and Neo4jClient

Filed under: Graphs,Neo4j — Patrick Durusau @ 7:56 am

Beginning with Neo4j and Neo4jClient by Cameron J. Tinker.

From the post:

I will try my best to include everything necessary to get started with Neo4j. This is not meant to be a guide on how to program with C#, Visual Basic, Java, Cypher, or Gremlin. You will need to either have prior experience with those languages or read other resources to learn about them. If you don’t understand some of the computer science jargon, please let me know and I will try and make the wording more clear.

I’m not going to go into too much graph theory in this tutorial. You should have a basic understanding of what a directed graph is and how to create a data model since you seem to be interested in graph databases. All that you really need to know about graph theory is that a graph is a set of related nodes representing entities with relationships connecting the nodes.

Graph databases are an excellent way to model social data compared traditional relational databases. Social networking websites such as Twitter and Facebook use graph dbs for quickly querying through millions of users and their relationships to other objects or users. It would be much slower to use an RDBMS for a website like Facebook because of the need to select from tables with millions of records and perform joins on those tables. Joins are expensive operations in SQL databases and graph databases don’t require explicit joins due to the nature of a graph’s structure.

Old hat to most of you but a useful summary to pass along to others where basic questions come up.

Apache Crunch

Filed under: Cascading,Hive,MapReduce,Pig — Patrick Durusau @ 7:50 am

Apache Crunch: A Java Library for Easier MapReduce Programming by Josh Wills.

From the post:

Apache Crunch (incubating) is a Java library for creating MapReduce pipelines that is based on Google’s FlumeJava library. Like other high-level tools for creating MapReduce jobs, such as Apache Hive, Apache Pig, and Cascading, Crunch provides a library of patterns to implement common tasks like joining data, performing aggregations, and sorting records. Unlike those other tools, Crunch does not impose a single data type that all of its inputs must conform to. Instead, Crunch uses a customizable type system that is flexible enough to work directly with complex data such as time series, HDF5 files, Apache HBase tables, and serialized objects like protocol buffers or Avro records.

Crunch does not try to discourage developers from thinking in MapReduce, but it does try to make thinking in MapReduce easier to do. MapReduce, for all of its virtues, is the wrong level of abstraction for many problems: most interesting computations are made up of multiple MapReduce jobs, and it is often the case that we need to compose logically independent operations (e.g., data filtering, data projection, data transformation) into a single physical MapReduce job for performance reasons.

Essentially, Crunch is designed to be a thin veneer on top of MapReduce — with the intention being not to diminish MapReduce’s power (or the developer’s access to the MapReduce APIs) but rather to make it easy to work at the right level of abstraction for the problem at hand.

Although Crunch is reminiscent of the venerable Cascading API, their respective data models are very different: one simple common-sense summary would be that folks who think about problems as data flows prefer Crunch and Pig, and people who think in terms of SQL-style joins prefer Cascading and Hive.

Brief overview of Crunch and an example (word count) application.

Definitely a candidate for your “big data” tool belt.

Machine Learning Surveys

Filed under: Machine Learning — Patrick Durusau @ 7:41 am

Machine Learning Surveys

According to the tweet that led me here:

http://mlsurveys.com a crowdsourced list of #machinelearning survey and tutorial papers organized by topics and publication years

Not a large set of papers (110 as of when I looked) but certainly a serviceable idea. The vetting/editorial mechanism isn’t clear.

I first saw this in a post by Olivier Grisel.

Map Projections

Filed under: Cartography,D3,Graphics,Mapping,Maps — Patrick Durusau @ 7:36 am

Map Projections by Jason Davies.

If you are interested in map projections or D3, this page is a real delight!

Jason has draggable examples of:

Along with various demonstrations:

OK, one image to whet your appetite!

Waterman Butterfly Map

Follow the image to its homepage, then drag the image. I think you will be pleased.

Raspberry Pi: Up and Running

Filed under: Parallel Programming,Supercomputing — Patrick Durusau @ 7:00 am

Raspberry Pi: Up and Running by Matt Richardson.

From the post:

For those of you who haven’t yet played around with Raspberry Pi, this one’s for you. In this how-to video, I walk you through how to get a Raspberry Pi up and running. It’s the first in a series of Raspberry Pi videos that I’m making to accompany Getting Started with Raspberry Pi, a book I wrote with Shawn Wallace. The book covers Raspberry Pi and Linux basics and then works up to using Scratch, Python, GPIO (to control LED’s and switches), and web development on the board.

For the range of applications using the Raspberry Pi, consider: Water Droplet Photography:

We knew when we were designing it that the Pi would make a great bit of digital/real-world meccano. We hoped we’d see a lot of projects we hadn’t considered ourselves being made with it. We’re never so surprised by what people do with it as we are by some of the photography projects we see.

Using a €15 solenoid valve, some Python and a Raspberry Pi to trigger the valve and the camera shutter at the same time, Dave has built a rig for taking water droplet photographs.

Water Droplet Photography

The build your own computer kits started us on the path to today.

This is a build your own parallel/supercomputer kit.

Where do you want to go tomorrow?

Apache Flume 1.3.1

Filed under: Flume — Patrick Durusau @ 6:41 am

Apache Flume 1.3.1

From the webpage:

This release is the third release of Apache Flume as an Apache top level project and is the third release that is considered ready for production use. This release is primarily a maintenance release for Flume 1.3.0, and includes several bug fixes and performance enhancements.

If you are using Flume in production, maintenance releases are important.

If you are learning Flume, why start with working around fixed bugs? Use the latest stable release.

structr 0.6 Release

Filed under: Graphs,Neo4j,structr — Patrick Durusau @ 6:35 am

structr 0.6 Release

From the webpage:

structr (pronounce it like ‘structure’) is a Java framework for mobile and web applications based on the graph database Neo4j. It was designed to simplify the creation of complex graph database applications by providing a comprehensive Java API and a set of features common to most use cases. This enables developers to build a sophisticated web or mobile app based on Neo4j within hours.

Main features

  • highly configurable RESTful API using Java beans
  • data integrity and validation constraints
  • Cypher Query Language support
  • access control
  • search/spatial search
  • CRON-jobs for background agents

Awards

structr was awarded with the Graphie Award for the Most Innovative Open Source Graph Application in 2012.

January 4, 2013

Stop Explaining UX and Start Doing UX [External Validation and Topic Maps?]

Filed under: Interface Research/Design,Marketing,Topic Maps — Patrick Durusau @ 8:02 pm

Stop Explaining UX and Start Doing UX by Kim Bieler.

I started reading this post for the UX comments and got hooked when I read the “external validation model:”

External Validation

The problem with this strategy is we’re stuck in step 1—endlessly explaining, getting nowhere, and waiting like wallflowers to be asked to dance.

I ought to know—I spent years as a consultant fruitlessly trying to convince clients to spend money on things like the discovery phase, user interviews, and usability testing. I knew this stuff was important because I’d read a lot of books and articles and had gone to a lot of conferences. Moreover, I knew that I couldn’t claim to be a “real” UX designer unless I was doing this stuff.

Here’s the ugly truth: I wanted clients to pay me to do user research in order to cement my credentials, not because I truly understood its value. How could I understand it? I’d never tried it, because I was waiting for permission.

The problem with the external validation model is that it puts success out of our control and into the hands of our clients, bosses, and managers. It creates a culture of learned helplessness and a childish “poor me” attitude that frequently manifests in withering scorn for clients and executives—the very people upon whom our livelihood depends.

Does any of that sound familiar?

Kim continues with great advice on an internal validation model, but you will have to see her post for the answers.

Read those, then comment here.

Thanks!

Callimachus Version 1.0

Filed under: Linked Data,LOD — Patrick Durusau @ 7:43 pm

Callimachus Version 1.0 by Eric Franzon.

From the post:

The Callimachus Project has announced that the latest release of the Open Source version of Callimachus is available for immediate download.

Callimachus began as a linked data management system in 2009 and is an Open Source system for navigating, managing, visualizing and building applications on Linked Data.

Version 1.0 introduces several new features, including:

  • Built-in support for most types of Persistent URLs (PURLs), including Active PURLs.
  • Scripted HTTP content type conversions via XProc pipelines.
  • Ability to access remote Linked Data via SPARQL SERVICE keyword and XProc pipelines.
  • Named Queries can now have a custom view page. The view page can be a template for the resources in the query result.
  • Authorization can now be performed based on IP addresses or the DNS domain of the client.

A List of Data Science and Machine Learning Resources

Filed under: Data Science,Machine Learning — Patrick Durusau @ 7:37 pm

A List of Data Science and Machine Learning Resources

From the post:

Every now and then I get asked for some help or for some pointers on a machine learning/data science topic. I tend respond with links to resources by folks that I consider to be experts in the topic area. Over time my list has gotten a little larger so I decided to put it all together in a blog post. Since it is based mostly on the questions I have received, it is by no means complete, or even close to a complete list, but hopefully it will be of some use. Perhaps I will keep it updated, or even better yet, feel free to comment with anything you think might be of help.

Also, when I think of data science, I tend to focus on Machine Learning rather than the hardware or coding aspects. If you are looking for stuff on Hadoop, or R, or Python, sorry, there really isn’t anything here.

A bit more specific advice than “just do it,” which may helpful to many readers.

The first resource is Professor Gilbert Strang’s video lectures on Linear Algebra.

Factoid: Strang’s Introduction to Linear Algebra, Forth Edition (2009), lists new at Amazon for $60.49. The cheapest used copy goes for $53.90. Not bad for a textbook that is four years old this year.

I first saw this at: Free Online Resources: Bone Up on Your Data Science and Machine Learning by Angela Guess.

January 3, 2013

Big Data News Roundup [Forbes]

Filed under: BigData,Data Science — Patrick Durusau @ 8:05 pm

Big Data News Roundup: The Where, Who, and Why of Data Scientists by Gil Press.

A thumb nail sketch that applies data analysis to data scientists, their work, locations, etc.

Not deep but broad coverage that you will find interesting.

I first saw this at: PolySpot Information At Work Deepens Information Analysis and Access for Data Scientists.

If you spot “PolySpot” in the Forbes piece, drop me a note. Thanks!

Can Extragalactic Data Be Standardized? [Heterogeneity, the default case?]

Filed under: Astroinformatics,BigData — Patrick Durusau @ 7:53 pm

Can Extragalactic Data Be Standardized? by Ian Armas Foster.

From the post:

While lacking the direct practical applications that the study of genomics offers, astronomy is one of the more compelling use cases big data-related areas of academic research.

The wealth of stars and other astronomical phenomena that one can identify and classify provide an intriguing challenge. The long-term goal will be to eventually use the information from astronomical surveys in modeling the universe.

However, according to recent research written from French computer scientists Nicolas Kamennoff, Sebastien Foucaud, and Sebastien Reybier, the gradual decline of Moore’s Law and the resulting lack of computing power combined with the ever-expanding ability to see outside the Milky Way are creating a significant bottleneck in astronomical research. In particular, software has yet to catch up to strides made in parallel processing.

This article is the first of two focused around an ambitious-sounding institute known as the Taiwan Extragalactic Astronomical Data Center (TWEA-DC ). Here, the researchers identified three problems they hope to solve through the TWEA-DC: misuse of resources, the existence of a heterogeneous software ecosystem, and data transfer.

I guess this counts as one of my more “theory” oriented posts on topic maps. 😉

Of particular interest for the recognition that heterogeneity isn’t limited to data. Heterogeneity exists between software systems as well.

Homogeneity, for both data and software, is an artifice constructed to make early digital computers possible.

Whether CS is now strong enough for the default case, heterogeneity of both data and software, remains to be seen.

(On TWEA-DC proper, see: TaiWan Extragalactic Astronomical Data Center — TWEA-DC (website))

R and Data Mining: Examples and Case Studies (Update)

Filed under: Data Mining,R — Patrick Durusau @ 7:25 pm

R and Data Mining: Examples and Case Studies by Yanchang Zhao.

The PDF version now includes chapters 7 and 9 (on which see: Book “R and Data Mining: Examples and Case Studies” on CRAN [blank chapters] and only the case study chapters are omitted.

You will also find the R code for the book and an “R Reference Card for Data Mining.”

Enjoy!

Educational manual for Raspberry Pi released [computer science set]

Filed under: Parallel Programming,Supercomputing — Patrick Durusau @ 3:19 pm

Educational manual for Raspberry Pi released

From the post:

Created by a team of teachers from Computing at School, the newly published Raspberry Pi Education Manual⁠ sets out to provide support for teachers and educators who want to use the Raspberry Pi in a teaching environment. As education has been part of the original Raspberry Pi Foundation’s mission, the foundation has supported the development of the manual.

The manual has chapters on the basics of Scratch, experiments with Python, connecting programs with Twitter and other web services, connecting up the GPIO pins to control devices, and using the Linux command line. Two chapters, one on Greenfoot and GeoGebra, are not currently included in the manual as both applications require a Java virtual machine which is currently being optimised for the Pi platform.

The Scratch section, for example, explains how to work with the graphical programming environment and use sprites, first to animate a cat, then make a man walk, and then animate a bee pollinating flowers. It then changes gear to show how to use Scratch for solving maths problems using variables, creating an “artificial intelligence”, driving a robot, making a car follow a line, and animating a level crossing, and wraps up with a section on creating games.

Reminded me of Kevin Trainor’s efforts: Ontopia Runs on Raspberry Pi [This Rocks!].

The description in the manual of the Raspberry PI as a “computer science set” seems particularly appropriate.

What are you going to discover?

Merging Data Virtualization?

Filed under: Data Virtualization,Merging — Patrick Durusau @ 1:53 pm

I saw some ad-copy from a company that “wrote the book” on data virtualization (well, “a” book on data virtualization anyway).

Searched a bit in their documentation and elsewhere, but could not find an answer to my questions (below).

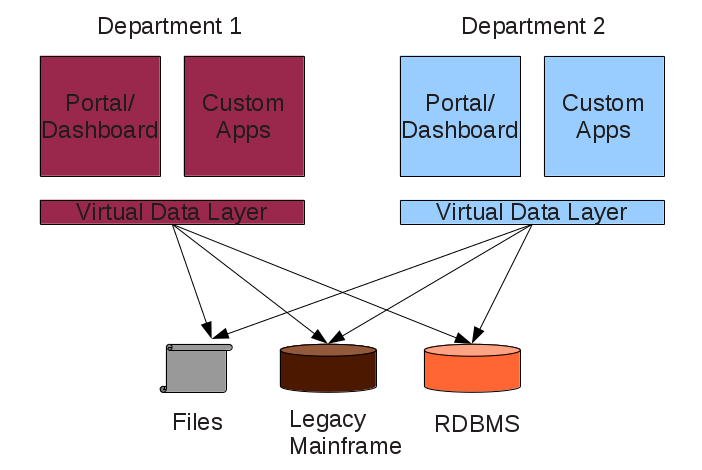
Assume departments 1 and 2, each with a data virtualization layer between their apps and the same backend resources:

Data Virtualization, Two Separate Layers

Requirement: Don’t maintain two separate data virtualization layers for the same resources.

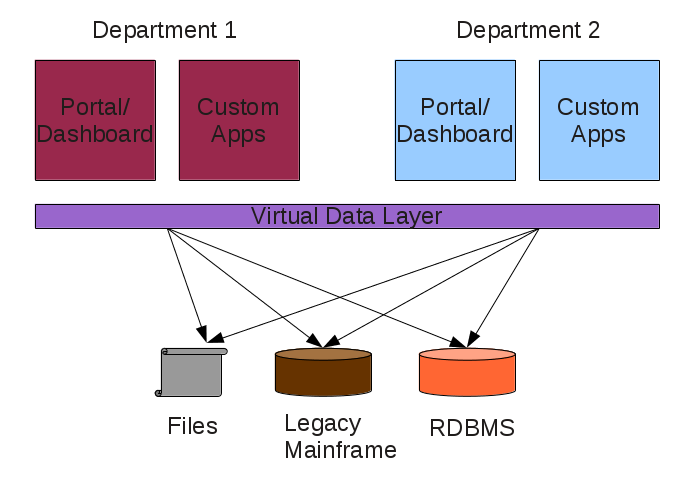
Desired result is:

Data Virtualization, One Layer

Questions: Must I return to the data resources to discover their semantices? To merge the two data virtualization layers?

Some may object there should only be one data virtualization layer.

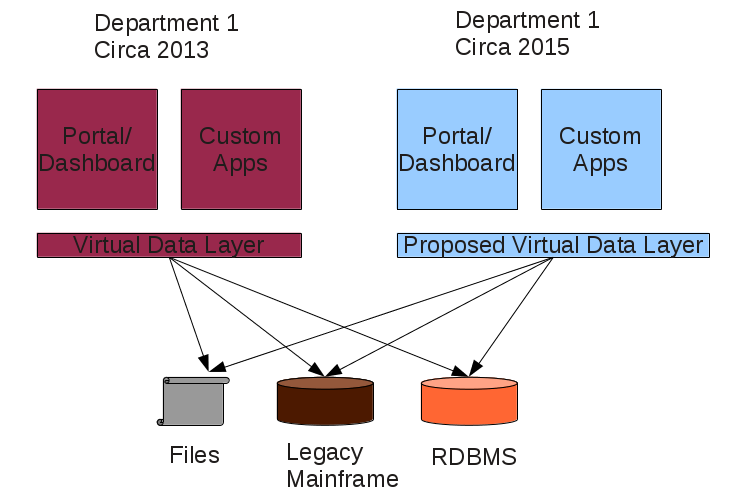
OK, so we have Department 1 – circa 2013 and Department 1 – circa 2015, different data virtualization requirements:

Data Virtualization, Future Layer

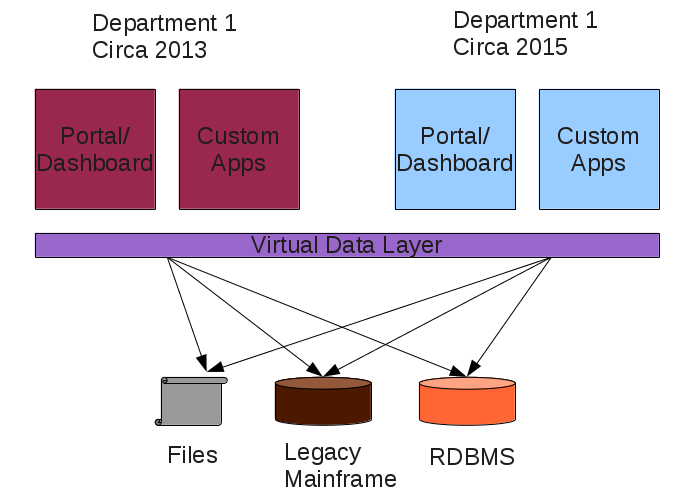
Desired result:

Data Virtualization, Future One Layer

Same Questions:

Question: Must I return to the data resources to discover their semantics? To merge the existing and proposed data virtualizaton layers?

The semantics of each item in the data sources (one hopes) was determined for the original data virtualization layer.

It’s wasteful to re-discover the same semantics for changes in data virtualization layers.

Curious, how rediscovery of semantics is avoided in data virtualization software?

Or for that matter, how do you interchange data virtualization layer mappings?

January 2, 2013

Introducing The Office for Creative Research

Filed under: Graphics,Visualization — Patrick Durusau @ 3:52 pm

New Year, New Company: Introducing The Office for Creative Research by Jer Thorpe.

From the post:

In the fall of 2010, my friend Mike Young invited me to come to the New York Times R&D Lab, to discuss a new visualization project that was just starting to get off of the ground. That project became Cascade, and that meeting led to my two-and-a-half year stay at the R&D Lab, as the first Data Artist in Residence. Yesterday, my residency at the New York Times came to an end. This morning, I’m thrilled to announce the official launch of my new company: The Office For Creative Research.

My 28 months (the residency was originally set for four months) at the New York Times was transformational in many, many ways. Cascade, which I initiated with Mark Hansen as a conceptual prototype, became a full-fledged project supported by an entire team of designers, developers and engineers. Along with Jake Porway, Brian House, and Matt Boggie, we built OpenPaths, which continues to be an exciting model for personal engagement with data. Mark and I, working with Alexis Lloyd, also made Memory Maps, a prototype for archive exploration, in which news stories are interwoven with the personal history of the user.

A company to watch for innovation in “…he borders between data, technology & culture….” Seminars and a journal at the end of 2013 are forthcoming.

I have posted about some of Jer’s work:

Infinite Weft (Exploring the Old Aesthetic)

Data in an Alien Context: Kepler Visualization Source Code

Jer Thorpe on “Data” and “History”

That is very little of all there is to see.

Certainly a likely partner/resource for complex topic map visualization projects.

How long is too long? Not long enough? Just right? (updated)

Filed under: Graphics,Humor — Patrick Durusau @ 3:15 pm

How long is too long? Not long enough? Just right? (updated) by Karen Suhaka.

From the post:

A little frivolous confection for your holiday enjoyment: comparing how long bills are in different states. Thanks to Rich for a lovely job on the maps, as usual.

As a first comment, the average word length across the country of words in bills is 6.16 letters, vs about 5 letters in common writing. Given the technical language, one would certainly expect words to be longer on average, and 20% longer seems reasonable. But really I wanted to compare how long bills were, in word count, not in letter count. To start with, let’s simply look at the average length length of bills (in words) by state. I was quite surprised by the variation between states. Ohio bills are, on average, longer then bills in Tennessee, by almost 500 words!

Interesting visualization of the word length of legislation, state by state in the United States.

I suspect your observations about word length and states will be more pointed than mine.

Wine industry network in the US

Filed under: Networks,Visualization — Patrick Durusau @ 3:03 pm

Wine industry network in the US by Nathan Yau.

Nathan points to an exploration of the wine network in the US. Like other markets, a few vendors dominate.

See what you make of the visualization and the underlying data.

Is there a mobile app for wine choices and locations? Perhaps with prices?

Thinking that could be extended to “tag” the “variety” that is actually the same vendor.

Cassandra 1.2.0 released

Filed under: Cassandra — Patrick Durusau @ 2:33 pm

Cassandra 1.2.0 released by Jonathan Ellis.

From the post:

The new year is here, and so is Cassandra 1.2.0!

Key improvements include:

2013 is going to be another good year to be a Cassandra user!

Reminder: What’s New in Apache Cassandra 1.2 [Webinar], Wednesday, January 9, 2013, Time: 11AM PT / 2 PM ET.

100 most read R posts for 2012 [No Data = No Topic Maps]

Filed under: Data Mining,R,Topic Maps — Patrick Durusau @ 11:42 am

Tal Galili writes in 100 most read R posts for 2012 (stats from R-bloggers) – big data, visualization, data manipulation, and other languages:

R-bloggers.com is now three years young. The site is an (unofficial) online journal of the R statistical programming environment, written by bloggers who agreed to contribute their R articles to the site.

Last year, I posted on the top 24 R posts of 2011. In this post I wish to celebrate R-bloggers’ third birthmounth by sharing with you:

  1. Links to the top 100 most read R posts of 2012
  2. Statistics on “how well” R-bloggers did this year
  3. My wishlist for the R community for 2013 (blogging about R, guest posts, and sponsors)

A number of posts on R that may be useful in data mining to create topic maps.

I retain my interest in the theory/cutting edge side of things. But discovering more than 1/2 $trillion in untraceable payments in a government report is a thrill. The 560+ $Billion Shell Game

It’s untraceable for members of the public. I am certain insiders at the OMB can trace it quite easily.

Which makes you wonder why they are hoarding that information?

Will try to season the blog with more data into topic maps type posts in 2013.

Suggestions and comments on potential data sets for topic maps most welcome!

« Newer PostsOlder Posts »

Powered by WordPress