Another Word For It Patrick Durusau on Topic Maps and Semantic Diversity

February 24, 2014

GenomeBrowse

Filed under: Bioinformatics,Genomics,Interface Research/Design,Visualization — Patrick Durusau @ 4:36 pm

GenomeBrowse

From the webpage:

Golden Helix GenomeBrowse® visualization tool is an evolutionary leap in genome browser technology that combines an attractive and informative visual experience with a robust, performance-driven backend. The marriage of these two equally important components results in a product that makes other browsers look like 1980s DOS programs.

Visualization Experience Like Never Before

GenomeBrowse makes the process of exploring DNA-seq and RNA-seq pile-up and coverage data intuitive and powerful. Whether viewing one file or many, an integrated approach is taken to exploring your data in the context of rich annotation tracks.

This experience features:

  • Zooming and navigation controls that are natural as they mimic panning and scrolling actions you are familiar with.
  • Coverage and pile-up views with different modes to highlight mismatches and look for strand bias.
  • Deep, stable stacking algorithms to look at all reads in a pile-up zoom, not just the first 10 or 20.
  • Context-sensitive information by clicking on any feature. See allele frequencies in control databases, functional predictions of a non-synonymous variants, exon positions of genes, or even details of a single sequenced read.
  • A dynamic labeling system which gives optimal detail on annotation features without cluttering the view.
  • The ability to automatically index and compute coverage data on BAM or VCF files in the background.

I’m very interested in seeing how the interface fares in the bioinformatics domain. Every domain is different but there may be some cross-over in term of popular UI features.

I first saw this in a tweet by Neil Saunders.

February 23, 2014

Understanding UMLS

Filed under: Bioinformatics,Medical Informatics,PubMed,UMLS — Patrick Durusau @ 6:02 pm

Understanding UMLS by Sujit Pal.

From the post:

I’ve been looking at Unified Medical Language System (UMLS) data this last week. The medical taxonomy we use at work is partly populated from UMLS, so I am familiar with the data, but only after it has been processed by our Informatics team. The reason I was looking at it is because I am trying to understand Apache cTakes, an open source NLP pipeline for the medical domain, which uses UMLS as one of its inputs.

UMLS is provided by the National Library of Medicine (NLM), and consists of 3 major parts: the Metathesaurus, consisting of over 1M medical concepts, a Semantic Network to categorize concepts by semantic type, and a Specialist Lexicon containing data to help do NLP on medical text. In addition, I also downloaded the RxNorm database that contains drug/medication information. I found that the biggest challenge was accessing the data, so I will describe that here, and point you to other web resources for the data descriptions.

Before getting the data, you have to sign up for a license with UMLS Terminology Services (UTS) – this is a manual process and can take a few days over email (I did this couple of years ago so details are hazy). UMLS data is distributed as .nlm files which can (as far as I can tell) be opened and expanded only by the Metamorphosis (mmsys) downloader, available on the UMLS download page. You need to run the following sequence of steps to capture the UMLS data into a local MySQL database. You can use other databases as well, but you would have to do a bit more work.

….

The table and column names are quite cryptic and the relationships are not evident from the tables. You will need to refer to the data dictionaries for each system to understand it before you do anything interesting with the data. Here are the links to the online references that describe the tables and their relationships for each system better than I can.

I have only captured the highlights from Sujit’s post so see his post for additional details.

There has been no small amount of time and effort invested in UMLS. Than names are cryptic and relationships not specified is more typical than any other state of data.

Take the opportunity to learn about UMLS and to ponder what solutions you would offer.

February 8, 2014

Big Mechanism (DARPA)

Filed under: Bioinformatics,Funding — Patrick Durusau @ 4:19 pm

Big Mechanism, Solicitation Number: DARPA-BAA-14-14

Reponse Data: Mar 18, 2014 12:00 pm Eastern

From the solicitation:

Here is one way to factor the technologies in the Big Mechanism program:

  1. Read abstracts and papers to extract fragments of causal mechanisms;
  2. Assemble fragments into more complete Big Mechanisms;
  3. Explain and reason with Big Mechanisms.

Here is a sample from Reading:

As with all natural language processing, Reading is bedeviled by ambiguity [5]. The mapping of named entities to biological entities is many-to-many. Context matters, but is often missing; for example, the organism in which a pathway is studied might be mentioned once at the beginning of a document and ignored thereafter. Although the target semantics involves processes, these can be described at different levels of detail and precision. For example, “β-catenin is a critical component of Wnt-mediated transcriptional activation” tells us only that β-catenin is involved in a process; whereas, “ARF6 activation promotes the intracellular accumulation of β-catenin” tells us that ARF6 promotes a process; and “L-cells treated with the GSK3 β inhibitor LiCl (50 mM) . . . showed a marked increase in β-catenin fluorescence within 30 – 60 min” describes the kinetics of a process. Processes also can be described as modular abstractions, as in “. . . the endocytosis of growth factor receptors and robust activation of extracellular signal-regulated kinase”. It might be possible to extract causal skeletons of complicated processes (i.e., the entities and how they causally influence each other) by reading abstracts, but it seems likely that extracting the kinetics of processes will require reading full papers. It is unclear whether this program will be able to provide useful explanations of processes if it doesn’t extract the kinetics of these processes.

An interesting solicitation. Yes?

I thought it was odd though that the solicitation starts out with:

DARPA is soliciting innovative research proposals in the area of reading research papers and abstracts to construct and reason over explanatory, causal models of complicated systems. Proposed research should investigate innovative approaches that enable revolutionary advances in science, devices, or systems. Specifically excluded is research that primarily results in evolutionary improvements to the existing state of practice. (emphasis added)

But then gives the goals for 18 months in part as:

  • Development of a formal representation language for biological processes;
  • Extraction of fragments of known signaling networks from a relatively small and carefully selected corpus of texts and encoding of these fragments in a formal language;

Aren’t people developing formal languages to track signaling networks right now? I am puzzled how that squares with the criteria:

Specifically excluded is research that primarily results in evolutionary improvements to the existing state of practice. ?

It does look like an exciting project, assuming it isn’t limited to current approaches.

February 3, 2014

Parallel implementation of 3D protein structure similarity searches…

Filed under: Bioinformatics,GPU,Similarity,Similarity Retrieval — Patrick Durusau @ 8:41 pm

Parallel implementation of 3D protein structure similarity searches using a GPU and the CUDA by Dariusz Mrozek, Milosz Brozek, and Bozena Malysiak-Mrozek.

Abstract:

Searching for similar 3D protein structures is one of the primary processes employed in the field of structural bioinformatics. However, the computational complexity of this process means that it is constantly necessary to search for new methods that can perform such a process faster and more efficiently. Finding molecular substructures that complex protein structures have in common is still a challenging task, especially when entire databases containing tens or even hundreds of thousands of protein structures must be scanned. Graphics processing units (GPUs) and general purpose graphics processing units (GPGPUs) can perform many time-consuming and computationally demanding processes much more quickly than a classical CPU can. In this paper, we describe the GPU-based implementation of the CASSERT algorithm for 3D protein structure similarity searching. This algorithm is based on the two-phase alignment of protein structures when matching fragments of the compared proteins. The GPU (GeForce GTX 560Ti: 384 cores, 2GB RAM) implementation of CASSERT (“GPU-CASSERT”) parallelizes both alignment phases and yields an average 180-fold increase in speed over its CPU-based, single-core implementation on an Intel Xeon E5620 (2.40GHz, 4 cores). In this paper, we show that massive parallelization of the 3D structure similarity search process on many-core GPU devices can reduce the execution time of the process, allowing it to be performed in real time. GPU-CASSERT is available at: http://zti.polsl.pl/dmrozek/science/gpucassert/cassert.htm.

Seventeen pages of heavy sledding but an average of 180-fold increase in speed? That’s worth the effort.

Sorry, I got distracted. How difficult did you say your subject similarity/identity problem was? 😉

January 31, 2014

Open Science Leaps Forward! (Johnson & Johnson)

Filed under: Bioinformatics,Biomedical,Data,Medical Informatics,Open Data,Open Science — Patrick Durusau @ 11:15 am

In Stunning Win For Open Science, Johnson & Johnson Decides To Release Its Clinical Trial Data To Researchers by Matthew Herper.

From the post:

Drug companies tend to be secretive, to say the least, about studies of their medicines. For years, negative trials would not even be published. Except for the U.S. Food and Drug Administration, nobody got to look at the raw information behind those studies. The medical data behind important drugs, devices, and other products was kept shrouded.

Today, Johnson & Johnson is taking a major step toward changing that, not only for drugs like the blood thinner Xarelto or prostate cancer pill Zytiga but also for the artificial hips and knees made for its orthopedics division or even consumer products. “You want to know about Listerine trials? They’ll have it,” says Harlan Krumholz of Yale University, who is overseeing the group that will release the data to researchers.

….

Here’s how the process will work: J&J has enlisted The Yale School of Medicine’s Open Data Access Project (YODA) to review requests from physicians to obtain data from J&J products. Initially, this will only include products from the drug division, but it will expand to include devices and consumer products. If YODA approves a request, raw, anonymized data will be provided to the physician. That includes not just the results of a study, but the results collected for each patient who volunteered for it with identifying information removed. That will allow researchers to re-analyze or combine that data in ways that would not have been previously possible.

….

Scientists can make a request for data on J&J drugs by going to www.clinicaltrialstudytransparency.com.

The ability to “…re-analyze or combine that data in ways that would not have been previously possible…” is the public benefit of Johnson & Johnson’s sharing of data.

With any luck, this will be the start of a general trend among drug companies.

Mappings of the semantics of such data sets should be contributed back to the Yale School of Medicine’s Open Data Access Project (YODA), to further enhance re-use of these data sets.

January 29, 2014

Applying linked data approaches to pharmacology:…

Applying linked data approaches to pharmacology: Architectural decisions and implementation by Alasdair J.G. Gray, et. al.

Abstract:

The discovery of new medicines requires pharmacologists to interact with a number of information sources ranging from tabular data to scientific papers, and other specialized formats. In this application report, we describe a linked data platform for integrating multiple pharmacology datasets that form the basis for several drug discovery applications. The functionality offered by the platform has been drawn from a collection of prioritised drug discovery business questions created as part of the Open PHACTS project, a collaboration of research institutions and major pharmaceutical companies. We describe the architecture of the platform focusing on seven design decisions that drove its development with the aim of informing others developing similar software in this or other domains. The utility of the platform is demonstrated by the variety of drug discovery applications being built to access the integrated data.

An alpha version of the OPS platform is currently available to the Open PHACTS consortium and a first public release will be made in late 2012, see http://www.openphacts.org/ for details.

The paper acknowledges that present database entries lack semantics.

A further challenge is the lack of semantics associated with links in traditional database entries. For example, the entry in UniProt for the protein “kinase C alpha type homo sapien4 contains a link to the Enzyme database record 5, which has complementary data about the same protein and thus the identifiers can be considered as being equivalent. One approach to resolve this, proposed by Identifiers.org, is to provide a URI for the concept which contains links to the database records about the concept [27]. However, the UniProt entry also contains a link to the DrugBank compound “Phosphatidylserine6. Clearly, these concepts are not identical as one is a protein and the other a chemical compound. The link in this case is representative of some interaction between the compound and the protein, but this is left to a human to interpret. Thus, for successful data integration one must devise strategies that address such inconsistencies within the existing data.

I would have said databases lack properties to identify the subjects in question but there is little difference in the outcome of our respective positions, i.e., we need more semantics to make robust use of existing data.

Perhaps even more importantly, the paper treats “equality” as context dependent:

Equality is context dependent

Datasets often provide links to equivalent concepts in other datasets. These result in a profusion of “equivalent” identifiers for a concept. Identifiers.org provide a single identifier that links to all the underlying equivalent dataset records for a concept. However, this constrains the system to a single view of the data, albeit an important one.

A novel approach to instance level links between the datasets is used in the OPS platform. Scientists care about the types of links between entities: different scientists will accept concepts being linked in different ways and for different tasks they are willing to accept different forms of relationships. For example, when trying to find the targets that a particular compound interacts with, some data sources may have created mappings to gene rather than protein identifiers: in such instances it may be acceptable to users to treat gene and protein IDs as being in some sense equivalent. However, in other situations this may not be acceptable and the OPS platform needs to allow for this dynamic equivalence within a scientific context. As a consequence, rather than hard coding the links into the datasets, the OPS platform defers the instance level links to be resolved during query execution by the Identity Mapping Service (IMS). Thus, by changing the set of dataset links used to execute the query, different interpretations over the data can be provided.

Opaque mappings between datasets, i.e., mappings that don’t assign properties to source, target and then say what properties or conditions must be met for the mapping to be vaild, are of little use. Rely on opaque mappings at your own risk.

On the other hand, I fully agree that equality is context dependent and the choice of the criteria for equivalence should be left up to users. I suppose in that sense if users wanted to rely on opaque mappings, that would be their choice.

While an exciting paper, it is discussing architectural decisions and so we are not at the point of debating these issues in detail. It promises to be an exciting discussion!

January 26, 2014

EVEX

Filed under: Bioinformatics,Biomedical,Genomics — Patrick Durusau @ 8:25 pm

EVEX

From the about page:

EVEX is a text mining resource built on top of PubMed abstracts and PubMed Central full text articles. It contains over 40 million bio-molecular events among more than 76 million automatically extracted gene/protein name mentions. The text mining data further has been enriched with gene identifiers and gene families from Ensembl and HomoloGene, providing homology-based event generalizations. EVEX presents both direct and indirect associations between genes and proteins, enabling explorative browsing of relevant literature.

Ok, it’s not web-scale but it is important information. 😉

What I find the most interesting is the “…direct and indirect associations between genes and proteins, enabling explorative browsing of the relevant literature.”

See their tutorial on direct and indirect associations.

I think part of the lesson here is that no matter how gifted, a topic map with static associations limits a user’s ability to explore the infoverse.

That may work quite well where uniform advice, even if incorrect, is preferred over exploration. However, in rapidly changing areas like medical research, static associations could be more of a hindrance than a boon.

January 20, 2014

Data sharing, OpenTree and GoLife

Filed under: Biodiversity,Bioinformatics,Biology,Data Integration — Patrick Durusau @ 3:14 pm

Data sharing, OpenTree and GoLife

From the post:

NSF has released GoLife, the new solicitation that replaces both AToL and AVAToL. From the GoLife text:

The goals of the Genealogy of Life (GoLife) program are to resolve the phylogenetic history of life and to integrate this genealogical architecture with underlying organismal data.

Data completeness, open data and data integration are key components of these proposals – inferring well-sampled trees that are linked with other types of data (molecular, morphological, ecological, spatial, etc) and made easily available to scientific and non-scientific users. The solicitation requires that trees published by GoLife projects are published in a way that allows them to be understood and re-used by Open Tree of Life and other projects:

Integration and standardization of data consistent with three AVAToL projects: Open Tree of Life (www.opentreeoflife.org), ARBOR (www.arborworkflows.com), and Next Generation Phenomics (www.avatol.org/ngp) is required. Other data should be made available through broadly accessible community efforts (i.e., specimen data through iDigBio, occurrence data through BISON, etc). (I corrected the URLs for ARBOR and Next Generation Phenomics)

What does it mean to publish data consistent with Open Tree of Life? We have a short page on data sharing with OpenTree, a publication coming soon (we will update this post when it comes out) and we will be releasing our new curation / validation tool for phylogenetic data in the next few weeks.

A great resource on the NSF GoLife proposal that I just posted about.

Some other references:

AToL – Assembling the Tree of Life

AVATOL – Assembling, Visualizing and Analyzing the Tree of Life

Be sure to contact the Open Tree of Life group if you are interested in the GoLife project.

Genealogy of Life (GoLife)

Filed under: Bioinformatics,Biology,Data Integration — Patrick Durusau @ 2:43 pm

Genealogy of Life (GoLife) NSF.


Full Proposal Deadline Date: March 26, 2014
Fourth Wednesday in March, Annually Thereafter

Synopsis:

All of comparative biology depends on knowledge of the evolutionary relationships (phylogeny) of living and extinct organisms. In addition, understanding biodiversity and how it changes over time is only possible when Earth’s diversity is organized into a phylogenetic framework. The goals of the Genealogy of Life (GoLife) program are to resolve the phylogenetic history of life and to integrate this genealogical architecture with underlying organismal data.

The ultimate vision of this program is an open access, universal Genealogy of Life that will provide the comparative framework necessary for testing questions in systematics, evolutionary biology, ecology, and other fields. A further strategic integration of this genealogy of life with data layers from genomic, phenotypic, spatial, ecological and temporal data will produce a grand synthesis of biodiversity and evolutionary sciences. The resulting knowledge infrastructure will enable synthetic research on biological dynamics throughout the history of life on Earth, within current ecosystems, and for predictive modeling of the future evolution of life.

Projects submitted to this program should emphasize increased efficiency in contributing to a complete Genealogy of Life and integration of various types of organismal data with phylogenies.

This program also seeks to broadly train next generation, integrative phylogenetic biologists, creating the human resource infrastructure and workforce needed to tackle emerging research questions in comparative biology. Projects should train students for diverse careers by exposing them to the multidisciplinary areas of research within the proposal.

You may have noticed the emphasis on data integration:

to integrate this genealogical architecture with underlying organismal data.

comparative framework necessary for testing questions in systematics, evolutionary biology, ecology, and other fields

strategic integration of this genealogy of life with data layers from genomic, phenotypic, spatial, ecological and temporal data

synthetic research on biological dynamics

integration of various types of organismal data with phylogenies

next generation, integrative phylogenetic biologists

That sounds like a tall order! Particularly if your solution does not enable researchers to ask on what basis data was integrated as it was and by who?

If you can’t ask and answer those two questions, the more data and integration you mix together, the more fragile the integration structure will become.

I’m not trying to presume that such a project will use dynamic merging because it may well not. “Merging” in topic map terms may well be an operation ordered by a member of a group of curators. It is the capturing of the basis for that operation that makes it maintainable over a series of curators through time.

I first saw this at: Data sharing, OpenTree and GoLife, which I am about to post on but thought the NSF call merited a separate post as well.

January 17, 2014

Open Educational Resources for Biomedical Big Data

Filed under: BigData,Bioinformatics,Biomedical,Funding — Patrick Durusau @ 3:38 pm

Open Educational Resources for Biomedical Big Data (R25)

Deadline for submission: April 1, 2014

Additional information: bd2k_training@mail.nih.gov

As part of the NIH Big Data to Knowledge (BD2K) project, BD2K R25 FOA will support:

Curriculum or Methods Development of innovative open educational resources that enhance the ability of the workforce to use and analyze biomedical Big Data.

The challenges:

The major challenges to using biomedical Big Data include the following:

Locating data and software tools: Investigators need straightforward means of knowing what datasets and software tools are available and where to obtain them, along with descriptions of each dataset or tool. Ideally, investigators should be able to easily locate all published and resource datasets and software tools, both basic and clinical, and, to the extent possible, unpublished or proprietary data and software.

Gaining access to data and software tools: Investigators need straightforward means of 1) releasing datasets and metadata in standard formats; 2) obtaining access to specific datasets or portions of datasets; 3) studying datasets with the appropriate software tools in suitable environments; and 4) obtaining analyzed datasets.

Standardizing data and metadata: Investigators need data to be in standard formats to facilitate interoperability, data sharing, and the use of tools to manage and analyze the data. The datasets need to be described by standard metadata to allow novel uses as well as reuse and integration.

Sharing data and software: While significant progress has been made in broad and rapid sharing of data and software, it is not yet the norm in all areas of biomedical research. More effective data- and software-sharing would be facilitated by changes in the research culture, recognition of the contributions made by data and software generators, and technical innovations. Validation of software to ensure quality, reproducibility, provenance, and interoperability is a notable goal.

Organizing, managing, and processing biomedical Big Data: Investigators need biomedical data to be organized and managed in a robust way that allows them to be fully used; currently, most data are not sufficiently well organized. Barriers exist to releasing, transferring, storing, and retrieving large amounts of data. Research is needed to design innovative approaches and effective software tools for organizing biomedical Big Data for data integration and sharing while protecting human subject privacy.

Developing new methods for analyzing biomedical Big Data: The size, complexity, and multidimensional nature of many datasets make data analysis extremely challenging. Substantial research is needed to develop new methods and software tools for analyzing such large, complex, and multidimensional datasets. User-friendly data workflow platforms and visualization tools are also needed to facilitate the analysis of Big Data.

Training researchers for analyzing biomedical Big Data: Advances in biomedical sciences using Big Data will require more scientists with the appropriate data science expertise and skills to develop methods and design tools, including those in many quantitative science areas such as computational biology, biomedical informatics, biostatistics, and related areas. In addition, users of Big Data software tools and resources must be trained to utilize them well.

Another big data biomedical data integration funding opportunity!

I do wonder about the suggestion:

The datasets need to be described by standard metadata to allow novel uses as well as reuse and integration.

Do they mean:

“Standard” metadata for a particular academic lab?

“Standard” metadata for a particular industry lab?

“Standard” metadata for either one five (5) years ago?

“Standard” metadata for either one (5) years from now?

The problem being the familiar one that knowledge that isn’t moving forward is outdated.

It’s hard to do good research with outdated information.

Making metadata dynamic, so that it reflects yesterday’s terminology, today’s and someday tomorrow’s, would be far more useful.

The metadata displayed to any user would be their choice of metadata and not the complexities that make the metadata dynamic.

Interested?
January 16, 2014

Courses for Skills Development in Biomedical Big Data Science

Filed under: BigData,Bioinformatics,Biomedical,Funding — Patrick Durusau @ 6:45 pm

Courses for Skills Development in Biomedical Big Data Science

Deadline for submission: April 1, 2014

Additional information: bd2k_training@mail.nih.gov

As part of the NIH Big Data to Knowledge (BD2K) the purpose of BD2K R25 FOA will support:

Courses for Skills Development in topics necessary for the utilization of Big Data, including the computational and statistical sciences in a biomedical context. Courses will equip individuals with additional skills and knowledge to utilize biomedical Big Data.

Challenges in biomedical Big Data?

The major challenges to using biomedical Big Data include the following:

Locating data and software tools: Investigators need straightforward means of knowing what datasets and software tools are available and where to obtain them, along with descriptions of each dataset or tool. Ideally, investigators should be able to easily locate all published and resource datasets and software tools, both basic and clinical, and, to the extent possible, unpublished or proprietary data and software.

Gaining access to data and software tools: Investigators need straightforward means of 1) releasing datasets and metadata in standard formats; 2) obtaining access to specific datasets or portions of datasets; 3) studying datasets with the appropriate software tools in suitable environments; and 4) obtaining analyzed datasets.

Standardizing data and metadata: Investigators need data to be in standard formats to facilitate interoperability, data sharing, and the use of tools to manage and analyze the data. The datasets need to be described by standard metadata to allow novel uses as well as reuse and integration.

Sharing data and software: While significant progress has been made in broad and rapid sharing of data and software, it is not yet the norm in all areas of biomedical research. More effective data- and software-sharing would be facilitated by changes in the research culture, recognition of the contributions made by data and software generators, and technical innovations. Validation of software to ensure quality, reproducibility, provenance, and interoperability is a notable goal.

Organizing, managing, and processing biomedical Big Data: Investigators need biomedical data to be organized and managed in a robust way that allows them to be fully used; currently, most data are not sufficiently well organized. Barriers exist to releasing, transferring, storing, and retrieving large amounts of data. Research is needed to design innovative approaches and effective software tools for organizing biomedical Big Data for data integration and sharing while protecting human subject privacy.

Developing new methods for analyzing biomedical Big Data: The size, complexity, and multidimensional nature of many datasets make data analysis extremely challenging. Substantial research is needed to develop new methods and software tools for analyzing such large, complex, and multidimensional datasets. User-friendly data workflow platforms and visualization tools are also needed to facilitate the analysis of Big Data.

Training researchers for analyzing biomedical Big Data: Advances in biomedical sciences using Big Data will require more scientists with the appropriate data science expertise and skills to develop methods and design tools, including those in many quantitative science areas such as computational biology, biomedical informatics, biostatistics, and related areas. In addition, users of Big Data software tools and resources must be trained to utilize them well.

It’s hard to me to read that list and not see subject identity as playing some role in meeting all of those challenges. Not a complete solution because there are a variety of problems in each challenge. But to preserve access to data sets over time, issues and approaches, subject identity is a necessary component of any solution.

Applicants have to be institutions of higher education but I assume they can hire expertise as required.

January 6, 2014

Needles in Stacks of Needles:…

Filed under: Bioinformatics,Biomedical,Genomics,Searching,Visualization — Patrick Durusau @ 3:33 pm

Needles in Stacks of Needles: genomics + data mining by Martin Krzywinski. (ICDM2012 Keynote)

Abstract:

In 2001, the first human genome sequence was published. Now, just over 10 years later, we capable of sequencing a genome in just a few days. Massive parallel sequencing projects now make it possible to study the cancers of thousands of individuals. New data mining approaches are required to robustly interrogate the data for causal relationships among the inherently noisy biology. How does one identify genetic changes that are specific and causal to a disease within the rich variation that is either natural or merely correlated? The problem is one of finding a needle in a stack of needles. I will provide a non-specialist introduction to data mining methods and challenges in genomics, with a focus on the role visualization plays in the exploration of the underlying data.

This page links to the slides Martin used in his presentation.

Excellent graphics and a number of amusing points, even without the presentation itself:

Cheap Data: A fruit fly that expresses high sensitivity to alcohol.

Kenny: A fruit fly without this gene dies in two days, named for the South Park character who dies in each episode.

Ken and Barbie: Fruit flys that fail to develop external genitalia.

One observation that rings true across disciplines:

Literature is still largely composed and published opaquely.

I searched for a video recording of the presentation but came up empty.

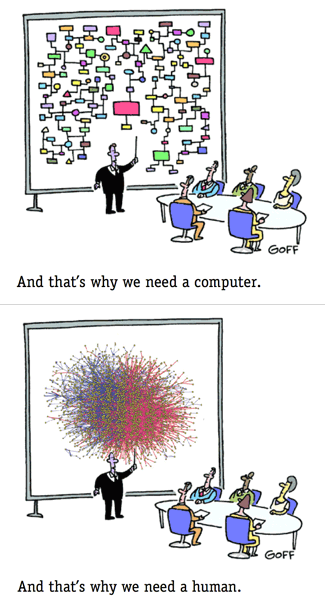
Need a Human

Filed under: Bioinformatics,Biomedical,Genomics — Patrick Durusau @ 11:38 am

Need a Human

Shamelessly stolen from Martin Krzywinski’s ICDM2012 Keynote — Needles in Stacks of Needles.

I am about to post on that keynote but thought the image merited a post of its own.

December 27, 2013

Galaxy:…

Filed under: Bioinformatics,Biomedical,Biostatistics — Patrick Durusau @ 5:41 pm

Galaxy: Data Intensive Biology For Everyone

From the website:

Galaxy is an open, web-based platform for data intensive biomedical research. Whether on the free public server or your own instance, you can perform, reproduce, and share complete analyses.

From the Galaxy wiki:

Galaxy is an open, web-based platform for accessible, reproducible, and transparent computational biomedical research.

  • Accessible: Users without programming experience can easily specify parameters and run tools and workflows.
  • Reproducible: Galaxy captures information so that any user can repeat and understand a complete computational analysis.
  • Transparent: Users share and publish analyses via the web and create Pages, interactive, web-based documents that describe a complete analysis.

This is the Galaxy Community Wiki. It describes all things Galaxy.

Whether you are a home bio-hacker or an IT person looking to understand computational biology, Galaxy may be a good fit for you.

You can try out the public server before troubling to install it locally. Assuming you are paranoid about your bits going over the network. 😉

December 24, 2013

Resource Identification Initiative

Filed under: Bioinformatics,Biomedical,Medical Informatics — Patrick Durusau @ 4:30 pm

Resource Identification Initiative

From the webpage:

We are starting a pilot project, sponsored by the Neuroscience Information Framework and the International Neuroinformatics Coordinating Facility, to address the issue of proper resource identification within the neuroscience (actually biomedical) literature. We have now christened this project the Resource Identification Initiative (hastag #RII) and expanded the scope beyond neuroscience. This project is designed to make it easier for researchers to identify the key resources (materials, data, tools) used to produce the scientific findings within a published study and to find other studies that used the same resources. It is also designed to make it easier for resource providers to track usage of their resources and for funders to measure impacts of resource funding. The requirements are that key resources are identified in such a manner that they are identified uniquely and are:

1) Machine readable;

2) Are available outside the paywall;

3) Are uniform across publishers and journals. We are seeking broad input from the FORCE11 community to ensure that we come up with a solution that represents the best thinking available on these topics.

The pilot project was an outcome of a meeting held at the NIH on Jun 26th. A draft report from the June 26th Resource Identification meeting at the NIH is now available. As the report indicates, we have preliminary agreements from journals and publishers to implement a pilot project. We hope to extend this project well beyond the neuroscience literature, so please join this group if you are interested in participating.

….

Yes, another “unique identifier” project.

Don’t get me wrong, to the extent that a unique vocabulary can be developed and used, that’s great.

But it does not address:

  • tools/techniques/data that existed before the unique vocabulary came into existence
  • future tools/techniques/data that isn’t covered by the unique vocabulary
  • mappings between old, current and future tool/techniques/data

The project is trying to address a real need in neuroscience journals (lack of robust identification of organisms or antibodies).

If you have the time and interest, it is a worthwhile project that needs to consider the requirements for “robust” identification.

December 6, 2013

Analysis of PubMed search results using R

Filed under: Bioinformatics,PubMed,R — Patrick Durusau @ 8:35 pm

Analysis of PubMed search results using R by Pilar Cacheiro.

From the post:

Looking for information about meta-analysis in R (subject for an upcoming post as it has become a popular practice to analyze data from different Genome Wide Association studies) I came across this tutorial from The R User Conference 2013 – I couldn´t make it this time, even when it was held so close, maybe Los Angeles next year…

Back to the topic at hand, that is how I found out about the RISmed package which is meant to retrieve information from PubMed. It looked really interesting because, as you may imagine,this is one of the most used resources in my daily routine.

Its use is quite straightforward. First, you define the query and download data from the database (be careful about your IP being blocked from accessing NCBI in the case of large jobs!) . Then, you might use the information to look for trends on a topic of interest or extracting specific information from abstracts, getting descriptives,…

Pliar does a great job introducing RISmed and pointing to additional sources for more examples and discussion of the package.

Meta-analysis is great but you could also be selling the results of your queries to PubMed.

After all, they would be logging your IP address, not that of your client.

Some people prefer more anonymity than others and are willing to pay for that privilege.

December 2, 2013

NIH deposits first batch of genomic data for Alzheimer’s disease

Filed under: Bioinformatics,Genomics,Medical Informatics — Patrick Durusau @ 5:44 pm

NIH deposits first batch of genomic data for Alzheimer’s disease

From the post:

Researchers can now freely access the first batch of genome sequence data from the Alzheimer’s Disease Sequencing Project (ADSP), the National Institutes of Health (NIH) announced today. The ADSP is one of the first projects undertaken under an intensified national program of research to prevent or effectively treat Alzheimer’s disease.

The first data release includes data from 410 individuals in 89 families. Researchers deposited completed WGS data on 61 families and have deposited WGS data on parts of the remaining 28 families, which will be completed soon. WGS determines the order of all 3 billion letters in an individual’s genome. Researchers can access the sequence data at dbGaP or the National Institute on Aging Genetics of Alzheimer’s Disease Data Storage Site (NIAGADS), https://www.niagads.org.

“Providing raw DNA sequence data to a wide range of researchers proves a powerful crowd-sourced way to find genomic changes that put us at increased risk for this devastating disease,” said NIH Director, Francis S. Collins, M.D., Ph.D., who announced the start of the project in February 2012. “The ADSP is designed to identify genetic risks for late-onset of Alzheimer’s disease, but it could also discover versions of genes that protect us. These insights could lead to a new era in prevention and treatment.”

As many as 5 million Americans 65 and older are estimated to have Alzheimer’s disease, and that number is expected to grow significantly with the aging of the baby boom generation. The National Alzheimer’s Project Act became law in 2011 in recognition of the need to do more to combat the disease. The law called for upgrading research efforts by the public and private sectors, as well as expanding access to and improving clinical and long term care. One of the first actions taken by NIH under Alzheimer’s Act was the allocation of additional funding in fiscal 2012 for a series of studies, including this genome sequencing effort. Today’s announcement marks the first data release from that project.

You will need to join with or enlist in a open project with bioinformatics and genmics expertise to make a contribution but the data is “out there.”

Not to mention the need to integrate existing medical literature, legacy data from prior patients, drug trials, etc., despite usual semantic confusion of the same.

November 26, 2013

Ten Quick Tips for Using the Gene Ontology

Filed under: Bioinformatics,Gene Ontology,Genomics,Ontology — Patrick Durusau @ 10:39 am

Ten Quick Tips for Using the Gene Ontology by Judith A. Blake.

From the post:

The Gene Ontology (GO) provides core biological knowledge representation for modern biologists, whether computationally or experimentally based. GO resources include biomedical ontologies that cover molecular domains of all life forms as well as extensive compilations of gene product annotations to these ontologies that provide largely species-neutral, comprehensive statements about what gene products do. Although extensively used in data analysis workflows, and widely incorporated into numerous data analysis platforms and applications, the general user of GO resources often misses fundamental distinctions about GO structures, GO annotations, and what can and can not be extrapolated from GO resources. Here are ten quick tips for using the Gene Ontology.

Tip 1: Know the Source of the GO Annotations You Use

Tip 2: Understand the Scope of GO Annotations

Tip 3: Consider Differences in Evidence Codes

Tip 4: Probe Completeness of GO Annotations

Tip 5: Understand the Complexity of the GO Structure

Tip 6: Choose Analysis Tools Carefully

Tip 7: Provide the Version of the Data/Tools Used

Tip 8: Seek Input from the GOC Community and Make Use of GOC Resources

Tip 9: Contribute to the GO

Tip 10: Acknowledge the Work of the GO Consortium

See Judith’s article for her comments and pointers under each tip.

The take away here is that an ontology may have the information you are looking for, but understanding what you have found is an entirely different matter.

For GO, follow Judith’s specific suggestions/tips, for any other ontology, take steps to understand the ontology before relying upon it.

I first saw this in a tweet by Stephen Turner.

November 13, 2013

BioCreative Resources (and proceedings)

Filed under: Bioinformatics,Curation,Text Mining — Patrick Durusau @ 7:25 pm

BioCreative Resources (and proceedings)

From the Overview page:

The growing interest in information retrieval (IR), information extraction (IE) and text mining applied to the biological literature is related to the increasing accumulation of scientific literature (PubMed has currently (2005) over 15,000,000 entries) as well as the accelerated discovery of biological information obtained through characterization of biological entities (such as genes and proteins) using high-through put and large scale experimental techniques [1].

Computational techniques which process the biomedical literature are useful to enhance the efficient access to relevant textual information for biologists, bioinformaticians as well as for database curators. Many systems have been implemented which address the identification of gene/protein mentions in text or the extraction of text-based protein-protein interactions and of functional annotations using information extraction and text mining approaches [2].

To be able to evaluate performance of existing tools, as well as to allow comparison between different strategies, common evaluation standards as well as data sets are crucial. In the past, most of the implementations have focused on different problems, often using private data sets. As a result, it has been difficult to determine how good the existing systems were or to reproduce the results. It is thus cumbersome to determine whether the systems would scale to real applications, and what performance could be expected using a different evaluation data set [3-4].

The importance of assessing and comparing different computational methods have been realized previously by both, the bioinformatics and the NLP communities. Researchers in natural language processing (NLP) and information extraction (IE) have, for many years now, used common evaluations to accelerate their research progress, e.g., via the Message Understanding Conferences (MUCs) [5] and the Text Retrieval Conferences (TREC) [6]. This not only resulted in the formulation of common goals but also made it possible to compare different systems and gave a certain transparency to the field. With the introduction of a common evaluation and standardized evaluation metrics, it has become possible to compare approaches, to assess what techniques did and did not work, and to make progress. This progress has resulted in the creation of standard tools available to the general research community.

The field of bioinformatics also has a tradition of competitions, for example, in protein structure prediction (CASP [7]) or gene predictions in entire genomes (at the “Genome Based Gene Structure Determination” symposium held on the Wellcome Trust Genome Campus).

There has been a lot of activity in the field of text mining in biology, including sessions at the Pacific Symposium of Biocomputing (PSB [8]), the Intelligent Systems for Molecular Biology (ISMB) and European Conference on Computational Biology (ECCB) conferences [9] as well workshops and sessions on language and biology in computational linguistics (the Association of Computational Linguistics BioNLP SIGs).

A small number of complementary evaluations of text mining systems in biology have been recently carried out, starting with the KDD cup [10] and the genomics track at the TREC conference [11]. Therefore we decided to set up the first BioCreAtIvE challenge which was concerned with the identification of gene mentions in text [12], to link texts to actual gene entries, as provided by existing biological databases, [13] as well as extraction of human gene product (Gene Ontology) annotations from full text articles [14]. The success of this first challenge evaluation as well as the lessons learned from it motivated us to carry out the second BioCreAtIvE, which should allow us to monitor improvements and build on the experience and data derived from the first BioCreAtIvE challenge. As in the previous BioCreAtIvE, the main focus is on biologically relevant tasks, which should result in benefits for the biomedical text mining community, the biology and biological database community, as well as the bioinformatics community.

A gold mine of resources if you are interested in bioinformatics, curation or IR in general.

Including the BioCreative Proceedings for 2013:

BioCreative IV Proceedings vol. 1

BioCreative IV Proceedings vol. 2

CoIN: a network analysis for document triage

Filed under: Bioinformatics,Curation,Entities,Entity Extraction — Patrick Durusau @ 7:16 pm

CoIN: a network analysis for document triage by Yi-Yu Hsu and Hung-Yu Kao. (Database (2013) 2013 : bat076 doi: 10.1093/database/bat076)

Abstract:

In recent years, there was a rapid increase in the number of medical articles. The number of articles in PubMed has increased exponentially. Thus, the workload for biocurators has also increased exponentially. Under these circumstances, a system that can automatically determine in advance which article has a higher priority for curation can effectively reduce the workload of biocurators. Determining how to effectively find the articles required by biocurators has become an important task. In the triage task of BioCreative 2012, we proposed the Co-occurrence Interaction Nexus (CoIN) for learning and exploring relations in articles. We constructed a co-occurrence analysis system, which is applicable to PubMed articles and suitable for gene, chemical and disease queries. CoIN uses co-occurrence features and their network centralities to assess the influence of curatable articles from the Comparative Toxicogenomics Database. The experimental results show that our network-based approach combined with co-occurrence features can effectively classify curatable and non-curatable articles. CoIN also allows biocurators to survey the ranking lists for specific queries without reviewing meaningless information. At BioCreative 2012, CoIN achieved a 0.778 mean average precision in the triage task, thus finishing in second place out of all participants.

Database URL: http://ikmbio.csie.ncku.edu.tw/coin/home.php

From the introduction:

Network analysis concerns the relationships between processing entities. For example, the nodes in a social network are people, and the links are the friendships between the nodes. If we apply these concepts to the ACT, PubMed articles are the nodes, while the co-occurrences of gene–disease, gene–chemical and chemical–disease relationships are the links. Network analysis provides a visual map and a graph-based technique for determining co-occurrence relationships. These graphical properties, such as size, degree, centralities and similar features, are important. By examining the graphical properties, we can gain a global understanding of the likely behavior of the network. For this purpose, this work focuses on two themes concerning the applications of biocuration: using the co-occurrence–based approach to obtain a normalized co-occurrence score and using the network-based approach to measure network properties, e.g. betweenness and PageRank. CoIN integrates co-occurrence features and network centralities when curating articles. The proposed method combines the co-occurrence frequency with the network construction from text. The co-occurrence networks are further analyzed to obtain the linking and shortest path features of the network centralities.

The authors’ ultimately conclude that the network-based approaches perform better than collocation-based approaches.

If this post sounds hauntingly familiar, you may be thinking about Prioritizing PubMed articles for the Comparative Toxicogenomic Database utilizing semantic information, which was the first place finisher at BioCreative 2012 with a mean average precision (MAP) score of 0.8030.

November 12, 2013

Big Data – Genomics – Bio4j

Filed under: BigData,Bio4j,Bioinformatics,Genomics — Patrick Durusau @ 3:12 pm

Berkeley Phylogenomics Group receives an NSF grant to develop a graph DB for Big Data challenges in genomics building on Bio4j

From the post:

The Sjölander Lab at the University of California, Berkeley, has recently been awarded a 250K US dollars EAGER grant from the National Science Foundation to build a graph database for Big Data challenges in genomics. Naturally, they’re building on Bio4j.

The project “EAGER: Towards a self-organizing map and hyper-dimensional information network for the human genome” aims to create a graph database of genome and proteome data for the human genome and related species to allow biologists and computational biologists to mine the information in gene family trees, biological networks and other graph data that cannot be represented effectively in relational databases. For these goals, they will develop on top of the pioneering graph-based bioinformatics platform Bio4j.

We are excited to see how Bio4j is used by top research groups to build cutting-edge bioinformatics solutions” said Eduardo Pareja, Era7 Bioinformatics CEO. “To reach an even broader user base, we are pleased to announce that we now provide versions for both Neo4j and Titan graph databases, for which we have developed another layer of abstraction for the domain model using Blueprints.”

EAGER stands for Early-concept Grants for Exploratory Research”, explained Professor Kimmen Sjölander, head of the Berkeley Phylogenomics Group: “NSF awards these grants to support exploratory work in its early stages on untested, but potentially transformative, research ideas or approaches”. “My lab’s focus is on machine learning methods for Big Data challenges in biology, particularly for graphical data such as gene trees, networks, pathways and protein structures. The limitations of relational database technologies for graph data, particularly BIG graph data, restrict scientists’ ability to get any real information from that data. When we decided to switch to a graph database, we did a lot of research into the options. When we found out about Bio4j, we knew we’d found our solution. The Bio4j team has made our development tasks so much easier, and we look forward to a long and fruitful collaboration in this open-source project”.

Always nice to see great projects get ahead!

Kudos to the Berkeley Phylogenomics Group!

November 4, 2013

Integrating the Biological Universe

Filed under: Bioinformatics,Integration — Patrick Durusau @ 7:37 pm

Integrating the Biological Universe by Yasset Perez-Riverol & Roberto Vera.

From the post:

Integrating biological data is perhaps one of the most daunting tasks any bioinformatician has to face. From a cursory look, it is easy to see two major obstacles standing in the way: (i) the sheer amount of existing data, and (ii) the staggering variety of resources and data types used by the different groups working in the field (reviewed at [1]). In fact, the topic of data integration has a long-standing history in computational biology and bioinformatics. A comprehensive picture of this problem can be found in recent papers [2], but this short comment will serve to illustrate some of the hurdles of data integration and as a not-so-shameless plug for our contribution towards a solution.

“Reflecting the data-driven nature of modern biology, databases have grown considerably both in size and number during the last decade. The exact number of databases is difficult to ascertain. While not exhaustive, the 2011 Nucleic Acids Research (NAR) online database collection lists 1330 published biodatabases (1), and estimates derived from the ELIXIR database provider survey suggest an approximate annual growth rate of ∼12% (2). Globally, the numbers are likely to be significantly higher than those mentioned in the online collection, not least because many are unpublished, or not published in the NAR database issue.” [1]

Which lead me to:

JBioWH: an open-source Java framework for bioinformatics data integration:

Abstract:

The Java BioWareHouse (JBioWH) project is an open-source platform-independent programming framework that allows a user to build his/her own integrated database from the most popular data sources. JBioWH can be used for intensive querying of multiple data sources and the creation of streamlined task-specific data sets on local PCs. JBioWH is based on a MySQL relational database scheme and includes JAVA API parser functions for retrieving data from 20 public databases (e.g. NCBI, KEGG, etc.). It also includes a client desktop application for (non-programmer) users to query data. In addition, JBioWH can be tailored for use in specific circumstances, including the handling of massive queries for high-throughput analyses or CPU intensive calculations. The framework is provided with complete documentation and application examples and it can be downloaded from the Project Web site at http://code.google.com/p/jbiowh. A MySQL server is available for demonstration purposes at hydrax.icgeb.trieste.it:3307.

Database URL: http://code.google.com/p/jbiowh

Thoughts?

Comments?

October 31, 2013

Machine learning for cancer classification – part 1

Filed under: Bioinformatics,Machine Learning — Patrick Durusau @ 8:13 pm

Machine learning for cancer classification – part 1 – preparing the data sets by Obi Griffith.

From the post:

I am planning a series of tutorials illustrating basic concepts and techniques for machine learning. We will try to build a classifier of relapse in breast cancer. The analysis plan will follow the general pattern (simplified) of a recent paper I wrote. The gcrma step may require you to have as much as ~8gb of ram. I ran this tutorial on a Mac Pro (Snow Leopard) with R 3.0.2 installed. It should also work on linux or windows but package installation might differ slightly. The first step is to prepare the data sets. We will use GSE2034 as a training data set and GSE2990 as a test data set. These are both data sets making use of the Affymetrix U133A platform (GPL96). First, let’s download and pre-process the training data.

Assuming you are ready to move beyond Iris data sets for practicing machine learning, this would be a good place to start.

October 29, 2013

Useful Unix/Linux One-Liners for Bioinformatics

Filed under: Bioinformatics,Linux OS,Text Mining,Uncategorized — Patrick Durusau @ 6:36 pm

Useful Unix/Linux One-Liners for Bioinformatics by Stephen Turner.

From the post:

Much of the work that bioinformaticians do is munging and wrangling around massive amounts of text. While there are some “standardized” file formats (FASTQ, SAM, VCF, etc.) and some tools for manipulating them (fastx toolkit, samtools, vcftools, etc.), there are still times where knowing a little bit of Unix/Linux is extremely helpful, namely awk, sed, cut, grep, GNU parallel, and others.

This is by no means an exhaustive catalog, but I’ve put together a short list of examples using various Unix/Linux utilities for text manipulation, from the very basic (e.g., sum a column) to the very advanced (munge a FASTQ file and print the total number of reads, total number unique reads, percentage of unique reads, most abundant sequence, and its frequency). Most of these examples (with the exception of the SeqTK examples) use built-in utilities installed on nearly every Linux system. These examples are a combination of tactics I used everyday and examples culled from other sources listed at the top of the page.

What one liners do you have laying about?

For what data sets?

October 27, 2013

PubMed Commons

Filed under: Bioinformatics,Skepticism — Patrick Durusau @ 7:04 pm

PubMed Commons

From the webpage:

PubMed Commons is a system that enables researchers to share their opinions about scientific publications. Researchers can comment on any publication indexed by PubMed, and read the comments of others. PubMed Commons is a forum for open and constructive criticism and discussion of scientific issues. It will thrive with high quality interchange from the scientific community. PubMed Commons is currently in a closed pilot testing phase, which means that only invited participants can add and view comments in PubMed.

Just in case you are looking for a place to practice your data skepticism skills.

In closed beta now but when it opens up…, pick an article in a field that interests you or at random.

Just my suggestion but try to do very high quality comments and check with others on your analysis.

A record of to the point, non-shrill, substantive comments might be a nice addition to your data skeptic resume. (Under papers re-written/retracted.)

October 26, 2013

Little Book of R for Bioinformatics!

Filed under: Bioinformatics,R — Patrick Durusau @ 2:29 pm

Welcome to a Little Book of R for Bioinformatics! by Avril Coghlan.

From the webpage:

This is a simple introduction to bioinformatics, with a focus on genome analysis, using the R statistics software.

To encourage research into neglected tropical diseases such as leprosy, Chagas disease, trachoma, schistosomiasis etc., most of the examples in this booklet are for analysis of the genomes of the organisms that cause these diseases.

A Little Book of R For Bioinformatics, Release 01 (PDF)

Seventy-seven pages, including answers to exercises that should get you going with R in bioinformatics.

October 24, 2013

Hypergraphs and Cellular Networks

Filed under: Bioinformatics,Graphs,Hypergraphs — Patrick Durusau @ 7:00 pm

Hypergraphs and Cellular Networks by Steffen Klamt, Utz-Uwe Haus, Fabian Theis. (Klamt S, Haus U-U, Theis F (2009) Hypergraphs and Cellular Networks. PLoS Comput Biol 5(5): e1000385. doi:10.1371/journal.pcbi.1000385)

Background:

The understanding of biological networks is a fundamental issue in computational biology. When analyzing topological properties of networks, one often tends to substitute the term “network” for “graph”, or uses both terms interchangeably. From a mathematical perspective, this is often not fully correct, because many functional relationships in biological networks are more complicated than what can be represented in graphs.

In general, graphs are combinatorial models for representing relationships (edges) between certain objects (nodes). In biology, the nodes typically describe proteins, metabolites, genes, or other biological entities, whereas the edges represent functional relationships or interactions between the nodes such as “binds to”, “catalyzes”, or “is converted to”. A key property of graphs is that every edge connects two nodes. Many biological processes, however, are characterized by more than two participating partners and are thus not bilateral. A metabolic reaction such as A+B→C+D (involving four species), or a protein complex consisting of more than two proteins, are typical examples. Hence, such multilateral relationships are not compatible with graph edges. As illustrated below, transformation to a graph representation is usually possible but may imply a loss of information that can lead to wrong interpretations afterward.

Hypergraphs offer a framework that helps to overcome such conceptual limitations. As the name indicates, hypergraphs generalize graphs by allowing edges to connect more than two nodes, which may facilitate a more precise representation of biological knowledge. Surprisingly, although hypergraphs occur ubiquitously when dealing with cellular networks, their notion is known to a much lesser extent than that of graphs, and sometimes they are used without explicit mention.

This contribution does by no means question the importance and wide applicability of graph theory for modeling biological processes. A multitude of studies proves that meaningful biological properties can be extracted from graph models (for a review see [1]). Instead, this contribution aims to increase the communities’ awareness of hypergraphs as a modeling framework for network analysis in cell biology. We will give an introduction to the notion of hypergraphs, thereby highlighting their differences from graphs and discussing examples of using hypergraph theory in biological network analysis. For this Perspective, we propose using hypergraph statistics of biological networks, where graph analysis is predominantly used but where a hypergraph interpretation may produce novel results, e.g., in the context of a protein complex hypergraph.

Like graphs, hypergraphs may be classified by distinguishing between undirected and directed hypergraphs, and, accordingly, we divide the introduction to hypergraphs given below into two major parts.

When I read:

Many biological processes, however, are characterized by more than two participating partners and are thus not bilateral.

I am reminded of Steve Newcomb’s multilateral models of subject identity.

Possibly overkill for some subject identity use cases and just right for other subject identity use cases. A matter of requirements.

This is a very good introduction to hypergraphs that concludes with forty-four (44) references to literature you may find useful.

October 18, 2013

Are Graph Databases Ready for Bioinformatics?

Filed under: Bioinformatics,Graph Databases,Graphs — Patrick Durusau @ 1:29 pm

Are Graph Databases Ready for Bioinformatics? by Christian Theil Have and Lars Juhl Jensen.

From the editorial:

Graphs are ubiquitous in bioinformatics and frequently consist of too many nodes and edges to represent in RAM. These graphs are thus stored in databases to allow for efficient queries using declarative query languages such as SQL. Traditional relational databases (e.g. MySQL and PostgreSQL) have long been used for this purpose and are based on decades of research into query optimization. Recently, NoSQL databases have caught a lot of attention due to their advantages in scalability. The term NoSQL is used to refer to schemaless databases such as key/value stores (e.g. Apache Cassandra), document stores (e.g. MongoDB) and graph databases (e.g. AllegroGraph, Neo4J, OpenLink Virtuoso), which do not fit within the traditional relational paradigm. Most NoSQL databases do not have a declarative query language. The widely used Neo4J graph database is an exception. Its query language Cypher is designed for expressing graph queries, but is still evolving.

Graph databases have so far seen only limited use within bioinformatics [Schriml et al., 2013]. To illustrate the pros and cons of using a graph database (exemplified by Neo4J v1.8.1) instead of a relational database (PostgreSQL v9.1) we imported into both the human interaction network from STRING v9.05 [Franceschini et al., 2013], which is an approximately scale-free network with 20,140 proteins and 2.2 million interactions. As all graph databases, Neo4J stores edges as direct pointers between nodes, which can thus be traversed in constant time. Because Neo4j uses the property graph model, nodes and edges can have properties associated with them; we use this for storing the protein names and the confidence scores associated with the interactions. In PostgreSQL, we stored the graph as an indexed table of node pairs, which can be traversed with either logarithmic or constant lookup complexity depending on the type of index used. On these databases we benchmarked the speed of Cypher and SQL queries for solving three bioinformatics graph processing problems: finding immediate neighbors and their interactions, finding the best scoring path between two proteins, and finding the shortest path between them. We have selected these three tasks because they illustrate well the strengths and weaknesses of graph databases compared to traditional relational databases.

Encouraging but also makes the case for improvements in graph database software.

October 17, 2013

cudaMap:…

Filed under: Bioinformatics,CUDA,Genomics,GPU,NVIDIA,Topic Map Software,Topic Maps — Patrick Durusau @ 3:16 pm

cudaMap: a GPU accelerated program for gene expression connectivity mapping by Darragh G McArt, Peter Bankhead, Philip D Dunne, Manuel Salto-Tellez, Peter Hamilton, Shu-Dong Zhang.

Abstract:

BACKGROUND: Modern cancer research often involves large datasets and the use of sophisticated statistical techniques. Together these add a heavy computational load to the analysis, which is often coupled with issues surrounding data accessibility. Connectivity mapping is an advanced bioinformatic and computational technique dedicated to therapeutics discovery and drug re-purposing around differential gene expression analysis. On a normal desktop PC, it is common for the connectivity mapping task with a single gene signature to take > 2h to complete using sscMap, a popular Java application that runs on standard CPUs (Central Processing Units). Here, we describe new software, cudaMap, which has been implemented using CUDA C/C++ to harness the computational power of NVIDIA GPUs (Graphics Processing Units) to greatly reduce processing times for connectivity mapping.

RESULTS: cudaMap can identify candidate therapeutics from the same signature in just over thirty seconds when using an NVIDIA Tesla C2050 GPU. Results from the analysis of multiple gene signatures, which would previously have taken several days, can now be obtained in as little as 10 minutes, greatly facilitating candidate therapeutics discovery with high throughput. We are able to demonstrate dramatic speed differentials between GPU assisted performance and CPU executions as the computational load increases for high accuracy evaluation of statistical significance.

CONCLUSION: Emerging ‘omics’ technologies are constantly increasing the volume of data and information to be processed in all areas of biomedical research. Embracing the multicore functionality of GPUs represents a major avenue of local accelerated computing. cudaMap will make a strong contribution in the discovery of candidate therapeutics by enabling speedy execution of heavy duty connectivity mapping tasks, which are increasingly required in modern cancer research. cudaMap is open source and can be freely downloaded from http://purl.oclc.org/NET/cudaMap.

Or to put that in lay terms, the goal is to establish the connections between human diseases, genes that underlie them and drugs that treat them.

Going from several days to ten (10) minutes is quite a gain in performance.

This is processing of experimental data but is it a window into techniques for scaling topic maps?

I first saw this in a tweet by Stefano Bertolo.

« Newer PostsOlder Posts »

Powered by WordPress