Another Word For It Patrick Durusau on Topic Maps and Semantic Diversity

January 15, 2015

Open Addresses

Filed under: Government,Government Data,Mapping — Patrick Durusau @ 10:23 am

Open Addresses

From the homepage:

At Open Addresses, we are bringing together information about the places where we live, work and go about our daily lives. By gathering information provided to us by people about their own addresses, and from open sources on the web, we are creating an open address list for the UK, available to everyone.

Do you want to enter our photography competition?

Or do you want to get involved by submitting an address?

It’s as simple as entering it below.

Addresses are a vital part of the UK’s National Information Infrastructure. Open Addresses will be used by a whole range of individuals and organisations (academics, charities, public sector and private sector). By having accurate information about addresses, we’ll all benefit from getting more of the things we want, and less of the things we don’t.

Datasets as of 10 December 2014 are available for download now. Via BitTorrent so I assume the complete datasets are fairly large. Anyone downloaded them?

If you do download all or part of the records, curious what other public data sets would you combine with them?

January 14, 2015

SODA Developers

Filed under: Government Data,Open Data,Programming — Patrick Durusau @ 7:50 pm

SODA Developers

From the webpage:

The Socrata Open Data API allows you to programatically access a wealth of open data resources from governments, non-profits, and NGOs around the world.

I have mentioned Socrata and their Open Data efforts more than once on this blog but I don’t think I have ever pointed to their developer site.

Very much worth spending time here if you are interested in governmental data.

Not that I take any data, government or otherwise, at face value. Data is created and released/leaked for reasons that may or may not coincide with your assumptions or goals. Access to data is just the first step in uncovering whose interests the data represents.

Data Analysis with Python, Pandas, and Bokeh

Filed under: Python,Visualization — Patrick Durusau @ 7:32 pm

Data Analysis with Python, Pandas, and Bokeh by Chris Metcalf.

From the post:

A number of questions have come up recently about how to use the Socrata API with Python, an awesome programming language frequently used for data analysis. It also is the language of choice for a couple of libraries I’ve been meaning to check out – Pandas and Bokeh.

No, not the endangered species that has bamboo-munched its way into our hearts and the Japanese lens blur that makes portraits so beautiful, the Python Data Analysis Library and the Bokeh visualization tool. Together, they represent an powerful set of tools that make it easy to retrieve, analyze, and visualize open data.

If you have ever wondered what days have the most “party” disturbance calls to the LA police department, your years of wondering are about to end. 😉

Seriously, just in this short post Chris makes a case for learning more about Python Data Analysis Library and the Bokeh visualization tool.

Becoming skilled with either package will take time but there is a nearly endless stream of data to practice upon.

I first saw this in a tweet by Christophe Lalanne.

Cool Interactive experiments of 2014

Filed under: Graphics,Interface Research/Design,Visualization — Patrick Durusau @ 7:21 pm

Cool Interactive experiments of 2014

From the post:

As we continue to look back at 2014, in search of the most interesting, coolest and useful pieces of content that came to our attention throughout the year, it’s only natural that we find projects that, despite being much less known and spoken of by the data visualization community than the ones of “The New York Times” or “The Washington Post”, have a certain “je ne sais quoi” to it, either it’s the project’s overall aesthetics, or the type of the data visualized.

Most of all, these projects show how wide the range of what visualization can be used for, outside the pressure of a client, a deadline or a predetermined tool to use. Self-promoting pieces, despite the low general value they might have, still play a determinant role in helping information designers test and expand their skills. Experimentation is at the core of this exciting time we are living in, so we gathered a couple of dozens of visual experiments that we had the opportunity to feature in our weekly “Interactive Inspiration” round ups, published every Friday.

Very impressive! I will just list the titles for you here:

  • The Hobbit | Natalia Bilenko, Asako Miyakawa
  • Periodic Table of Storytelling | James Harris
  • Graph TV | Kevin Wu
  • Beer Viz | Divya Anand, Sonali Sharma, Evie Phan, Shreyas
  • One Human Heartbeat | Jen Lowe
  • We can do better | Ri Liu
  • F1 Scope | Michal Switala
  • F1 Timeline | Peter Cook
  • The Largest Vocabulary in Hip hop | Matt Daniels
  • History of Rock in 100 Songs | Silicon Valley Data Science
  • When sparks fly | Lam Thuy Vo
  • The Colors of Motion | Charlie Clark
  • World Food Clock | Luke Twyman
  • Score to Chart | Davide Oliveri
  • Culturegraphy | Kim Albrecht
  • The Big Picture | Giulio Fagiolini
  • Commonwealth War Dead: First World War Visualised | James Offer
  • The Pianogram | Joey Cloud
  • Faces per second in episodes of House of Cards TV Series | Virostatiq
  • History Words Flow | Santiago Ortiz
  • Global Weirding | Cicero Bengler

If they have this sort of eye candy every Friday, mark me down as a regular visitor to VisualLoop.

BTW, I could have used XSLT to scrape the titles from the HTML but since there weren’t any odd line breaks, a regex in Emacs did the same thing with far fewer keystrokes.

I sometimes wonder if “interactive visualization” focuses too much on the visualization reacting to our input? After all, we are already interacting with visual stimuli in ways I haven’t seen duplicated on the image side. In that sense, reading books is an interactive experience, just on the user side.

Manipulate PDFs with Python

Filed under: Ferguson,PDF,Python — Patrick Durusau @ 5:16 pm

Manipulate PDFs with Python by Tim Arnold.

From the overview:

PDF documents are beautiful things, but that beauty is often only skin deep. Inside, they might have any number of structures that are difficult to understand and exasperating to get at. The PDF reference specification (ISO 32000-1) provides rules, but it is programmers who follow them, and they, like all programmers, are a creative bunch.

That means that in the end, a beautiful PDF document is really meant to be read and its internals are not to be messed with. Well, we are programmers too, and we are a creative bunch, so we will see how we can get at those internals.

Still, the best advice if you have to extract or add information to a PDF is: don’t do it. Well, don’t do it if there is any way you can get access to the information further upstream. If you want to scrape that spreadsheet data in a PDF, see if you can get access to it before it became part of the PDF. Chances are, now that is is inside the PDF, it is just a bunch of lines and numbers with no connection to its former structure of cells, formats, and headings.

If you cannot get access to the information further upstream, this tutorial will show you some of the ways you can get inside the PDF using Python. (emphasis in the original)

Definitely a collect the software and experiment type post!

Is there a collection of “nasty” PDFs on the web? Thinking that would be a useful think to have for testing tools such as the ones listed in this post. Not to mention getting experience with extracting information from them. Suggestions?

I first saw this in a tweet by Christophe Lalanne.

Top 77 R posts for 2014 (+R jobs)

Filed under: Programming,R,Statistics — Patrick Durusau @ 4:48 pm

Top 77 R posts for 2014 (+R jobs) by Tal Galili.

From the post:

The site R-bloggers.com is now 5 years old. It strives to be an (unofficial) online journal of the R statistical programming environment, written by bloggers who agreed to contribute their R articles to the site, to be read by the R community.

So, how reliable is this list of the top 77?

This year, the site was visited by 2.7 million users, in 7 million sessions with 11.6 million pageviews. People have surfed the site from over 230 countries, with the greatest number of visitors coming from the United States (38%) and then followed by the United Kingdom (6.7%), Germany (5.5%), India( 5.1%), Canada (4%), France (2.9%), and other countries. 62% of the site’s visits came from returning users. R-bloggers has between 15,000 to 20,000 RSS/e-mail subscribers.

How’s that? A top whatever list based on actual numbers! Visits by public users.

I wonder if anyone has tried that on those click-bait webinars? You know the ones, where ad talk takes up more than 50% of the time and the balance is hand waving. That kind.

Enjoy the top 77 R post list! I will!

I first saw this in a tweet by Kirk Borne.

ExAC Browser (Beta) | Exome Aggregation Consortium

Filed under: Bioinformatics,Genome,Genomics — Patrick Durusau @ 4:38 pm

ExAC Browser (Beta) | Exome Aggregation Consortium

From the webpage:

The Exome Aggregation Consortium (ExAC) is a coalition of investigators seeking to aggregate and harmonize exome sequencing data from a wide variety of large-scale sequencing projects, and to make summary data available for the wider scientific community.

The data set provided on this website spans 61,486 unrelated individuals sequenced as part of various disease-specific and population genetic studies. The ExAC Principal Investigators and groups that have contributed data to the current release are listed here.

All data here are released under a Fort Lauderdale Agreement
for the benefit of the wider biomedical community – see the terms of use here.

Sign up for our mailing list for future release announcements here.

“Big data” is so much more than “likes,” “clicks,” “visits,” “views,” etc.

I first saw this in a tweet by Mark McCarthy.

Interactive Data Visualization for the Web

Filed under: D3,Graphics,Visualization — Patrick Durusau @ 4:26 pm

Interactive Data Visualization for the Web by Scott Murray.

From the webpage:

This online version of Interactive Data Visualization for the Web includes 44 examples that will show you how to best represent your interactive data. For instance, you’ll learn how to create this simple force layout with 10 nodes and 12 edges. Click and drag the nodes below to see the diagram react.

When you follow the link to the O’Reilly site, just ignore the eBook pricing and go directly to “read online.”

Much crisper than the early version I mention at: Interactive Data Visualization for the Web [D3].

I first saw this in a tweet by Kirk Borne.

Confessions of an Information Materialist

Filed under: Law,Law - Sources,Texts — Patrick Durusau @ 4:09 pm

Confessions of an Information Materialist by Aaron Kirschenfeld.

There aren’t many people in the world that can tempt me into reading UCC (Uniform Commercial Code) comments (again) but it appears that Aaron is one of them, at least this time.

Aaron was extolling on the usefulness of categories for organization and organization of information in particular and invokes “Official Comment 4a to UCC 9-102 by the ALI & NCCUSL.” (ALI = American Law Institute, NCCUSL = National Conference of Commissioners on Uniform State Laws. Seriously, that’s really their name.)

I will quote part of it so you can get the flavor of what Aaron is praising:

The classes of goods are mutually exclusive. For example, the same property cannot simultaneously be both equipment and inventory. In borderline cases — a physician’s car or a farmer’s truck that might be either consumer goods or equipment — the principal use to which the property is put is determinative. Goods can fall into different classes at different times. For example, a radio may be inventory in the hands of a dealer and consumer goods in the hands of a consumer. As under former Article 9, goods are “equipment” if they do not fall into another category.

The definition of “consumer goods” follows former Section 9-109. The classification turns on whether the debtor uses or bought the goods for use “primarily for personal, family, or household purposes.”

Goods are inventory if they are leased by a lessor or held by a person for sale or lease. The revised definition of “inventory” makes clear that the term includes goods leased by the debtor to others as well as goods held for lease. (The same result should have obtained under the former definition.) Goods to be furnished or furnished under a service contract, raw materials, and work in process also are inventory. Implicit in the definition is the criterion that the sales or leases are or will be in the ordinary course of business. For example, machinery used in manufacturing is equipment, not inventory, even though it is the policy of the debtor to sell machinery when it becomes obsolete or worn. Inventory also includes goods that are consumed in a business (e.g., fuel used in operations). In general, goods used in a business are equipment if they are fixed assets or have, as identifiable units, a relatively long period of use, but are inventory, even though not held for sale or lease, if they are used up or consumed in a short period of time in producing a product or providing a service.

Aaron’s reaction to this comment:

The UCC comment hits me two ways. First, it shows how inexorably linked law and the organization of information really are. The profession seeks to explain or justify what is what, what belongs to who, how much of it, and so on. The comment also shows how the logical process of categorizing involves deductive, inductive, and analogical reasoning. With the UCC specifically, practice came before formal classification, and seeks, much like a foreign-language textbook, to explain a living thing by reducing it to categories of words and phrases — nouns, verbs and their tenses, and adjectives (really, the meat of descriptive vocabulary), among others. What are goods and the subordinate types of goods? Comment 4a to 9-102 will tell you!

All of what Aaron says about Comment 4a to UCC 9-102 is true, if you grant the UCC the right to put the terms of discussion beyond the pale of being questioned.

Take for example:

The classes of goods are mutually exclusive. For example, the same property cannot simultaneously be both equipment and inventory.

Ontology friends would find nothing remarkable about classes of goods being mutually exclusive. Or with the example of not being both equipment and inventory at the same time.

The catch is that the UCC isn’t defining these terms in a vacuum. These definitions apply to UCC Article 9, which governs rights in secured transactions. Put simply, were a creditor has the legal right to take your car, boat, house, equipment, etc.

By defining these terms, the UCC (actually the state legislature that adopts the UCC), has put these terms, their definitions and their relationships to other statutes, beyond the pale of discussion. They are the fundamental underpinning of any discussion, including discussions of how to modify them.

It is very difficult to lose an argument if you have already defined the terms upon which the argument can be conducted.

Most notions of property and the language used to describe it are deeply embedded in both constitutions and the law, such as the UCC. The question of should “property” mean the same thing to an ordinary citizen and a quasi-immortal corporation doesn’t comes up. And under the terms of the UCC, it is unlikely to ever come up.

We need legal language for a vast number of reasons but we need to realize that the users of legal language have an agenda of their own and that their language can conceal questions that some of us would rather discuss.

Building Definitions Lists for XPath/XQuery/etc.

Filed under: Standards,XPath,XQuery,XSLT — Patrick Durusau @ 3:30 pm

I have extracted the definitions from:

These lists are unsorted and the paragraphs with multiple definitions are repeated for each definition. Helps me spot where I have multiple definitions that may be followed by non-normative prose, applicable to one or more definitions.

Usual follies trying to extract the definitions.

My first attempt (never successful in my experience but I have to try it so as to get to the second, third, etc.) resulted in:

DefinitionDefinitionDefinitionDefinitionDefinitionDefinitionDefinitionDefinitionDefinition

Which really wasn’t what I meant. Unfortunately it was what I had asked for. 😉

Just in case you are curious, the guts to extracting the definitions reads:

<xsl:for-each select=”//p/a[contains(@name, ‘dt’)]”>
<p>
<xsl:copy-of select=”ancestor::p”/>
</p>
</xsl:for-each>

Each of the definitions is contained in a p element where the anchor for the definition is contained in an a element with the attribute name, “dt-(somename).”

This didn’t work in all four (4) cases because XPath and XQuery Functions and Operators 3.1 records its “[Definition” elements as:

<p><span class=”termdef”><a name=”character” id=”character” shape=”rect”></a>[Definition] A <b>character</b> is an instance of the <a href=”http://www.w3.org/TR/REC-xml/#NT-Char” shape=”rect”>Char</a><sup><small>XML</small></sup> production of <a href=”#xml” shape=”rect”>[Extensible Markup Language (XML) 1.0 (Fifth Edition)]</a>.</span></p>

I’m sure there is some complex trickery you could use to account for that case but with four files, this is meatball XSLT, results over elegance.

Multiple definitions in one paragraph must be broken out so they can be sorted along with the other definitions.

The one thing I forgot to do in the XSLT that you should do when comparing multiple standards was to insert an identifier at the end of each paragraph for the text it was drawn from. Thus:

[Definition: Every instance of the data model is a sequence. XDM]

Where XDM is in a different color for each source.

Proofing all these definitions across four (4) specifications (XQueryX has no additions definitions, aside from unnecessarily restating RFC 2119) is no trivial matter. Which is why I have extracted them and will be producing a deduped and sorted version.

When you have long or complicated standards to proof, it helps to break them down in to smaller parts. Especially if the parts are out of their normal reading context. That helps avoid simply nodding along because you have read the material so many times.

FYI, comments on errors most welcome! Producing the lists was trivial. Proofing the headers, footers, license language, etc. took longer than the lists.

Enjoy!

January 13, 2015

While We Were Distracted….

Filed under: Finance Services,Transparency — Patrick Durusau @ 8:19 pm

I have long suspected that mainstream news, with its terrorist attacks, high profile political disputes, etc., is a dangerous distraction. Here is one more brick to shore up that opinion.

Congress attempts giant leap backward on data transparency by Pam Baker.

From the post:

The new Republican Congress was incredibly busy on its first full day at work. 241 bills were introduced on that day and more than a few were highly controversial. While polarizing bills on abortion, Obamacare and immigration got all the media headlines, one very important Congressional action dipped beneath the radar: an attempt to eliminate data transparency in financial reporting.

The provision to the “Promoting Job Creation and Reducing Small Business Burdens Act” would exempt nearly 60 percent of public companies from filing data-based reports with the Securities and Exchange Commission (SEC), according to the Data Transparency Coalition.

“This action will set the U.S. on a path backwards and put our financial regulators, public companies and investors at a significant disadvantage to global competitors. It is tremendously disappointing to see that one of the first actions of the new Congress is to put forward legislation that would harm American competitiveness and deal a major setback to data transparency in financial regulation,” said Hudson Hollister, the executive director of the Data Transparency Coalition, a trade association pursuing the publication of government information as standardized, machine-readable data.

See Pam’s post for some positive steps you can take with regard to this bill and how to remain informed about similar attempts in the future.

To be honest apparently the SEC is having all sorts of data management difficulties but given the success rate of government data projects, that’s not all that hard to believe. But the solution to such a problem isn’t to simply stop collecting information.

No doubt the SEC is locked into various custom/proprietary systems, but what if they opened up all the information about those systems for an open source project, say under the Apache Foundation, to integrate some specified data set into their systems?

It surely could not fare any worse than projects for which the government hires contractors.

Data Checking: Charlie Hebdo March

Filed under: Humor,Skepticism — Patrick Durusau @ 7:32 pm

I won’t reproduce the photographs because newspapers are picky about that sort of information but be aware that the photos of dignitaries “marching” in Paris aren’t what they appear to be.

First, Spot the difference: Female world leaders ‘Photoshopped’ out of Paris rally picture, Claire Cohen reports that a Israeli newspaper The Announcer (HaMevaser), photoshopped out all the women in the original image.

But the “march” was fakery from the outset. They were assembled on an empty street with lots of police presence. See: Paris march: TV wide shots reveal a different perspective on world leaders at largest demonstration in France’s history by Adam Withnall.

A photograph of a faked march that was further falsified by the Israeli newspaper The Announcer (HaMevaser). Closer to being accurate?

Deep Learning: Methods and Applications

Filed under: Deep Learning,Indexing,Information Retrieval,Machine Learning — Patrick Durusau @ 7:01 pm

Deep Learning: Methods and Applications by Li Deng and Dong Yu. (Li Deng and Dong Yu (2014), “Deep Learning: Methods and Applications”, Foundations and Trends® in Signal Processing: Vol. 7: No. 3–4, pp 197-387. http://dx.doi.org/10.1561/2000000039)

Abstract:

This monograph provides an overview of general deep learning methodology and its applications to a variety of signal and information processing tasks. The application areas are chosen with the following three criteria in mind: (1) expertise or knowledge of the authors; (2) the application areas that have already been transformed by the successful use of deep learning technology, such as speech recognition and computer vision; and (3) the application areas that have the potential to be impacted significantly by deep learning and that have been experiencing research growth, including natural language and text processing, information retrieval, and multimodal information processing empowered by multi-task deep learning.

Keywords:

Deep learning, Machine learning, Artificial intelligence, Neural networks, Deep neural networks, Deep stacking networks, Autoencoders, Supervised learning, Unsupervised learning, Hybrid deep networks, Object recognition, Computer vision, Natural language processing, Language models, Multi-task learning, Multi-modal processing

If you are looking for another rich review of the area of deep learning, you have found the right place. Resources, conferences, primary materials, etc. abound.

Don’t be thrown off by the pagination. This is issues 3 and 4 of the periodical Foundations and Trends® in Signal Processing. You are looking at the complete text.

Be sure to read Selected Applications in Information Retrieval (Section 9, pages 308-319). Where 9.2 starts with:

Here we discuss the “semantic hashing” approach for the application of deep autoencoders to document indexing and retrieval as published in [159, 314]. It is shown that the hidden variables in the final layer of a DBN not only are easy to infer after using an approximation based on feed-forward propagation, but they also give a better representation of each document, based on the word-count features, than the widely used latent semantic analysis and the traditional TF-IDF approach for information retrieval. Using the compact code produced by deep autoencoders, documents are mapped to memory addresses in such a way that semantically similar text documents are located at nearby addresses to facilitate rapid document retrieval. The mapping from a word-count vector to its compact code is highly efficient, requiring only a matrix multiplication and a subsequent sigmoid function evaluation for each hidden layer in the encoder part of the network.

That is only one of the applications detailed in this work. I do wonder if this will be the approach that breaks the “document” (as in this work for example) model of information retrieval? If I am searching for “deep learning” and “information retrieval,” a search result that returns these pages would be a great improvement over the entire document. (At the user’s option.)

Before the literature on deep learning gets much more out of hand, now would be a good time to start building not only a corpus of the literature but a sub-document level topic map to ideas and motifs as they develop. That would be particularly useful as patents start to appear for applications of deep learning. (Not a volunteer or charitable venture.)

I first saw this in a tweet by StatFact.

More on Definitions in XPath/XQuery/XDM 3.1

Filed under: Standards,XPath,XQuery — Patrick Durusau @ 5:29 pm

I was thinking about the definitions I extracted from XPath 3.1 Definitions Here! Definitions There! Definitions Everywhere! XPath/XQuery 3.1 and since the XPath 3.1 draft says:

Because these languages are so closely related, their grammars and language descriptions are generated from a common source to ensure consistency, and the editors of these specifications work together closely.

We are very likely to find that the material contained in definitions and the paragraphs containing definitions are in fact the same.

To make the best use of your time then, what is needed is a single set of the definitions from XPath 3.1, XQuery 3.1, XQueryX 3.1, XQuery and XPath Data Model 3.1, and XQuery Functions and Operators 3.1.

I say that, but then on inspecting some of the definitions in XQuery and XPath Data Model 3.1, I read:

[Definition: An atomic value is a value in
the value space of an atomic type and is labeled with the name of
that atomic type.]

[Definition: An atomic type is a primitive
simple type
or a type derived by restriction from another
atomic type.] (Types derived by list or union are not atomic.)

But in the file of definitions from XPath 3.1, I read:

[Definition: An atomic value is a value in the value space of an atomic type, as defined in [XML Schema 1.0] or [XML Schema 1.1].]

Not the same are they?

What happened to:

and is labeled with the name of that atomic type.

That seems rather important. Yes?

The phrase “atomic type” occurs forty-six (46) times in the XPath 3.1 draft, none of which define “atomic type.”

It does define “generalized atomic type:”

[Definition: A generalized atomic type is a type which is either (a) an atomic type or (b) a pure union type ].

Which would make you think it would have to define “atomic type” as well, to declare the intersection with “pure union type.” But it doesn’t.

In case you are curious, XML Schema 1.1 doesn’t define “atomic type” either. Rather it defines “anyAtomicType.”

In XML Schema 1.0 Part 1, the phrase “atomic type” is used once and only once in “3.14.1 (non-normative) The Simple Type Definition Schema Component,” saying:

Each atomic type is ultimately a restriction of exactly one such built-in primitive datatype, which is its {primitive type definition}.

There is no formal definition nor is there any further discussion of “atomic type” in XML Schema 1.0 Part 1.

XML Schema Part 2 is completely free of any mention of “atomic type.”

Summary of the example:

At this point we have been told that XPath 3.1 relies on XQuery and XPath Data Model 3.1 but also XML Schema 1 and XML Schema 1.1, which have inconsistent definitions of “atomic type,” when it exists at all.

Moreover, XPath 3.1 relies upon undefined term (atomic value) to define another term (generalized atomic type), which is surely an error in any reading.

This is a good illustration of what happens when definitions are not referenced from other documents with specific and resolvable references. Anyone checking such a definition would have noticed it missing in the referenced location.

Summary on next steps:

I was going to say a deduped set of definitions would serve for proofing all the drafts and now, despite the “production from a common source,” I’m not so sure.

Probably the best course is to simply extract all the definitions and check them for duplication rather than assuming it.

The questions of what should be note material and other issues will remain to be explored.

Who’s like Tatum?

Filed under: D3,Graphs,Music — Patrick Durusau @ 4:15 pm

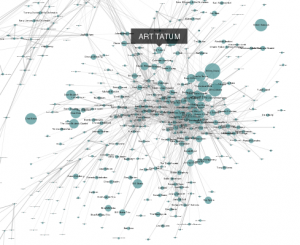
Who’s like Tatum? by Peter Cook.

art-tatum

Only a small part of the jazz musical universe that awaits you at “Who’s Like Tatum?

The description at the site reads:

Who’s like Tatum?

Art Tatum was one of the greatest jazz pianists ever. His extraordinary command of the piano was legendary and was rarely surpassed.

This is a network generated from Last.fm‘s similar artist data. Using Art Tatum as a starting point, I’ve recursively gathered similar artists.

The visualisation reveals some interesting clusters. To the bottom-right of Art Tatum is a cluster of be-bop musicians including Miles Davis, Charlie Parker and Thelonious Monk.

Meanwhile to the top-left of Tatum is a cluster of swing bands/musicians featuring the likes of Count Basie, Benny Goodman and a couple of Tatum’s contemporary pianists Fats Waller and Teddy Wilson. Not surprisingly we see Duke Ellington spanning the gap between these swing and be-bop musicians.

If we work counter-clockwise we can observe clusters of vocalists (e.g. Mel Tormé and Anita O’Day), country artists (e.g. Hank Williams and Loretta Lynn) and blues artists (e.g. Son House and T-Bone Walker).

It’s interesting to spot artists who span different genres such as Big Joe Turner who has links to both swing and blues artists. Might this help explain his early involvement in rock and roll?

Do explore the network yourself and see what insights you can unearth. (Can’t read the labels? Use your browser’s zoom controls!)

Designed and developed by Peter Cook. Data from the Last.fm API enquired with pylast. Network layout using D3.

At the site, mousing over the name of an artist in the description pops up their label in the graph.

As interesting as such graphs can be, what I always wonder about is the measure used for “similarity?” Or were multiple dimensions used to measure similarity?

I can enjoy and explore such a presentation but I can’t engage in a discussion with the author or anyone else about how similar or dissimilar any artist was or along what dimensions. It isn’t that those subjects are missing, but they are unrepresented so there is no place to record my input.

One of the advantages of topic maps being that you can choose which subjects you will represent and which ones you want. Which of course means anyone following you in the same topic map can add the subjects they want to discuss as well.

For a graph such as this one, represented as a topic map, I could add subjects to represent the base(s) for similarity and comments by others on the similarity or lack thereof of particular artists. Other subjects?

Or to put it more generally, how do you merge different graphs?

Adventures in Design

Filed under: Design,Medical Informatics,Software Engineering — Patrick Durusau @ 2:36 pm

Whether you remember the name or not, you have heard of the Therac-25, a radiation therapy machine responsible for giving massive radiation doses resulting in serious injury or death between 1985 and 1987. Classic case for software engineering.

The details are quite interesting but I wanted to point out that it doesn’t take complex or rare software failures to be dangerous.

Case in point: I received a replacement insulin pump today that had the following header:

medtronic-models

The problem?

medtronic-roll-over

Interesting. You go down from “zero” to the maximum setting.

FYI, the device in question measures insulin in 0.05 increments, so 10.0 units is quite a bit. Particularly if that isn’t what you intended to do.

Medtronic has offered a free replacement for any pump with this “roll around feature.”

I have been using Medtronic devices for years and have always found them to be extremely responsive to users so don’t take this as a negative comment on them or their products.

It is, however, a good illustration that what may be a feature to one user may well not be a feature for another. Which makes me wonder, how do you design counters? Do they wrap at maximum/minimum values?

Design issues only come up when you recognize them as design issues. Otherwise they are traps for the unwary.

January 12, 2015

Spatial Data on the Web Working Group

Filed under: GIS,Spatial Data,WWW — Patrick Durusau @ 8:31 pm

Spatial Data on the Web Working Group

From the webpage:

The mission of the Spatial Data on the Web Working Group is to clarify and formalize the relevant standards landscape. In particular:

  • to determine how spatial information can best be integrated with other data on the Web;
  • to determine how machines and people can discover that different facts in different datasets relate to the same place, especially when ‘place’ is expressed in different ways and at different levels of granularity;
  • to identify and assess existing methods and tools and then create a set of best practices for their use;

where desirable, to complete the standardization of informal technologies already in widespread use.

The Spatial Data on the Web WG is part of the Data Activity and is explicitly chartered to work in collaboration with the Open Geospatial Consortium (OGC), in particular, the Spatial Data on the Web Task Force of the Geosemantics Domain Working Group. Formally, each standards body has established its own group with its own charter and operates under the respective organization’s rules of membership, however, the ‘two groups’ will work together very closely and create a set of common outputs that are expected to be adopted as standards by both W3C and OGC and to be jointly branded.

Read the charter and join the Working Group.

Just when I think the W3C has broken free of RDF/OWL, I see one of the deliverables is “OWL Time Ontology.”

Some people never give up.

There is a bright shiny lesson about the success of deep learning. It doesn’t start with any rules. Just like people don’t start with any rules.

Logic isn’t how we get anywhere. Logic is how we justify our previous arrival.

Do you see the difference?

I first saw this in a tweet by Marin Dimitrov.

A Comparison of Two Unsupervised Table Recognition Methods from Digital Scientific Articles

Filed under: Machine Learning,PDF,Tables,Text Mining — Patrick Durusau @ 8:17 pm

A Comparison of Two Unsupervised Table Recognition Methods from Digital Scientific Articles by Stefan Klampfl, Kris Jack, Roman Kern.

Abstract:

In digital scientific articles tables are a common form of presenting information in a structured way. However, the large variability of table layouts and the lack of structural information in digital document formats pose significant challenges for information retrieval and related tasks. In this paper we present two table recognition methods based on unsupervised learning techniques and heuristics which automatically detect both the location and the structure of tables within a article stored as PDF. For both algorithms the table region detection first identifies the bounding boxes of individual tables from a set of labelled text blocks. In the second step, two different tabular structure detection methods extract a rectangular grid of table cells from the set of words contained in these table regions. We evaluate each stage of the algorithms separately and compare performance values on two data sets from different domains. We find that the table recognition performance is in line with state-of-the-art commercial systems and generalises to the non-scientific domain.

Excellent article if you have ever struggled with the endless tables in government documents.

I first saw this in a tweet by Anita de Waard.

Open-Source projects: Computer Security Group at the University of Göttingen, Germany.

Filed under: Cybersecurity,Machine Learning,Malware,Security — Patrick Durusau @ 8:03 pm

Open-Source projects: Computer Security Group at the University of Göttingen, Germany.

I mentioned Joern March 2014 but these other projects may be of interest as well:

Joern: A Robust Tool for Static Code Analysis

Joern is a platform for robust analysis of C/C++ code. It generates code property graphs, a novel graph representation of code that exposes the code’s syntax, control-flow, data-flow and type information. Code property graphs are stored in a Neo4J graph database. This allows code to be mined using search queries formulated in the graph traversal language Gremlin. (Paper1,
Paper2,Paper3)

Harry: A Tool for Measuring String Similarity

Harry is a tool for comparing strings and measuring their
similarity. The tool supports several common distance and kernel
functions for strings as well as some excotic similarity measures. The
focus lies on implicit similarity measures, that is, comparison
functions that do not give rise to an explicit vector space. Examples of such similarity measures are the Levenshtein and Jaro-Winkler distance.

Adagio: Structural Analysis and Detection of Android Malware

Adagio is a collection of Python modules for analyzing and detecting
Android malware. These modules allow to extract labeled call graphs from Android APKs or DEX files and apply an explicit feature map that captures their structural relationships. Additional modules provide classes for designing binary or multiclass classification experiments and applying machine learning for detection of malicious structure. (Paper1, Paper2)

Salad: A Content Anomaly Detector based on n-Grams

Letter Salad, or Salad for short, is an efficient and flexible
implementation of the anomaly detection method Anagram. The method
uses n-grams (substrings of length n) maintained in a Bloom filter
for efficiently detecting anomalies in large sets of string data.
Salad extends the original method by supporting n-grams of bytes as
well n-grams of words and tokens. (Paper)

Sally: A Tool for Embedding Strings in Vector Spaces

Sally is a small tool for mapping a set of strings to a set of
vectors. This mapping is referred to as embedding and allows for
applying techniques of machine learning and data mining for
analysis of string data. Sally can applied to several types of
string data, such as text documents, DNA sequences or log files,
where it can handle common formats such as directories, archives
and text files. (Paper)

Malheur: Automatic Analysis of Malware Behavior

Malheur is a tool for the automatic analysis of program behavior
recorded from malware. It has been designed to support the regular
analysis of malware and the development of detection and defense
measures. Malheur allows for identifying novel classes of malware
with similar behavior and assigning unknown malware to discovered
classes using machine learning. (Paper)

Prisma: Protocol Inspection and State Machine Analysis

Prisma is an R package for processing and analyzing huge text
corpora. In combination with the tool Sally the package provides
testing-based token selection and replicate-aware, highly tuned
non-negative matrix factorization and principal component analysis. Prisma allows for analyzing very big data sets even on desktop machines.
(Paper)

Derrick: A Simple Network Stream Recorder

Derrick is a simple tool for recording data streams of TCP and UDP
traffic. It shares similarities with other network recorders, such as
tcpflow and wireshark, where it is more advanced than the first and
clearly inferior to the latter. Derrick has been specifically designed to monitor application-layer communication. In contrast to other tools the application data is logged in a line-based ASCII format. Common UNIX tools, such as grep, sed & awk, can be directly applied.

There are days when malware is a relief from thinking about present and proposed government policies.

I first saw this in a tweet by Kirk Borne.

NASA is using machine learning to predict the characteristics of stars

Filed under: Astroinformatics,Machine Learning — Patrick Durusau @ 7:42 pm

NASA is using machine learning to predict the characteristics of stars by Nick Summers.

From the post:

stars1

With so many stars in our galaxy to discover and catalog, NASA is adopting new machine learning techniques to speed up the process. Even now, telescopes around the world are capturing countless images of the night sky, and new projects such as the Large Synoptic Survey Telescope (LSST) will only increase the amount of data available at NASA’s fingertips. To give its analysis a helping hand, the agency has been using some of its prior research and recordings to essentially “teach” computers how to spot patterns in new star data.

NASA’s Jet Propulsion Laboratory started with 9,000 stars and used their individual wavelengths to identify their size, temperature and other basic properties. The data was then cross-referenced with light curve graphs, which measure the brightness of the stars, and fed into NASA’s machines. The combination of the two, combined with some custom algorithms, means that NASA’s computers should be able to make new predictions based on light curves alone. Of course, machine learning isn’t new to NASA, but this latest approach is a little different because it can identify specific star characteristics. Once the LSST is fully operational in 2023, it could reduce the number of astronomers pulling all-nighters.

[Image Credit: Image credit: NASA/JPL-Caltech, Flickr]

Do they have a merit badge in machine learning yet? Thinking that would make a great summer camp project!

Whatever field or hobby you learn machine learning in, the skills can be reused in many others. Good investment.

Data wrangling, exploration, and analysis with R

Filed under: Data Analysis,Data Mining,R — Patrick Durusau @ 7:17 pm

Data wrangling, exploration, and analysis with R Jennifer (Jenny) Bryan.

Graduate level class that uses R for “data wrangling, exploration and analysis.” If you are self-motivated, you will be hard pressed to find better notes, additional links and resources for an R course anywhere. More difficult on your own but work through this course and you will have some serious R chops to build upon.

It just occurred to me that a requirement for news channels should have sub-titles that list data repositories for each story reported. So you could load of the data while the report in ongoing.

I first saw this in a tweet by Neil Saunders.

Charlie Hebdo Attack Inspires Digital Stasi

Filed under: Cybersecurity,Security — Patrick Durusau @ 5:40 pm

You have no doubt heard about the crimes committed at Charlie Hebdo in Paris on 7 January 2015.

The digital Stasi in many governments have been inspired by the Charlie Hebdo. Even now they are seeking to suppress your liberties and loot government treasuries.

For example, the EU thinks censoring free speech is a good idea. David Meyer reports in: EU response to free speech killings? More internet censorship

In the wake of this week’s terrorist attacks in Paris, which began with the killing of 12 people at the offices of satirical publication Charlie Hebdo, the interior ministers of 12 EU countries have called for a limited increase in internet censorship.

The interior ministers of France, Germany, Latvia, Austria, Belgium, Denmark, Spain, Italy, the Netherlands, Poland, Sweden and the U.K. said in a statement (PDF) that, while the internet must remain “in scrupulous observance of fundamental freedoms, a forum for free expression, in full respect of the law,” ISPs need to help “create the conditions of a swift reporting of material that aims to incite hatred and terror and the condition of its removing, where appropriate/possible.”

ISPs as spies? Content as recruiting terrorists?

This is the same argument made against smoking/drinking/sex in movies, pornography in general, sex/violence in video games, drugs in rock-n-roll music, Elvis moving his pelvis at all on the Ed Sullivan show, etc.

There is a catch, no one has ever established a causal link between any of those things and the activities complained of. Not one, not once.

Why do public officials keep claiming something for which there is no evidence? I can’t speak about their personal motives but as a practical matter, the argument gives them something to do, with tangible results (metrics).

Hear a song glorifying terrorism? Take it off the radio. See a poster than says something favorable to terrorism? Take it down. Anyone offer any analysis that isn’t cheering the government on? Put them on a watch list. Numbers/metrics that can be put into secret reports.

You may say none of that would have prevented the attack on Charlie Hebdo. Your right. 100% right. But government leaders don’t have to be effective, they just have to look busy. Blaming media content for terrorism is government looking busy.

If you saw Eric Holder (U.S. Attorney General) on Sunday morning interviews, he said:

It’s something that frankly keeps me up at night worrying about the lone wolf, or a group of people, very small group of people who decide to get arms on their own and do what we saw in France this week. It’s the kind of thing that our government is focused on doing all that we can in conjunction with our state and local counterparts to try to make sure it does not happen.

I’m sorry that Holder wastes time worrying about lone wolves or small groups of people. We call them criminals and gangs in the South. Don’t know what they are called elsewhere.

There isn’t any reasonable way to stop lone wolves or small groups of people from any illegal activity. If that were possible, why do we still have drive by shootings? Bank robberies? Rapes? Murders? You name the crime and you can’t prevent it. What makes you think the odds are different with crimes committed by terrorists?

The digital Stasi are always on the lookout for vulnerable public treasuries. Best represented on Sunday morning by John Miller, NYPD Deputy Commissioner. When asked about the French possibly having intelligence that they didn’t follow up on, Miller responds:

I think one of the things that’s really important to highlight are the resources that were available to French intelligence and the French police. Those resources were cut over the last several years. They had to make very difficult choices about who to focus on, who to surveil, and who they had to not surveil because they didn’t have the resources.

Governments are going to have to fund their law enforcement and their intelligence services to meet this threat. And that includes the United States.

In a nutshell, with more money we can have more surveillance, to meet this threat.

First, the more people that enroll in the security forces the more often you will see headlines about internal security breaches, like Delta Airlines being used to smuggle guns. Very few airline employees are terrorists but if you enlisted them for smuggling drugs, guns, cigarettes, the number of commercial flights out of reach would be vanishingly small.

Second, the more money wasted on security that doesn’t stop any terrorist the less money is spent on education, libraries, arts, public works, medical care/research, science and a host of other things that improve our overall quality of life.

Third, has there been any reduction in terrorism in the United States after 9/11? If so it hasn’t been reported.

With no demonstration of a reduction in terrorism, why throw good money after bad?

Will terrorist attacks continue if we don’t give into the digital Stasi? Sure, at about the same rate as if we do. The difference being that we don’t cower in bed every night because something bad may happen tomorrow.

With enough tomorrows, something bad will happen. As close to certainty as people can get. But we can choose how to react to bad things. We can mourn, bury the dead, and live high quality lives in between bad things happening.

Or, we can rant and scream for government to look busy keeping us safe. In the process we will live miserable, cramped, pitiful lives under constant surveillance. And bad things will happen anyway.

It’s life, we take casualties along the way. Deal with it.


Update: Apologies, I forgot to cite the source for the Holder and Miller quotes: Face the Nation Transcripts January 11, 2015: Holder, Miller, McCaul
Definitions Here! Definitions There! Definitions Everywhere! XPath/XQuery 3.1

Filed under: Standards,XPath,XQuery — Patrick Durusau @ 4:24 pm

Would you believe there are one hundred and forty-eight definitions embedded in XPath 3.1?

What strikes me as odd is that the same one hundred and forty-eight definitions appear in a non-normative glossary, sans what looks like the note material that follows some definitions in the normative prose.

The first issue is why have definitions in both normative and non-normative prose? Particularly when the versions in non-normative prose lack the note type material found in the main text.

Speaking of normative, did you now that normatively, document order is defined as:

Informally, document order is the order in which nodes appear in the XML serialization of a document.

So we have formal definitions that are giving us informal definitions.

That may sound like being picky but haven’t we seen definitions of “document order” before?

Grepping the current XML specifications from the W3C, I found 147 mentions of “document order” outside of the current drafts.

I really don’t think we have gotten this far with XML without a definition of “document order.”

Or “node,” “implementation defined,” “implementation dependent,” “type,” “digit,” “literal,” “map,” “item,” “axis step,” in those words or ones very close to them.

  • My first puzzle is why redefine terms that already exist in XML?
  • My second puzzle is the one I mentioned above, why repeat shorter versions of the definitions in an explicitly non-normative appendix to the text?

For a concrete example of the second puzzle:

For example:

[Definition: The built-in functions
supported by XPath 3.1 are defined in [XQuery and XPath Functions and Operators
3.1]
.] Additional functions may be provided
in the static
context
. XPath per se does not provide a way to declare named
functions, but a host language may provide such a
mechanism.

First, you are never told what section of XQuery and XPath Functions and Operators 3.1 has this definition so we are back to the 5,000 x N problem.

Second, what part of:

XPath per se does not provide a way to declare named functions, but a host language may provide such a mechanism.

Does not look like a note to you?

Does it announce some normative requirement for XPath?

Proofing is made more difficult because of the overlap of these definitions, verbatim, in XQuery 3.1. Whether it is a complete overlap or not I can’t say because I haven’t extracted all the definitions from XQuery 3.1. The XQuery draft reports one hundred and sixty-five (165) definitions, so it introduces additional definitions. Just spot checking, the overlap looks substantial. Add to that the same repetition of terms as shorter entries in the glossary.

There is the accomplice XQuery and XPath Data Model 3.1, which is alleged to be the source of many definitions but not well known enough to specify particular sections. In truth, many of the things it defines have no identifiers so precise reference (read hyperlinking to a particular entry) may not even be possible.

I make that to be at least six sets of definitions, mostly repeated because one draft won’t or can’t refer to prior XML definitions of the same terms or the lack of anchors in these drafts, prevents cross-referencing by section number for the convenience of the reader.

I can ease your burden to some extent, I have created an HTML file with all the definitions in XPath 3.1, the full definitions, for your use in proofing these drafts.

I make no warranty about the quality of the text as I am a solo shop so have no one to proof copy other than myself. If you spot errors, please give a shout.


I will see what I can do about extracting other material for your review.

What we actually need is a concordance of all these materials, sans the digrams and syntax productions. KWIC concordances don’t do so well with syntax productions. Or tables. Still, it might be worth the effort.

January 11, 2015

The ggplot2 book

Filed under: ggmap,Graphics,R — Patrick Durusau @ 8:05 pm

The ggplot2 book by Hadley Wickham

From the post:

Since ggplot2 is now stable, and the ggplot2 book is over five years old and rather out of date, I’m also happy to announce that I’m working on a second edition. I’ll be ably assisted in this endeavour by Carson Sievert, who’s so far done a great job of converting the source to Rmd and updating many of the examples to work with ggplot2 1.0.0. In the coming months we’ll be rewriting the data chapter to reflect modern best practices (e.g. tidyr and dplyr), and adding sections about new features.

We’d love your help! The source code for the book is available on github. If you’ve spotted any mistakes in the first edition that you’d like to correct, we’d really appreciate a pull request. If there’s a particular section of the book that you think needs an update (or is just plain missing), please let us know by filing an issue. Unfortunately we can’t turn the book into a free website because of my agreement with the publisher, but at least you can now get easily get to the source.

Great opportunity to show off your favorite feature of ggplot2. Might even make it into the next version of the text!

I first saw this in a tweet by Christophe Lalanne.

Rollin’ Trees, yo

Filed under: Data Structures,Trees — Patrick Durusau @ 7:56 pm

Rollin’ Trees, yo by Clark Feusier.

From the post:

I like trees. All kinds of trees — concrete and abstract. Redwoods, Oaks, search trees, decision trees, fruit trees, DOM trees, Christmas trees, and more.

They are powerful beyond common recognition. Oxygen, life, shelter, food, beauty, computational efficiency, and more are provided by trees when we interact with them in the right ways.

Don’t get offended when I say this:

you don’t like trees enough

Before I can make you feel bad about taking trees for granted, I need you to be very familiar with trees and their uses. Once you understand the tree, you will feel bad for not appreciating it enough. Then, you will start appreciating trees, as well as using them in the situations for which they are perfectly suited. Good.

Oh, I don’t mind using trees for “…situations for which they are perfectly suited.” What I object to is using trees to model texts, where outside of the artificial strictures of markup, are definitely not trees!

I suppose the simplest (and most common) case of non-tree like behavior for texts is where a sentence crosses page boundaries. If you think of the page as a container, then the markup for the start and end of a sentence “overlaps” the markers for the page boundary.

Another easy example is where a quotation starts the middle of one sentence and ends at the end of the following sentence. Any markup for the first sentence is going to “overlap” the markup for the start of the quotation.

For all that, this is a good review of trees and worth your time to read. Just don’t allow yourself to be limited to trees when thinking about texts.

I first saw this in a tweet by Anna Pawlicka.

January 10, 2015

The Hobbit Graph, or To Nodes and Back Again

Filed under: Graphs,Neo4j — Patrick Durusau @ 4:43 pm

The Hobbit Graph, or To Nodes and Back Again by Kevin Van Gundy.

From the webpage:

With the final installment of Peter Jackson’s Hobbit Trilogy only a few months away, I decided it would be fun to graph out Tolkien’s novel in Neo4j and try a few different queries to show how a graph database can tell your data’s story.

This is quite clever and would sustain the interest of anyone old enough to appreciate the Hobbit.

Perhaps motivation to read a favorite novel slowly?

Enjoy!

I first saw this in a tweet by Nikolay Stoitsev.

Use Google’s Word2Vec for movie reviews

Filed under: Deep Learning,Machine Learning,Vectors — Patrick Durusau @ 4:33 pm

Use Google’s Word2Vec for movie reviews Kaggle Tutorial.

From the webpage:

In this tutorial competition, we dig a little “deeper” into sentiment analysis. Google’s Word2Vec is a deep-learning inspired method that focuses on the meaning of words. Word2Vec attempts to understand meaning and semantic relationships among words. It works in a way that is similar to deep approaches, such as recurrent neural nets or deep neural nets, but is computationally more efficient. This tutorial focuses on Word2Vec for sentiment analysis.

Sentiment analysis is a challenging subject in machine learning. People express their emotions in language that is often obscured by sarcasm, ambiguity, and plays on words, all of which could be very misleading for both humans and computers. There’s another Kaggle competition for movie review sentiment analysis. In this tutorial we explore how Word2Vec can be applied to a similar problem.

Mark Needham mentions this Kaggle tutorial in Thoughts on Software Development Python NLTK/Neo4j:….

The description also mentions:

Since deep learning is a rapidly evolving field, large amounts of the work has not yet been published, or exists only as academic papers. Part 3 of the tutorial is more exploratory than prescriptive — we experiment with several ways of using Word2Vec rather than giving you a recipe for using the output.

To achieve these goals, we rely on an IMDB sentiment analysis data set, which has 100,000 multi-paragraph movie reviews, both positive and negative.

Movie, book, TV, etc., reviews are fairly common.

Where would you look for a sentiment analysis data set on contemporary U.S. criminal proceedings?

Thoughts on Software Development Python NLTK/Neo4j:…

Filed under: Neo4j,NLTK,Text Analytics — Patrick Durusau @ 2:46 pm

Python NLTK/Neo4j: Analysing the transcripts of How I Met Your Mother by Mark Needham.

From the post:

After reading Emil’s blog post about dark data a few weeks ago I became intrigued about trying to find some structure in free text data and I thought How I met your mother’s transcripts would be a good place to start.

I found a website which has the transcripts for all the episodes and then having manually downloaded the two pages which listed all the episodes, wrote a script to grab each of the transcripts so I could use them on my machine.

Interesting intermarriage between NLTK and Neo4j. Perhaps even more so if NLTK were used to extract information from dialogue outside of fictional worlds and Neo4j was used to model dialogue roles, etc., as well as relationships and events outside of the dialogue.

Congressional hearings (in the U.S., same type of proceedings outside the U.S.) would make an interesting target for analysis using NLTK and Neo4j.

Biblatex – Bibliographies in LATEX using BibTEX for sorting only

Filed under: TeX/LaTeX — Patrick Durusau @ 2:25 pm

Biblatex – Bibliographies in LATEX using BibTEX for sorting only

From the webpage:

Biblatex is a complete reimplementation of the bibliographic facilities provided by LATEX in conjunction with BibTEX. It redesigns the way in which LATEX interacts with BibTEX at a fairly fundamental level. With biblatex, BibTEX is only used (if it is used at all) to sort the bibliography and to generate labels. Formatting of the bibliography is entirely controlled by TEX macros (the BibTEX-based mechanism embeds some parts of formatting in the BibTEX style file. Good working knowledge in LATEX should be sufficient to design new bibliography and citation styles; nothing related to BibTEX’s language is needed.

While looking for better ways to manage the bibliography I mentioned in Deep Learning in Neural Networks: An Overview I ran across The biblatex Package
Programmable Bibliographies and Citations
by Philipp Lehman. The manual runs over two (200) hundred pages so quite naturally I had to find the package at CTAN.

Biblatex is new to me so I thought it was worth noting both the manual and the package location. Very promising in terms of printed bibliography production. And as documentation for extraction of information from bibliographies created using Biblatex.

Deep Learning in Neural Networks: An Overview

Filed under: Deep Learning,Machine Learning — Patrick Durusau @ 2:01 pm

Deep Learning in Neural Networks: An Overview by Jüergen Schmidhuber.

Abstract:

In recent years, deep artificial neural networks (including recurrent ones) have won numerous contests in pattern recognition and machine learning. This historical survey compactly summarises relevant work, much of it from the previous millennium. Shallow and deep learners are distinguished by the depth of their credit assignment paths, which are chains of possibly learnable, causal links between actions and effects. I review deep supervised learning (also recapitulating the history of backpropagation), unsupervised learning, reinforcement learning & evolutionary computation, and indirect search for short programs encoding deep and large networks.

A godsend for any graduate student working in deep learning! Not only does Jüergen cover recent literature but he also traces the ideas back into history. Fortunately for all of us interested in the history of ideas in computer science, both the LATEX source, DeepLearning8Oct2014.tex and the BIBTEX file deep.bib are available.

Be forewarned that deep.bib has 2944 entries.

This is what was termed “European” scholarship, scholarship that traces ideas across disciplines and time. As opposed to more common American scholarship in the sciences (both social and otherwise), which has a discipline focus and shorter time point of view. There are exceptions both ways but I point out this difference to urge you to take a broader and longer range view of ideas.

« Newer PostsOlder Posts »

Powered by WordPress