Another Word For It Patrick Durusau on Topic Maps and Semantic Diversity

April 23, 2014

Sabotage (Former U.S. Government Secret Manual)

Filed under: Humor,Security — Patrick Durusau @ 1:52 pm

From the CIA Simple Sabotage Field Manual (Strategic Services Field Manual No. 3)

From the manual:

(a) Organizations and Conferences

(1) Insist on doing everything through “channels.” Never permit short-cuts to be taken in order to expedite decisions.

(2) Make “speeches.” Talk as frequently as possible and at great length. Illustrate your “points” by long anecdotes and accounts of personal experiences. Never hesitate to make a few appropriate “patriotic” comments.

(3) When possible, refer all matters to committees, for “further study and consideration.” Attempt to make the committees as large as possible — never less than five.

(4) Bring up irrelevant issues as frequently as possible.

(5) Haggle over precise wordings of communications, minutes, resolutions.

(6) Refer back to matters decided upon at the last meeting and attempt to re-open the question of the advisability of that decsion.

(7) Advocate “caution.” Be “reasonable” and urge your fellow-conferees to be “reasonable” and avoid haste which might result in embarrassments or difficulties later on.

(8) Be worried about the propriety of any decision — raise the question of whether such action as is contemplated lies within the jurisdiction of the group or whether it might conflict with the policy of some higher echelon.

Judging from the markings on the PDF file, the document containing the quoted material was classified at some level, from January, 1944 until April of 2008.

Over sixty (60) years as a classified document. To conceal, in part, a description of “sabotage” that can be observed at every level of government and in the vast majority of organizations.

One potential update to the manual:

Disrupting network connectivity: Glue a small ceramic magnet to a computer next to the Ethernet connector. Best if the magnet has a computer related logo. If you have access to the inside of the computer, glue it on the inside next to the Ethernet connector.

I first saw this at The CIA guide to sabotage by Chris Blattman.

PS: Untested but you could start with the 1/8 inch cube magnets from Apex Magnets. Strictly for educational purposes of course.
Diving into Statsmodels…

Filed under: Programming,Python — Patrick Durusau @ 1:12 pm

Diving into Statsmodels with an Intro to Python & Pydata by Skipper Seabold.

From the post:

Abhijit and Marck, the organizers of Statistical Programming DC, kindly invited me to give the talk for the April meetup on statsmodels. Statsmodels is a Python module for conducting data exploration and statistical analysis, modeling, and inference. You can find many common usage examples and a full list of features in the online documentation.

For those who were unable to make it, the entire talk is available as an IPython Notebook on github. If you aren’t familiar with the notebook, it is an incredibly useful and exciting tool. The Notebook is a web-based interactive document that allows you combine text, mathematics, graphics, and code (languages other than Python such as R, Julia, Matlab, and, even, C/C++ and Fortran are supported).

The talk introduced users to what is available in statsmodels. Then we looked at a typical statsmodels workflow, highlighting high-level features such as our integration with pandas and the use of formulas via patsy. We covered a few areas in a little more detail building off some of our example datasets. And finally we discussed some of the features we have in the pipeline for our upcoming release.

I don’t know that this will help in public policy debates but it can’t hurt to have your own analysis of available data.

Of course the key to “your own analysis” is having the relevant data before meetings/discussions, etc. Request and document your request for relevant data long prior to public meetings. If you don’t get the data, be sure to get your prior request documented in the meeting record.

Learning Clojure: … [What NOT to Read]

Filed under: Clojure,Programming — Patrick Durusau @ 10:33 am

Learning Clojure: Tutorial, Books, and Resources for Beginners by Nikola Peric.

From the post:

New to Clojure and don’t know where to start? Here are some books, tutorials, blog posts, and other resources for beginners that I found useful while getting used to the language. I’ll also highlight some resources I’d recommend staying away from due to better alternatives. Brief disclaimer: I have either read at least ~75% of each of these resources – some just weren’t worth reading through to the end.

Let’s start with some books after the break!

A refreshing post on Clojure resources!

Nikola not only has positive suggestions but also says what resources he would avoid.

Reporting every book on Clojure could be useful for some purpose but for beginners, straight talk about what NOT to read is as important as what not to read.

Point anyone interested in Clojure to Nikola’s post.

April 22, 2014

Jane Goodall MOOC!

Filed under: Mapping,Maps — Patrick Durusau @ 7:20 pm

From Jane Goodall’s roots & shoots:

In Africa, the Jane Goodall Institute’s experts in conservation and science use Participatory Mapping to incorporate local, indigenous knowledge in the creation of conservation and development projects around chimpanzee habitats. At Roots & Shoots, our young people are the experts! You will use the same strategy as the Jane Goodall Institute field professionals to explore your community and identify areas to make a difference with a tool called Community Mapping.

Why Map?

How do you know where to make a difference if you don’t have a strong awareness of where you live? When you map your community you REALLY get to know about the people, animals and environment around you. Mapping is the key to discovering a real community need that leads to the most effective service campaigns. Master your mapping skills and get to know your community on a whole new level!

How to Map

There are several types of mapping tools for you to choose from. Are you tech savvy and love digital maps? Or are you the type that prefers to chart by hand? Regardless of which mapping tool you use (and you can use more than one), what matters is that you get out and take action!

Jane Goodall launched this effort on her 80th birthday.

Check out the course as well as the article that tipped me off about it.

It will be interesting to see how communities are viewed by their members and not urban planners.

Perhaps conventional maps are more imperialistic than they appear at first blush. Ordinary people have lacked to tools to put forth contending views on mapping their communities. Mapping between “conventional” and “community” maps could be contentious.

I first saw this at: Jane Goodall launches online course in digital mapping by Katie Collins.

Titan 0.4.4 / Faunus 0.4.4

Filed under: Faunus,Graphs,Titan — Patrick Durusau @ 7:04 pm

I saw a tweet earlier today from aurelius that Titan 0.44 and Faunus 0.4.4 are available.

Grab your copy at:

Faunus Downloads

Titan Downloads

Enjoy!

Debug your programs like…

Filed under: Cybersecurity,Programming,Security — Patrick Durusau @ 6:52 pm

Debug your programs like they’re closed source! by Julia Evans.

From the post:

Until very recently, if I was debugging a program, I practically always did one of these three things:

  1. open a debugger
  2. look at the source code
  3. insert some print statements

I’ve started sometimes debugging a new way. With this method, I don’t look at the source code, don’t edit the source code, and don’t use a debugger. I don’t even need to have the program’s source available to me!

Can we repeat that again? I can look at the internal behavior of closed-source programs.

How?!?! AM I A WIZARD? Nope. SYSTEM CALLS! What is a system call? Operating systems know how to open files, display things to the screen, start processes, and all kinds of things. Programs can ask their operating system to do these things, using functions called system calls.

System calls are the API for your computer, so you don’t have to know how a network card works to send a HTTP request.

Julia walks through some of her favorite system calls.

Have a better way to hone your skills as a hacker? Please comment below.

MIDI notes and enharmonic equivalence

Filed under: Clojure,Music — Patrick Durusau @ 6:19 pm

MIDI notes and enharmonic equivalence – towards unequal temperaments in Clojure by Tim Regan.

From the post:

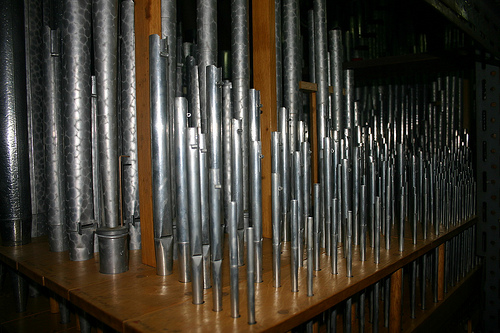
pipe organ

“Positiv Division, Manila Cathedral Pipe Organ” by Cealwyn on flickr

One current ‘when-I-get-spare-time-in-the-evening’ project is to explore how different keys sounded before the advent of equal temperament. Partly out of interest and partly because whenever I hear/read discussions of how keys got their distinctive characteristics (for example in answers to this question on the Musical Practise and Performance Stack Exchange) temperament is raised as an issue or explanation.

Having recently enjoyed Karsten Schmidt‘s Clojure workshop at Resonate 2014 Clojure and Overtone seem a good place to start. My first steps are with the easiest non-equal temperament to get my head around, the Pythagorean Temperament. My (albeit limited) understanding of temperaments has been helped enormously by the amazing chapters on the subject in David Benson’s book Music, a mathematical offering.

The pipes in the image caught my attention and reminded me of Jim Mason and his long association with pipe organs. Incredibly complex instruments, Jim was working on a topic map that mapped the relationships between a pipe organ’s many parts.

Well, that and enharmonic equivalence. 😉

Wikipedia avers (sans the hyperlinks):

In modern musical notation and tuning, an enharmonic equivalent is a note, interval, or key signature that is equivalent to some other note, interval, or key signature but “spelled”, or named differently.

Use that definition with caution as the Wikipedia articles goes on to state that the meaning of enharmonic equivalent has changed several times in history and across tuning systems.

Tim’s post will give you a start towards exploring enharmonic equivalence for yourself.

Clojure is not a substitute for a musician but you can explore music while waiting for a musician to arrive.

Innovations in peer review:…

Filed under: Bioinformatics,Biomedical,Peer Review,Publishing — Patrick Durusau @ 9:54 am

Innovations in peer review: join a discussion with our Editors by Shreeya Nanda.

From the post:

Innovation may not be an adjective often associated with peer review, indeed commentators have claimed that peer review slows innovation and creativity in science. Preconceptions aside, publishers are attempting to shake things up a little, with various innovations in peer review, and these are the focus of a panel discussion at BioMed Central’s Editors’ Conference on Wednesday 23 April in Doha, Qatar. This follows our spirited discussion at the Experimental Biology conference in Boston last year.

The discussion last year focussed on the limitations of the traditional peer review model (you can see a video here). This year we want to talk about innovations in the field and the ways in which the limitations are being addressed. Specifically, we will focus on open peer review, portable peer review – in which we help authors transfer their manuscript, often with reviewers’ reports, to a more appropriate journal – and decoupled peer review, which is undertaken by a company or organisation independent of, or on contract from, a journal.

We will be live tweeting from the session at 11.15am local time (9.15am BST), so if you want to join the discussion or put questions to our panellists, please follow #BMCEds14. If you want to brush up on any or all of the models that we’ll be discussing, have a look at some of the content from around BioMed Central’s journals, blogs and Biome below:

This post includes pointers to a number of useful resources concerning the debate around peer review.

But there are oddities as well. First, the claim that peer review “slows innovation and creativity in science,” considering recent reports that peer review is no better than random chance for grants (…lotteries to pick NIH research-grant recipients and the not infrequent reports of false papers, fraud in actual papers, and a general inability to replicate research described in papers (Reproducible Research/(Mapping?)).

A claim doesn’t have to appear on the alt.fringe.peer.review newsgroup (imaginary newsgroup) in order to be questionable on its face.

Secondly, despite the invitation to follow and participate on Twitter, holding the meeting in Qartar means potential attendees from the United States will have to rise at:

Eastern 4:15 AM (last year’s location)

Central 3:15 AM

Mountain 2:15 AM

Western 1:15 AM

I wonder what the participation levels will be from Boston last year as compared to Qatar this year?

Nothing against non-United States locations but non-junket locations, such as major educational/research hubs, should be the sites for such meetings.

April 21, 2014

Names are not (always) useful

Filed under: Bioinformatics,Biology,Taxonomy — Patrick Durusau @ 7:30 pm

PhyloCode names are not useful for phylogenetic synthesis

From the post:

Which brings me to the title of this post. In the PhyloCode, taxonomic names are not hypothetical concepts that can be refuted or refined by data-driven tests. Instead, they are definitions involving specifiers (designated specimens) that are simply applied to source trees that include those specifiers. This is problematic for synthesis because if two source trees differ in topology, and/or they fail to include the appropriate specifiers, it may be impossible to answer the basic question I began with: do the trees share any clades (taxa) in common? If taxa are functions of phylogenetic topology, then there can be no taxonomic basis for meaningfully comparing source trees that either differ in topology, or do not permit the application of taxon definitions. (emphasis added)

If you substitute “names” for “taxa” then it is easy to see my point in Plato, Shiva and A Social Graph about nodes that are “abstract concept devoid of interpretation.” There is nothing to compare.

This isn’t a new problem but a very old one that keeps being repeated.

For processing reasons it may be useful to act as though taxa (or names) are simply given. A digital or print index need not struggle to find a grounding for the terms it reports. For some purposes, that is completely unnecessary.

On the other hand, we should not forget the lack of grounding is purely a convenience for processing or other reasons. We can choose differently should an occasion merit it.

Hive 0.13 and Stinger!

Filed under: Hadoop,Hive,STINGER — Patrick Durusau @ 4:55 pm

Announcing Apache Hive 0.13 and Completion of the Stinger Initiative! by Harish Butani.

From the post:

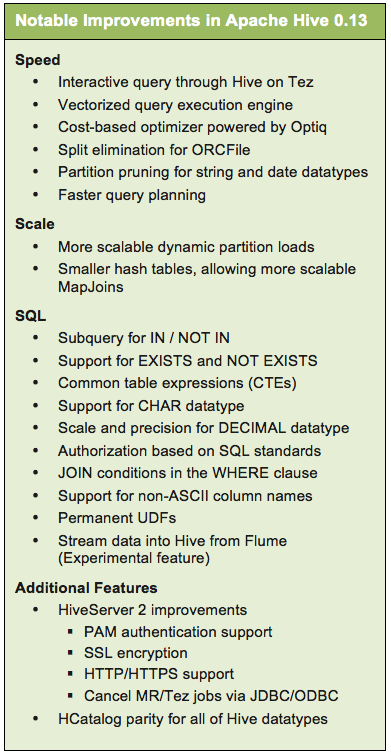
The Apache Hive community has voted on and released version 0.13 today. This is a significant release that represents a major effort from over 70 members who worked diligently to close out over 1080 JIRA tickets.

Hive 0.13 also delivers the third and final phase of the Stinger Initiative, a broad community based initiative to drive the future of Apache Hive, delivering 100x performance improvements at petabyte scale with familiar SQL semantics. These improvements extend Hive beyond its traditional roots and brings true interactive SQL query to Hadoop.

Ultimately, over 145 developers representing 44 companies, from across the Apache Hive community contributed over 390,000 lines of code to the project in just 13 months, nearly doubling the Hive code base.

The three phases of this important project spanned Hive versions 0.11, 0.12 and 0.13. Additionally, the Apache Hive team coordinated this 0.13 release with the simultaneous release of Apache Tez 0.4. Tez’s DAG execution speeds Hive queries run on Tez.

Hive 0.13

Kudos to one and all!

Open source work at its very best!

Plato, Shiva and A Social Graph

Filed under: Graphs,Gremlin,Titan — Patrick Durusau @ 4:44 pm

The Social Graph of the Los Alamos National Laboratory by Marko A. Rodriguez.

From the post:

The web is composed of numerous web sites tailored to meet the information, consumption, and social needs of its users. Within many of these sites, references are made to the same platonic “thing” though different facets of the thing are expressed. For example, in the movie industry, there is a movie called John Carter by Disney. While the movie is an abstract concept, it has numerous identities on the web (which are technically referenced by a URI).

Aurelius collaborated with the Digital Library Research and Prototyping Group of the Los Alamos National Laboratory (LANL) to develop EgoSystem atop the distributed graph database Titan. The purpose of this system is best described by the introductory paragraph of the April 2014 publication on EgoSystem.

I heavily commend Marko’s post and the Egosystem publication for your reading. That despite my cautions concerning some of the theoretical aspects of the project.

Statements like:

references are made to the same platonic “thing” though different facets of the thing are expressed.

have always troubled me. In part because it involves a claim, usually by the speaker, to have freed themselves from Plato’s cave such that they and they alone can see things aright. Which consigns the rest of us to be the pitiful lot still confined to the cave.

Which of course leads to Marko’s:

There are two categories of vertices in EgoSystem.

  1. Platonic: Denotes an abstract concept devoid of interpretation.
  2. Identity: Denotes a particular interpretation of a platonic.

Every platonic vertex is of a particular type: a person, institution, artifact, or concept. Next, every platonic has one or more identities as referenced by a URL on the web. The platonic types and the location of their web identities are itemized below. As of EgoSystem 1.0, these are the only sources from which data is aggregated, though extending it to support more services (e.g. Facebook, Quorum, etc.) is feasible given the system’s modular architecture.

A structure where English labels, remarkably enough, are places on “Platonic” vertices. Not that we would attribute any identity or semantics to a “Platonic” vertex. 😉

Rather than “Platonic” vertices, they are better described as boundary vertices. That is they circumscribe what can be represented in a particular graph, without making claims on a “higher” reality.

I say that not to be pedantic but to illustrate how a “Platonic” vertex prevents us from meaningful merger with graphs with differing “Platonic” vertices.

No doubt Shiva’s1 other residence, Arzamas-16, could benefit from a similar “alumni” graph but I rather doubt it is going to use English labels for its “Platonic” vertices which:

Denote[…] an abstract concept devoid of interpretation.

If I have no “interpretation,” which I takes to mean no properties (key/value pairs), how will I combine social graphs from Los Alamos and Arzamas-16?

I could cheat and secretly look up properties for the alleged “Platonic” nodes and combine them together but then how would you check my work? The end result would be opaque to anyone other than myself.

That isn’t a criticism of using the EgoSystem. I am sure it meets the needs of Los Alamos quite nicely.

However, it can prevent us from capturing the information necessary to expand the boundary of our graph at some future date or merging it with other graphs.

From a philosophical standpoint, we should not claim access to Platonic ideals when we are actually recording our views of shadows on the cave wall. Of which, intersections between graphs/shadows are just a subset.

1. Those of you old enough to remember Robert Oppenheimer will recognize the reference.

Parallel Graph Partitioning for Complex Networks

Filed under: Complex Networks,Graph Partitioning,Merging,Parallel Programming — Patrick Durusau @ 3:23 pm

Parallel Graph Partitioning for Complex Networks by Henning Meyerhenke, Peter Sanders, and, Christian Schulz.

Abstract:

Processing large complex networks like social networks or web graphs has recently attracted considerable interest. In order to do this in parallel, we need to partition them into pieces of about equal size. Unfortunately, previous parallel graph partitioners originally developed for more regular mesh-like networks do not work well for these networks. This paper addresses this problem by parallelizing and adapting the label propagation technique originally developed for graph clustering. By introducing size constraints, label propagation becomes applicable for both the coarsening and the refinement phase of multilevel graph partitioning. We obtain very high quality by applying a highly parallel evolutionary algorithm to the coarsened graph. The resulting system is both more scalable and achieves higher quality than state-of-the-art systems like ParMetis or PT-Scotch. For large complex networks the performance differences are very big. For example, our algorithm can partition a web graph with 3.3 billion edges in less than sixteen seconds using 512 cores of a high performance cluster while producing a high quality partition — none of the competing systems can handle this graph on our system.

Clustering in this article is defined by a node’s “neighborhood,” I am curious if defining a “neighborhood” based on multi-part (hierarchical?) identifiers might enable parallel processing of merging conditions?

While looking for resources on graph contraction, I encountered a series of lectures by Kanat Tangwongsan from: Parallel and Sequential Data Structures and Algorithms, 15-210 (Spring 2012) (link to the course schedule with numerous resources):

Lecture 17 — Graph Contraction I: Tree Contraction

Lecture 18 — Graph Contraction II: Connectivity and MSTs

Lecture 19 — Graph Contraction III: Parallel MST and MIS

Enjoy!

Norse Live Attack Map

Filed under: Cybersecurity,Mapping,Maps,Security — Patrick Durusau @ 12:43 pm

Norse Live Attack Map

From the post:

Today, we’d also like to announce the availability of a completely new and updated version of the Norse Live Attack Map. When we posted our first map back in late 2012, we did not really think much about it to be honest. Norse CTO Tommy Stiansen created it on a whim one weekend using mostly open source code, and attack maps are not necessarily a new concept. Like a lot of things, it was created out of a need for a quick and easy way for people to visualize the global and live nature of Norse’s threat intelligence platform. While the activity on the map is just a small subset (less than 1%) of the total attack traffic flowing into the Norse platform at any point in time, map visualizations can be a powerful way to communicate time-based geographic data sets.

Over the past year, the reaction by all types of people to the map has been great and we’ve received a lot of requests for enhancements and new features. Like all early stage companies, we’ve had to focus our development efforts and resources. That meant that improvements to the map were often put on the back burner. Having a new and improved map in the Norse booth at RSA 2014 provided a great incentive and target date for the team however, and we showed a preview version at the show. Aside from the completely new visual design, here is a summary of the new features.

Interesting eye candy for a Monday morning!

While the IP origins of attacks are reported, the IP targets of attacks are not.

Possible artifact of when I loaded the attack map but the United States had low numbers for being on the attack. At least until shortly after 10 A.M. East Coast time. Do you think that has anything to do with the start of the workday on the East Coast? 😉

Live Attack Map (Norse)

BTW, from under the “i” icon on the Norse map:

Norse exposes its threat intelligence via high-performance, machine-readable APIs in a variety of forms. Norse also provides products and solutions that assist organizations in protecting and mitigating cyber attacks.

That must be where the target IPs are located. Maybe they offer a “last month’s data” discount of some sort. Will inquire.

Just a random observation but South American, Africa and Australia are mostly or completely dark. No attacks, no attackers. Artifact of the collection process?

Mapping IPs, route locations, attack vectors, with physical and social infrastructures could be quite interesting.

PS: If you leave the webpage open in a tab and navigate to another page, cached updates are loaded, resulting in a wicked display.

April 20, 2014

How to find bugs in MySQL

Filed under: Bugs,Cybersecurity,MySQL,SQL — Patrick Durusau @ 4:41 pm

How to find bugs in MySQL by Roel Van de Paar.

From the post:

Finding bugs in MySQL is not only fun, it’s also something I have been doing the last four years of my life.

Whether you want to become the next Shane Bester (who is generally considered the most skilled MySQL bug hunter worldwide), or just want to prove you can outsmart some of the world’s best programmers, finding bugs in MySQL is a skill not reserved anymore to top QA engineers armed with a loads of scripts, expensive flash storage and top-range server hardware. Off course, for professionals that’s still the way to go, but now anyone with an average laptop and a standard HDD can have a lot of fun trying to find that elusive crash…

If you follow this post carefully, you may well be able to find a nice crashing bug (or two) running RQG (an excellent database QA tool). Linux would be the preferred testing OS, but if you are using Windows as your main OS, I would recommend getting Virtual Box and running a Linux guest in a suitably sized (i.e. large) VM. In terms of the acronym “RQG”, this stands for “Random Query Generator,” also named “randgen.”

If you’re not just after finding any bug out there (“bug hunting”), you can tune the RQG grammars (files that define what sort of SQL RQG executes) to more or less match your “issue area.” For example, if you are always running into a situation where the server crashes on a DELETE query (as seen at the end of the mysqld error log for example), you would want an SQL grammar that definitely has a variety of DELETE queries in it. These queries should be closely matched with the actual crashing query – crashes usually happen due to exactly the same, or similar statements with the same clauses, conditions etc.

Just in case you feel a bit old for an Easter egg hunt today, consider going on a MySQL bug hunt.

Curious, do you know of RQG-like suites for noSQL databases?

PS: RQG Documentation (github)

Annotating, Extracting, and Linking Legal Information

Filed under: Annotation,Extraction,Law,Law - Sources,Legal Informatics,Linked Data — Patrick Durusau @ 3:59 pm

Annotating, Extracting, and Linking Legal Information by Adam Wyner. (slides)

Great slides, provided you have enough background in the area to fill in the gaps.

I first saw this at: Wyner: Annotating, Extracting, and Linking Legal Information, which has collected up the links/resources mentioned in the slides.

Despite decades of electronic efforts and several centuries of manual effort before that, legal information retrieval remains an open challenge.

Google Genomics Preview

Filed under: Bioinformatics,Genomics — Patrick Durusau @ 3:40 pm

Google Genomics Preview by Kevin.

From the post:

Welcome to the Google Genomics Preview! You’ve been approved for early access to the API.

The goal of the Genomics API is to encourage interoperability and build a foundation to store, process, search, analyze and share tens of petabytes of genomic data.

We’ve loaded sample data from public BAM files:

  • The complete 1000 Genomes Project
  • Selections from the Personal Genome Project

How to get started:

You will need to obtain an invitation to being playing.

Don’t be disappointed that Google is moving into genomics.

After all, gathering data and supplying a processing back-end for it is a critical task but not a terribly imaginative one.

The analysis you perform and the uses you enable, that’s the part that takes imagination.

Data Integration: A Proven Need of Big Data

Filed under: BigData,Data Integration — Patrick Durusau @ 3:21 pm

When It Comes to Data Integration Skills, Big Data and Cloud Projects Need the Most Expertise by David Linthicum.

From the post:

Looking for a data integration expert? Join the club. As cloud computing and big data become more desirable within the Global 2000, an abundance of data integration talent is required to make both cloud and big data work properly.

The fact of the matter is that you can’t deploy a cloud-based system without some sort of data integration as part of the solution. Either from on-premise to cloud, cloud-to-cloud, or even intra-company use of private clouds, these projects need someone who knows what they are doing when it comes to data integration.

While many cloud projects were launched without a clear understanding of the role of data integration, most people understand it now. As companies become more familiar with the could, they learn that data integration is key to the solution. For this reason, it’s important for teams to have at least some data integration talent.

The same goes for big data projects. Massive amounts of data need to be loaded into massive databases. You can’t do these projects using ad-hoc technologies anymore. The team needs someone with integration knowledge, including what technologies to bring to the project.

Generally speaking, big data systems are built around data integration solutions. Similar to cloud, the use of data integration architectural expertise should be a core part of the project. I see big data projects succeed and fail, and the biggest cause of failure is the lack of data integration expertise.

Even if not exposed to the client, a topic map based integration analysis of internal and external data records should give you a competitive advantage in future bids. After all you won’t have to re-interpret the data and all its fields, just the new ones or ones that have changed.

Group Explorer 2.2

Filed under: Algebra,Group Theory,Mathematics — Patrick Durusau @ 11:01 am

Group Explorer 2.2

From the webpage:

Primary features listed here, or read the version 2.2 release notes.

  • Displays Cayley diagrams, multiplication tables, cycle graphs, and objects with symmetry
  • Many common group-theoretic computations can be done visually
  • Compare groups and subgroups via morphisms (see illustration below)
  • Browsable, searchable group library
  • Integrated help system (which you can preview on the web)
  • Save and print images at any scale and quality

Are there symmetries in your data?

I first saw this in a tweet by Steven Strogatz.

BTW, Steven also points to this example of using Group Explorer: Cayley diagrams of the first five symmetric groups.

The Next Giant List of Digitised Manuscript Hyperlinks

Filed under: British Library,Manuscripts — Patrick Durusau @ 10:50 am

The Next Giant List of Digitised Manuscript Hyperlinks by Sarah J. Biggs.

From the post:

It’s that time of year again, friends – when we inflict our quarterly massive list of manuscript hyperlinks upon an unsuspecting public. As always, this list contains everything that has been digitised up to this point by the Medieval and Earlier Manuscripts department, complete with hyperlinks to each record on our Digitised Manuscripts site. There will be another updated list here on the blog in three months; you can download the current version here: Download BL Medieval and Earlier Digitised Manuscripts Master List 10.04.13. Have fun!

The listing has reached one of my favorites: Yates Thompson MS 36, also known as: Dante Alighieri, Divina commedia. Publication date proposed to be after 1444. (Warning: Do not view with Chrome. Warns of a “redirect loop.” Displays fine with Firefox.)

Great description of the manuscript plus three hundred and ninety-nine (399) images.

But it does seem to just lay there doesn’t it?

Suggestions?

April 19, 2014

12 Things TEDx Speakers do that Preachers Don’t.

Filed under: Communication — Patrick Durusau @ 6:55 pm

12 Things TEDx Speakers do that Preachers Don’t.

From the post:

Ever seen a TEDx talk? They’re pretty great. Here’s one I happen to enjoy, and have used in a couple of sermons. I’ve wondered for a long time, “How in the world do each of these talks end up consistently blowing me away?” So I did some research, and found the TEDx talk guidelines for speakers. Some of the advice was basic – but some of it was unexpected. Much of it, I think, is a welcome wake up call to preachers who are communicating in a 21st century postmodern, post-Christian context. Obviously, some of this doesn’t fit with a preacher’s ethos: but much of it does.

That said, here are 12 things TEDx speakers do that preachers usually don’t:

A great retelling of the guidelines for TEDx speakers!

With the conference season (summer) rapidly approaching, now is the time to take this advice to heart!

Imagine a conference presentation without the filler than everyone in the room already knows (or should to be attending the conference). I keep longing for papers that don’t repeat largely the same introduction as every other paper in the area.

Yes, graphs have nodes/vertices, edges/arcs and you are g-o-i-n-g t-o l-a-b-e-l t-h-e-m. 😉

The advice for TEDx speakers is equally applicable to webcasts and podcasts.

New trends in sharing data science work

Filed under: Conferences,GraphLab,Graphs,Open Data — Patrick Durusau @ 6:42 pm

New trends in sharing data science work

Danny Bickson writes:

I got the following venturebeat article from my colleague Carlos Guestrin.

It seems there is an interesting trend of allowing data scientists to share their work: Imagine if a company’s three highly valued data scientists can happily work together without duplicating each other’s efforts and can easily call up the ingredients and results of each other’s previous work.

That day has come. As the data scientist arms race continues, data scientists might want to join forces. Crazy idea, right? Two San Francisco startups — Domino Data Lab and Sense — have emerged recently with software to let data scientists collaborate on multiple projects. In a way, it’s like code storehouse GitHub for the data science world. A Montreal startup named Plot.ly has been talking about the same themes, but it brings a more social twist. Another startup, Mode Analytics, is building software for data analysts to ask questions of data without duplicating previous efforts. And at least one more mature software vendor, Alpine Data Labs, has been adding features to help many colleagues in a company apply algorithms to code on one central hub.

If you aren’t already registered for GraphLab Conference 2014, notice that Alpine Data Labs, Domino Data Labs, Mode Analytics, Plot.ly, and, Sense will all be at the GraphLab Conference.

Go ahead, register for the GraphLab conference. At the very worst you will learn something. If you socialize a little bit, you will meet some of the brightest graph people on the planet.

Plus, when the history of “sharing” in data science is written, you will have attended one of the early conferences on sharing code for data science. After years of hoarding data (where you now see open data) and beginning to see code sharing, data science is developing a different model.

And you were there to cheer them on!

Apache Lucene/Solr 4.7.2

Filed under: Lucene,Solr — Patrick Durusau @ 6:23 pm

Apache Lucene 4.7.2

http://lucene.apache.org/core/mirrors-core-latest-redir.html

Lucene Changes.txt

Fixes potential index corruption, LUCENE-5574.

Apache Solr 4.7.2

http://lucene.apache.org/solr/mirrors-solr-latest-redir.html

Solr Changes.txt

In view of possible index corruption, I would not take this as an optional upgrade.

GraphChi Users Survey

Filed under: GraphChi,Graphs — Patrick Durusau @ 4:02 pm

GraphChi Users Survey

From the form:

This survey is used to find out about experiences of users of GraphChi. These results will be used in Aapo Kyrola’s Ph.D. thesis.

If you are using GraphChi, your experiences can help with Aapo Kyrola’s Ph.D. thesis.

Pass this along to anyone you know using GraphChi (and try GraphChi yourself).

Visual Programming Languages – Snapshots

Filed under: Graphics,Programming,Visualization — Patrick Durusau @ 2:03 pm

Visual Programming Languages – Snapshots by Eric Hosick.

If you are interested in symbolic topic map authoring or symbolic authoring for other purposes, this a a must-see site for you!

Eric has collected (as of today) one-hundred and forty (140) examples of visual programming languages.

I am sure there are some visualization techniques that were not used in these examples but offhand, I can’t say which ones. 😉

Definitely a starting point for any new visual interfaces.

Streamtools – Update

Filed under: News,Reporting,Stream Analytics,Visualization — Patrick Durusau @ 1:50 pm

streamtools 0.2.4

From the webpage:

This release contains:

  • toEmail and fromEmail blocks: use streamtools to receive and create emails!
  • linear modelling blocks: use streamtools to perform linear and logistic regression using stochastic gradient descent.
  • GUI updates : a new block reference/creation panel.
  • a kullback leibler block for comparing distributions.
  • added a tutorials section to streamtools available at /tutorials in your streamtools server.
  • many small bug fixes and tweaks.

See also: Introducing Streamtools.

+1 on news input becoming more stream-like. But streams, of water and news, can both become polluted.

Filtering water is a well-known science.

Filtering information is doable but with less certain results.

How do you filter your input? (Not necessarily automatically, algorithmic, etc. You have to define the filter first, then choose the means implement it.)

I first saw this in a tweet by Micahael Dewar.

Algorithmic Newspapers?

Filed under: Algorithms,News — Patrick Durusau @ 1:20 pm

A print newspaper generated by robots: Is this the future of media or just a sideshow? by Mathew Ingram.

From the post:

What if you could pick up a printed newspaper, but instead of a handful of stories hand-picked by a secret cabal of senior editors in a dingy newsroom somewhere, it had pieces that were selected based on what was being shared — either by your social network or by users of Facebook, Twitter etc. as a whole? Would you read it? More importantly, would you pay for it?

You can’t buy one of those yet, but The Guardian (see disclosure below) is bringing an experimental print version it has been working on to the United States for the first time: a printed paper that is generated entirely — or almost entirely — by algorithms based on social-sharing activity and other user behavior by the paper’s readers. Is this a glimpse into the future of newspapers?

According to Digiday, the Guardian‘s offering — known as #Open001 — is being rolled out later this week. But you won’t be able to pick one up at the corner store: only 5,000 copies will be printed each month, and they are going to the offices of media and ad agencies. In other words, it’s as much a marketing effort at this point for the Guardian (which isn’t printed in the U.S.) as it is a publishing experiment.

Mathew recounts the Guardian effort, similar services and questions whether robots can preserve serendipity?, alleged to be introduced by editors. It’s a good read.

The editors at the Guardian may introduce stories simply because they are “important,” but is that the case for other media outlets?

I know that is often alleged but peer review was alleged to lead to funding good projects and insuring that good papers were published. The alleged virtues of peer review, when tested, have been found to be false.

How would you test for “serendipity” in a news outlet? That is not simply running stories because they are popular in the local market but because they are “important?”

Or to put it another way: Is the news from a local media outlet already being personalized/customized?

Tools for Reproducible Research [Reproducible Mappings]

Filed under: Research Methods,Science — Patrick Durusau @ 10:49 am

Tools for Reproducible Research by Karl Broman.

From the post:

A minimal standard for data analysis and other scientific computations is that they be reproducible: that the code and data are assembled in a way so that another group can re-create all of the results (e.g., the figures in a paper). The importance of such reproducibility is now widely recognized, but it is still not so widely practiced as it should be, in large part because many computational scientists (and particularly statisticians) have not fully adopted the required tools for reproducible research.

In this course, we will discuss general principles for reproducible research but will focus primarily on the use of relevant tools (particularly make, git, and knitr), with the goal that the students leave the course ready and willing to ensure that all aspects of their computational research (software, data analyses, papers, presentations, posters) are reproducible.

As you already know, there is a great deal of interest in making scientific experiments reproducible in fact as well as in theory.

At the time time, there has been an increasing interest in reproducible data analysis as it concerns the results from reproducible experiments.

One logically follows on from the other.

Of course, reproducible data analysis as far as any combination of data from different sources, would simply cookie cutter follow the combining of data in a reported experiment.

But what if a user wants to replicate the combining (mapping) of data with other data? From different sources? That could be followed by rote by others but they would not know the underlying basis for the choices made in the mapping.

Experiments take a great deal of effort to identify the substances used in an experiment. When data is combined from different sources, why not do the same for the data?

I first saw this in a tweet by YihuI Xie.

On InChI and evaluating the quality of cross-reference links

Filed under: Cheminformatics,Identifiers,InChl,Topic Maps — Patrick Durusau @ 10:33 am

On InChI and evaluating the quality of cross-reference links by Jakub Galgonek and Jiří Vondrášek. (Journal of Cheminformatics 2014, 6:15 doi:10.1186/1758-2946-6-15)

Abstract:

Background

There are many databases of small molecules focused on different aspects of research and its applications. Some tasks may require integration of information from various databases. However, determining which entries from different databases represent the same compound is not straightforward. Integration can be based, for example, on automatically generated cross-reference links between entries. Another approach is to use the manually curated links stored directly in databases. This study employs well-established InChI identifiers to measure the consistency and completeness of the manually curated links by comparing them with the automatically generated ones.

Results

We used two different tools to generate InChI identifiers and observed some ambiguities in their outputs. In part, these ambiguities were caused by indistinctness in interpretation of the structural data used. InChI identifiers were used successfully to find duplicate entries in databases. We found that the InChI inconsistencies in the manually curated links are very high (.85% in the worst case). Even using a weaker definition of consistency, the measured values were very high in general. The completeness of the manually curated links was also very poor (only 93.8% in the best case) compared with that of the automatically generated links.

Conclusions

We observed several problems with the InChI tools and the files used as their inputs. There are large gaps in the consistency and completeness of manually curated links if they are measured using InChI identifiers. However, inconsistency can be caused both by errors in manually curated links and the inherent limitations of the InChI method.

Another use case for topic maps don’t you think?

Rather than a mapping keyed on recognition of a single identifier, have the mapping keyed to the recognition of several key/value pairs.

I don’t think there is an abstract answer as to the optimum number of key/value pairs that must match for identification. Experience would be a much better guide.

April 18, 2014

ROCK, RACK And Knowledge Retention

Filed under: Knowledge Capture,Knowledge Retention,Topic Maps — Patrick Durusau @ 4:47 pm

Roundtable on Knowledge Retention Techniques held on 21 May 2013.

From the post:

Back in May 2013, we held a Roundtable on Knowledge Retention Techniques. Carla Newman, Shaharudin Mohd Ishak and Ashad Ahmed very graciously shared with us their journey and experiences in Knowledge Retention.

Three videos, Carla Newman on ROCK (Retention of Critical Knowledge), Shaharudin Mohd Ishak on IE Singapore’s RACK (Retention of All Critical Knowledge), and Ashad Ahmend on Knowledge Retention.

Any knowledge problem of interest to Shell Oil Company is of interest to me! 😉

At what junctures in a knowledge retention process would topic maps have the greatest impact?

Not really interested in disrupting current approaches or processes but in discovering where topic maps could be a value add to existing systems.

Saving Output of nltk Text.Concordance()

Filed under: Concordance,NLTK,Text Mining — Patrick Durusau @ 4:15 pm

Saving Output of NLTK Text.Concordance() by Kok Hua.

From the post:

In NLP, sometimes users would like to search for series of phrases that contain particular keyword in a passage or web page.

NLTK provides the function concordance() to locate and print series of phrases that contain the keyword. However, the function only print the output. The user is not able to save the results for further processing unless redirect the stdout.

Below function will emulate the concordance function and return the list of phrases for further processing. It uses the NLTK concordance Index which keeps track of the keyword index in the passage/text and retrieve the surrounding words.

Text mining is a very common part of topic map construction so tools that help with that task are always welcome.

To be honest, I am citing this because it may become part of several small tools for processing standards drafts. Concordance software is not rare but a full concordance of a document seems to frighten some proof readers.

The current thinking being if only the “important” terms are highlighted in context, that some proof readers will be more likely to use the work product.

The same principal applies to the authoring of topic maps as well.

« Newer PostsOlder Posts »

Powered by WordPress