Another Word For It Patrick Durusau on Topic Maps and Semantic Diversity

February 22, 2014

Simple Ain’t Easy

Filed under: Data Analysis,Mathematics,Statistics — Patrick Durusau @ 2:27 pm

Simple Ain’t Easy: Real-World Problems with Basic Summary Statistics by John Myles White.

From the webpage:

In applied statistical work, the use of even the most basic summary statistics, like means, medians and modes, can be seriously problematic. When forced to choose a single summary statistic, many considerations come into practice.

This repo attempts to describe some of the non-obvious properties possessed by standard statistical methods so that users can make informed choices about methods.

Contributing

The reason I chose to announce a book of examples isn’t just pedagogical: by writing fully independent examples, it’s possible to write a book as a community working in parallel. If 30 people each contributed 10 examples over the next month, we’d have a full-length book containing 300 examples in our hands. In practice, things are complicated by the need to make sure that examples aren’t redundant or low quality, but it’s still possible to make this book a large-scale community project.

As such, I hope you’ll consider contributing. To contribute, just submit a new example. If your example only requires text, you only need to write a short LaTeX-flavored Markdown document. If you need images, please include R code that generates your images.

A great project for several reasons.

First, you can contribute to a public resource that may improve the use of summary statistics.

Second, you have the opportunity to search the literature for examples you want to use on summary statistics. That will improve your searching skills and data skepticism. The first from finding the examples and the second from seeing how statistics are used in the “wild.”

Not to bang on statistics too harshly, I review standards where authors have forgotten how to use quotes and footnotes. Sixth grade type stuff.

Third, and to me the most important reason, as you review the work of others, you will become more conscious of similar mistakes in your own writing.

Think of contributions to Simple Ain’t Easy as exercises in self-improvement that benefit others.
February 21, 2014

Web-Scraping: the Basics

Filed under: Humanities,Web Scrapers — Patrick Durusau @ 9:22 pm

Web-Scraping: the Basics by Rolf Fredheim.

From the post:

Slides from the first session of my course about web scraping through R: Web scraping for the humanities and social sciences

Includes an introduction to the paste function, working with URLs, functions and loops.

Putting it all together we fetch data in JSON format about Wikipedia page views from http://stats.grok.se/

Solutions here:

Download the .Rpres file to use in Rstudio here

Hard to say how soon but eventually data in machine readable formats is going to be the default and web scraping will be a historical footnote.

But it hasn’t happened yet so pass this on to newbies who need advice.

Graphical models toolkit for GraphLab

Filed under: Graphical Models,GraphLab,Graphs — Patrick Durusau @ 9:14 pm

DARPA* project contributes graphical models toolkit to GraphLab by Danny Bickson.

From the post:

We are proud to announce that following many months of hard work, Scott Richardson from Vision Systems Inc. has contributed a graphical models toolkit to GraphLab. Here is a some information about their project:

Last year Vision Systems, Inc. (VSI) partnered with Systems & Technology Research (STR) and started working on a DARPA* project to develop intelligent, automatic, and robust computer vision technologies based on realistic conditions. Our goal is to develop a software system that lets users ask queries of photo content, such as “Does this person look familiar?” or “Where is this building located?” If successful, our technology would alert people to scenes that warrant their attention.

We had an immediate need for a solid, scalable graph-parallel computation engine to replace our internal belief propagation implementation. We quickly gravitated to GraphLab. Using this framework, we designed the Factor Graph toolkit based on Joseph Gonzalez’s initial implementation. A factor graph, a type of graphical model, is a bipartite graph composed of two types of vertices: variable nodes and factor nodes. The Factor Graph toolkit is able to translate a factor graph into a graphlab distributed-graph and perform inference using a vertex-program which implements the well known message-passing algorithm belief propagation. Both belief propagation and factor graphs are general tools that have applications in a variety of domains.

We are very excited to get to work on key problems in the Machine Learning/Machine Vision field and to be a part of the powerful communities, like GraphLab, that make it possible.

I admit to not always being fond of DARPA projects but every now and again they fund something worthwhile.

If machine vision becomes robust enough, you could start a deduped porn service. 😉 I am sure other use cases will come to mind.

If you haven’t looked at GraphLab recently, you should.

Sexual Predators in Chat Rooms

Filed under: Data,GraphLab,Graphs — Patrick Durusau @ 9:01 pm

Weird dataset: identifying sexual predators in chat rooms by Danny Bickson.

From the post:

To all of the bored data scientists who are looking for interesting demo. (Alternatively, to all the startups who want to do a fraud detection demo). I stumbled upon this weird dataset which was part of PAN 2012 conference: identifying sexual predators in chat rooms.

I wouldn’t say you have to be bored to check out this dataset.

At least it is a worthy cause.

For that matter, don’t you wonder why Atlanta, GA, for example, is a sex trafficking hub in the United States? Or rather, why hasn’t law enforcement be able to stop the trafficking?

Last time I went out of the country you had to come back in one person at a time. So we have the location, control of the area, target groups for exploitation, …, what am I missing here in terms of catching traffickers?

Sex traffickers don’t wear big orange badges saying: Sex Trafficker but is that really necessary?

Maybe law enforcement should make better use of the computing cycles wasted on chasing illusory terrorists and focus on real criminals coming in and out of the country at Hartsfield-Jackson Atlanta International Airport.

Fiscal Year 2015 Budget (US) Open Government?

Filed under: Government,Government Data,Open Data,Open Government — Patrick Durusau @ 11:58 am

Fiscal Year 2015 Budget

From the description:

Each year, the Office of Management and Budget (OMB) prepares the President’s proposed Federal Government budget for the upcoming Federal fiscal year, which includes the Administration’s budget priorities and proposed funding.

For Fiscal Year (FY) 2015– which runs from October 1, 2014, through September 30, 2015– OMB has produced the FY 2015 Federal Budget in four print volumes plus an all-in-one CD-ROM:

  1. the main “Budget” document with the Budget Message of the President, information on the President’s priorities and budget overviews by agency, and summary tables;
  2. “Analytical Perspectives” that contains analyses that are designed to highlight specified subject areas;
  3. “Historical Tables” that provides data on budget receipts, outlays, surpluses or deficits, Federal debt over a time period
  4. an “Appendix” with detailed information on individual Federal agency programs and appropriation accounts that constitute the budget.
  5. A CD-ROM version of the Budget is also available which contains all the FY 2015 budget documents in PDF format along with some additional supporting material in spreadsheet format.

You will also want a “Green Book,” the 2014 version carried this description:

Each February when the President releases his proposed Federal Budget for the following year, Treasury releases the General Explanations of the Administration’s Revenue Proposals. Known as the “Green Book” (or Greenbook), the document provides a concise explanation of each of the Administration’s Fiscal Year 2014 tax proposals for raising revenue for the Government. This annual document clearly recaps each proposed change, reviewing the provisions in the Current Law, outlining the Administration’s Reasons for Change to the law, and explaining the Proposal for the new law. Ideal for anyone wanting a clear summary of the Administration’s policies and proposed tax law changes.

Did I mention that the four volumes for the budget in print with CD-ROM are $250? And last year the Green Book was $75?

For $325.00, you can have a print and pdf of the Budget plus a print copy of the Green Book.

Questions:

  1. Would machine readable versions of the Budget + Green Book make it easier to explore and compare the information within?
  2. Are PDFs and print volumes what President Obama considers to be “open government?”
  3. Who has the advantage in policy debates, the OMB and Treasury with machine readable versions of these documents or the average citizen who has the PDFs and print?
  4. Do you think OMB and Treasury didn’t get the memo? Open Data Policy-Managing Information as an Asset

Public policy debates cannot be fairly conducted without meaningful access to data on public policy issues.

Business Information Key Resources

Filed under: BI,Business Intelligence,Research Methods,Searching — Patrick Durusau @ 11:19 am

Business Information Key Resources by Karen Blakeman.

From the post:

On one of my recent workshops I was asked if I used Google as my default search tool, especially when conducting business research. The short answer is “It depends”. The long answer is that it depends on the topic and type of information I am looking for. Yes, I do use Google a lot but if I need to make sure that I have covered as many sources as possible I also use Google alternatives such as Bing, Millionshort, Blekko etc. On the other hand and depending on the type of information I require I may ignore Google and its ilk altogether and go straight to one or more of the specialist websites and databases.

Here are just a few of the free and pay-per-view resources that I use.

Starting points for research are a matter of subject, cost, personal preference, recommendations from others, etc.

What are your favorite starting points for business information?

February 20, 2014

The case for big cities, in 1 map

Filed under: Maps,Politics,Skepticism — Patrick Durusau @ 9:52 pm

The case for big cities, in 1 map by Chris Cillizza.

From the post:

New Yorkers who don’t live in New York City hate the Big Apple. Missourians outside of St. Louis and Kansas City are skeptical about the people (and politicians) who come from the two biggest cities in the state. Politicians from the Chicago area (and inner suburbs) often meet skepticism when campaigning in downstate Illinois. You get the idea. People who don’t live in the big cities tend to resent those who do.

Fair enough. Growing up in semi-rural southeastern Connecticut, I always hated Hartford. (Not really.) But, this map built by Reddit user Alexandr Trubetskoy shows — in stark terms — how much of the country’s economic activity (as measured by the gross domestic product) is focused in a remarkably small number of major cities.

A great map, at least if you live in the greater metro area of any of these cities.

I could 21 red spots, although on the East coast they are so close together some were fused together.

It is also an illustration that a map doesn’t always tell the full story.

Say 21 or more cities produce have of the GDP.

Care to guess how many states are responsible for 50% of the agricultural production in the United States?

Answer.

Selfie City:…

Filed under: Mapping,Visualization — Patrick Durusau @ 9:30 pm

Selfie City: a Visualization-Centric Analysis of Online Self-Portraits by Andrew Vande Moere.

From the post:

Selfie City [selfiecity.net], developed by Lev Manovich, Moritz Stefaner, Mehrdad Yazdani, Dominikus Baur and Alise Tifentale, investigates the socio-popular phenomenon of self-portraits (or selfies) by using a mix of theoretic, artistic and quantitative methods.

The project is based on a wide, sophisticated analysis of tens of thousands of selfies originating from 5 different world cities (New York, Sao Paulo, Berlin, Bangkok, Moscow), with statistical data derived from both automatic image analysis and crowd-sourced human judgements (i.e. Amazon Mechanical Turk). Its analysis process and its main findings are presented through various interactive data visualizations, such as via image plots, bar graphs, an interactive dashboard and other data graphics.

Andrew’s description is great but you need to visit the site to get the full impact.

Are there patterns in the images we take or posts?

Mapping Twitter Topic Networks:…

Filed under: Networks,Politics,Skepticism,Tweets — Patrick Durusau @ 9:13 pm

Mapping Twitter Topic Networks: From Polarized Crowds to Community Clusters by Marc A. Smith, Lee Rainie, Ben Shneiderman and Itai Himelboim.

From the post:

Conversations on Twitter create networks with identifiable contours as people reply to and mention one another in their tweets. These conversational structures differ, depending on the subject and the people driving the conversation. Six structures are regularly observed: divided, unified, fragmented, clustered, and inward and outward hub and spoke structures. These are created as individuals choose whom to reply to or mention in their Twitter messages and the structures tell a story about the nature of the conversation.

If a topic is political, it is common to see two separate, polarized crowds take shape. They form two distinct discussion groups that mostly do not interact with each other. Frequently these are recognizably liberal or conservative groups. The participants within each separate group commonly mention very different collections of website URLs and use distinct hashtags and words. The split is clearly evident in many highly controversial discussions: people in clusters that we identified as liberal used URLs for mainstream news websites, while groups we identified as conservative used links to conservative news websites and commentary sources. At the center of each group are discussion leaders, the prominent people who are widely replied to or mentioned in the discussion. In polarized discussions, each group links to a different set of influential people or organizations that can be found at the center of each conversation cluster.

While these polarized crowds are common in political conversations on Twitter, it is important to remember that the people who take the time to post and talk about political issues on Twitter are a special group. Unlike many other Twitter members, they pay attention to issues, politicians, and political news, so their conversations are not representative of the views of the full Twitterverse. Moreover, Twitter users are only 18% of internet users and 14% of the overall adult population. Their demographic profile is not reflective of the full population. Additionally, other work by the Pew Research Center has shown that tweeters’ reactions to events are often at odds with overall public opinion— sometimes being more liberal, but not always. Finally, forthcoming survey findings from Pew Research will explore the relatively modest size of the social networking population who exchange political content in their network.

Great study on political networks but all the more interesting for introducing an element of sanity into discussions about Twitter.

At a minimum, Twitter having 18% of all Internet users and 14% of the overall adult population casts serious doubt on metrics using Twitter to rate software popularity. (“It’s all we have” is a pretty lame excuse for using bad metrics.)

Not to say it isn’t important to mine Twitter data for what content it holds but at the same time to remember Twitter isn’t the world.

I first saw this at Mapping Twitter Topic Networks: From Polarized Crowds to Community Clusters by FullTextReports.

Free FORMOSAT-2 Satellite Imagery

Filed under: Data,Image Processing — Patrick Durusau @ 2:22 pm

Free FORMOSAT-2 Satellite Imagery

Proposals due by March 31, 2014.

From the post:

ISPRS WG VI/5 is delighted to announce the call for proposals for free FORMOSAT-2 satellite data. Sponsored by the National Space Organization, National Applied Research Laboratories (NARLabs-NSPO) and jointly supported by the Chinese Taipei Society of Photogrammetry and Remote Sensing and the Center for Space and Remote Sensing Research (CSRSR), National Central University (NCU) of Taiwan, this research announcement provides an opportunity for researchers to carry out advanced researches and applications in their fields of interest using archived and/or newly acquired FORMOSAT-2 satellite images.

FORMOSAT-2 has a unique daily-revisiting capability to acquire images at a nominal ground resolution of 2 meters (panchromatic) or 8 meters (multispectral). The images are suitable for different researches and applications, such as land-cover and environmental monitoring, agriculture and natural resources studies, oceanography and coastal zone researches, disaster investigation and mitigation support, and others. Basic characteristics of FORMOSAT-2 are listed in Section III of this document and detailed information about FORMOSAT-2 is available at
<http://www.nspo.org.tw>.

Interested individuals are invited to submit a proposal according to the guidelines listed below. All topics and fields of application are welcome, especially proposals aiming for addressing issues related to the Societal Beneficial Areas of GEO/GEOSS (Group on Earth Observations/Global Earth Observation System of Systems, Figure 1). Up to 10 proposals will be selected by a reviewing committee. Each selected proposal will be granted 10 archived images (subject to availability) and/or data acquisition requests (DAR) free of charge. Proposals that include members of ISPRS Student Consortium or other ISPRS affiliated personnels as principal investigator (PI) or coinvestigators (CI) will be given higher priorities, so be sure to indicate ISPRS affiliations in the cover sheet of the proposal.

Let’s see, 2 meters, that’s smaller than the average Meth lab. Yes? I have read of trees dying from long term meth labs, those should be more than 2 meters. Other environmental clues to the production of Methamphetamine?

Has your locality thought about data crunching to supplement its traditional law enforcement efforts?

A better investment than small towns buying tanks.

I first saw this in a tweet by TH Schee.

February 19, 2014

Diagrams 1.0

Filed under: Graphics,Haskell — Patrick Durusau @ 9:16 pm

Diagrams 1.0 by Brent Yorgey.

From the post:

The diagrams team is very pleased to announce the 1.0 release of diagrams, a framework and embedded domain-specific language for declarative drawing in Haskell. Check out the gallery for some examples of what it can do. Diagrams can be used for a wide range of purposes, from data visualization to illustration to art, and diagrams code can be seamlessly embedded in blog posts, LaTeX documents, and Haddock documentation, making it easy to incorporate diagrams into your documents with minimal extra work.

….

Since we were talking about graphics, this seems to fit in well.

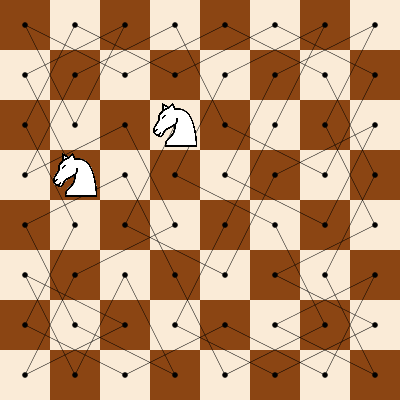
OK, one image and then you have to see Brent’s post for the rest:

knight's tour

Brent lists videos, slides, tutorials and guides.

Visualization Course Diary

Filed under: Graphics,Visualization — Patrick Durusau @ 9:06 pm

Enrico Bertini is keeping a course diary for his Information Visualization course at NYU. As he describes it:

Starting from this week and during the rest of the semester I will be writing a new series called “Course Diary” where I report about my experience while teaching Information Visualization to my students at NYU. Teaching to them is a lot of fun. They often challenge me with questions and comments which force me to think more deeply about visualization. Here I’ll report about some of my experiences and reflections on the course.

Start at the beginning: Course Diary #1: Basic Charts

If you teach or aspire to teach (well) this will be a lot of fun for you!

Why Not AND, OR, And NOT?

Filed under: Boolean Operators,Lucene,Searching,Solr — Patrick Durusau @ 3:20 pm

Why Not AND, OR, And NOT?

From the post:

The following is written with Solr users in mind, but the principles apply to Lucene users as well.

I really dislike the so called “Boolean Operators” (“AND”, “OR”, and “NOT”) and generally discourage people from using them. It’s understandable that novice users may tend to think about the queries they want to run in those terms, but as you become more familiar with IR concepts in general, and what Solr specifically is capable of, I think it’s a good idea to try to “set aside childish things” and start thinking (and encouraging your users to think) in terms of the superior “Prefix Operators” (“+”, “-”).

Background: Boolean Logic Makes For Terrible Scores

Boolean Algebra is (as my father would put it) “pretty neat stuff” and the world as we know it most certainly wouldn’t exist with out it. But when it comes to building a search engine, boolean logic tends to not be very helpful. Depending on how you look at it, boolean logic is all about truth values and/or set intersections. In either case, there is no concept of “relevancy” — either something is true or it’s false; either it is in a set, or it is not in the set.

When a user is looking for “all documents that contain the word ‘Alligator’” they aren’t going to very be happy if a search system applied simple boolean logic to just identify the unordered set of all matching documents. Instead algorithms like TF/IDF are used to try and identify the ordered list of matching documents, such that the “best” matches come first. Likewise, if a user is looking for “all documents that contain the words ‘Alligator’ or ‘Crocodile’”, a simple boolean logic union of the sets of documents from the individual queries would not generate results as good as a query that took into the TF/IDF scores of the documents for the individual queries, as well as considering which documents matches both queries. (The user is probably more interested in a document that discusses the similarities and differences between Alligators to Crocodiles then in documents that only mention one or the other a great many times).

This brings us to the crux of why I think it’s a bad idea to use the “Boolean Operators” in query strings: because it’s not how the underlying query structures actually work, and it’s not as expressive as the alternative for describing what you want.

As if you needed more proof that knowing “how” a search system is constructed is as important as knowing the surface syntax.

A great post that gives examples to illustrate each of the issues.

In case you are wondering about the December 28, 2011 date on the post, BooleanCause.Occur Lucene 4.6.1.

Troubleshooting Elasticsearch searches, for Beginners

Filed under: ElasticSearch,Search Engines,Searching — Patrick Durusau @ 2:46 pm

Troubleshooting Elasticsearch searches, for Beginners by Alex Brasetvik.

From the post:

Elasticsearch’s recent popularity is in large part due to its ease of use. It’s fairly simple to get going quickly with Elasticsearch, which can be deceptive. Here at Found we’ve noticed some common pitfalls new Elasticsearch users encounter. Consider this article a piece of necessary reading for the new Elasticsearch user; if you don’t know these basic techniques take the time to familiarize yourself with them now, you’ll save yourself a lot of distress.

Specifically, this article will focus on text transformation, more properly known as text analysis, which is where we see a lot of people get tripped up. Having used other databases, the fact that all data is transformed before getting indexed can take some getting used to. Additionally, “schema free” means different things for different systems, a fact that is often confused with Elasticsearch’s “Schema Flexible” design.

When Alex say “beginners” he means beginning developers so this isn’t a post you can send to users with search troubles.

Sorry!

But if you are trying to debug search results in ElasticSearch as a developer, this is a good place to start.

Analyzing PubMed Entries with Python and NLTK

Filed under: NLTK,PubMed,Python — Patrick Durusau @ 2:35 pm

Analyzing PubMed Entries with Python and NLTK by Themos Kalafatis.

From the post:

I decided to take my first steps of learning Python with the following task : Retrieve all entries from PubMed and then analyze those entries using Python and the Text Mining library NLTK.

We assume that we are interested in learning more about a condition called Sudden Hearing Loss. Sudden Hearing Loss is considered a medical emergency and has several causes although usually it is idiopathic (a disease or condition the cause of which is not known or that arises spontaneously according to Wikipedia).

At the moment of writing, the PubMed Query for sudden hearing loss returns 2919 entries :

A great illustration of using NLTK but of the iterative nature of successful querying.

Some queries, quite simple ones, can and do succeed on the first attempt.

Themos demonstrates how to use NLTK to explore a data set where the first response isn’t all that helpful.

This is a starting idea for weekly exercises with NLTK. Exercises which emphasize different aspects of NLTK.

SEMANTiCS Conference

Filed under: Conferences,Semantics — Patrick Durusau @ 2:13 pm

SEMANTiCS Conference Liepzig, Germany.

Important Dates:

Papers Submissions: May 30, 2014

Notification: June 27, 2014

Camera-Ready: July 14, 2014

Conference 4th – 5th September 2014

From the webpage:

The annual SEMANTiCS conference (formerly known as I-Semantics) is the meeting place for professionals who make semantic computing work, and understand its benefits and know its limitations. Every year, SEMANTiCS attracts information managers, IT-architects, software engineers, and researchers, from organisations ranging from NPOs, public administrations to the largest companies in the world.

I don’t know this conference but its being held in Liepzig would tip the balance for me.

Spark Graduates Apache Incubator

Filed under: Graphs,GraphX,Hadoop,Spark — Patrick Durusau @ 12:07 pm

Spark Graduates Apache Incubator by Tiffany Trader.

From the post:

As we’ve touched on before, Hadoop was designed as a batch-oriented system, and its real-time capabilities are still emerging. Those eagerly awaiting this next evolution will be pleased to hear about the graduation of Apache Spark from the Apache Incubator. On Sunday, the Apache Spark Project committee unanimously voted to promote the fast data-processing tool out of the Apache Incubator.

Databricks refers to Apache Spark as “a powerful open source processing engine for Hadoop data built around speed, ease of use, and sophisticated analytics.” The computing framework supports Java, Scala, and Python and comes with a set of more than 80 high-level operators baked-in.

Spark runs on top of existing Hadoop clusters and is being pitched as a “more general and powerful alternative to Hadoop’s MapReduce.” Spark promises performance gains up to 100 times faster than Hadoop MapReduce for in-memory datasets, and 10 times faster when running on disk.

BTW, the most recent release, 0.90, includes GraphX.

Spark homepage.

Offensive Computer Security

Filed under: Cybersecurity,Security — Patrick Durusau @ 11:56 am

Offensive Computer Security by Xiuwen Liu and W. Owen Redwood.

Description:

The primary incentive for an attacker to exploit a vulnerability, or series of vulnerabilities is to achieve a return on an investment (his/her time usually). This return need not be strictly monetary—an attacker may be interested in obtaining access to data, identities, or some other commodity that is valuable to them. The field of penetration testing involves authorized auditing and exploitation of systems to assess actual system security in order to protect against attackers. This requires thorough knowledge of vulnerabilities and how to exploit them. Thus, this course provides an introductory but comprehensive coverage of the fundamental methodologies, skills, legal issues, and tools used in white hat penetration testing, secure system administration, and incident response.

Videos, lecture notes, etc.

If you have a choice between computer security and security for the 21st century Maginot Line (airports), pick the former over the latter.

You can get paid for both but with computer security, you may also make a difference.

Rootkit for an Automobile Near You

Filed under: Cybersecurity,Security — Patrick Durusau @ 11:30 am

How dangerous is a rootkit for automobiles that enables the new root to:

  • honk the horn
  • brake at high speeds
  • kill power steering
  • spoof the GPS
  • alter speedometer/odometer displays

while using a GSM cellular rado?

Lisa Vaas reports in Hackers to demo a $20 iPhone-sized gadget that zombifies cars that:

At Black Hat Asia next month, two Spanish security researchers are going to show a palm-sized device that costs less than $20 to build from off-the-shelf, untraceable parts and that, depending on the car model, can screw with windows, headlights and even the truly scary, make-you-crash bits: i.e., steering and brakes.

The upcoming demo, colorfully titled “DUDE, WTF IN MY CAN!“, is being given by Javier Vazquez-Vidal and Alberto Garcia Illera.

In case you are already looking for your travel site, Black Hat Asia Registration has the details.

Lisa also points to the response of the National Highway Traffic Safety Administration (NHTSA) to reports of the vulnerability of automobiles to hacking:

While increased use of electronic controls and connectivity is enhancing transportation safety and efficiency, it brings a new challenge of safeguarding against potential vulnerabilities. NHTSA recognises these new challenges but is not aware of any consumer incidents where any vehicle control system has been hacked.

On the day before 9/11 NHTSA could have equally said:

While increased use of air travel is enhancing transportation safety and efficiency, it brings a new challenge of safeguarding against potential vulnerabilities. NHTSA recognises these new challenges but is not aware of any incidents where any plane has been flown into a commercial building. (Fictional – Did not happen.)

After the Black Hat conference, watch for the United States Congress to do something remarkably ineffectual, like prohibiting the possession of automobile rootkits.

Making an automobile rootkit illegal is going to deter someone committed to mass murder? You bet.

Enforcing existing liability statutes on manufacturers who design and market products with known security flaws, that could result in safer generations of cars, at least in the future.

The large mass of existing vehicles will remain vulnerable to such attacks so now would be a good time to start collecting information on the nuances and crannies of such attacks. For liability purposes if nothing else.

Check out Lisa’s post and then see Can bus (controller area network) at Wikipedia as starting points.

February 18, 2014

Periodic Table of Storytelling

Filed under: Narrative,Storyboarding — Patrick Durusau @ 4:35 pm

Periodic Table of Storytelling by James Harris.

A periodic table that reads in part, from left to right:

Structure: Setting, Laws, plots: Story modifiers: Plot Devices:…

Some of the elements are amusing:

  • Sealed Evil in a Can
  • Moral Event Horizon
  • Amoral Attorney (redundant?)

There are many more where those came from!

ElasticSearch Analyzers – Parts 1 and 2

Filed under: ElasticSearch,Search Engines,Searching — Patrick Durusau @ 4:16 pm

Andrew Cholakian has written a two part introduction to analyzers in ElasticSearch.

All About Analyzers, Part One

From the introduction:

Choosing the right analyzer for an Elasticsearch query can be as much art as science. Analyzers are the special algorithms that determine how a string field in a document is transformed into terms in an inverted index. If you need a refresher on the basics of inverted indexes and where analysis fits into Elasticsearch in general please see this chapter in Exploring Elasticsearch covering analyzers. In this article we’ll survey various analyzers, each of which showcases a very different approach to parsing text.

Ten tokenizers, thirty-one token filters, and three character filters ship with the Elasticsearch distribution; a truly overwhelming number of options. This number can be increased further still through plugins, making the choices even harder to wrap one’s head around. Combinations of these tokenizers, token filters, and character filters create what’s called an analyzer. There are eight standard analyzers defined, but really, they are simply convenient shortcuts for arranging tokenizers, token filters, and character filters yourself. While reaching an understanding of this multitude of options may sound difficult, becoming reasonably competent in the use of analyzers is merely a matter of time and practice. Once the basic mechanisms behind analysis are understood, these tools are relatively easy to reason about and compose.

All About Analyzers, Part Two (continues part 1).

Very much worth your time if you need a refresher or analyzers for ElasticSearch and/or are approaching them for the first time.

Of course I went hunting for the treatment of synonyms, only to find the standard fare.

Not bad by any means but a grade school student knows synonyms depend upon any number of factors but you would be hard pressed to find that in any search engine.

I suppose you could define synonyms as most engines do and then filter the results to eliminate from a gene search “hits” from Field and Stream, Guns & Ammo, and the like. Although your searchers may be interested in how to trick out an AR-15. 😉

It may be that simple bulk steps are faster than more sophisticated searching. Will have to give that some thought.

Functional Programming Day! – Book Sale!

Filed under: Books,Functional Programming — Patrick Durusau @ 3:58 pm

Functional Programming Day! at Manning – Until 12 PM EST – February 18, 2014.

How was I supposed to know Manning was going to use my birthday for “Functional Programming Day?”

I didn’t read my email after lunch and now I see the email blast.

Enter: dotd021814cc in the Promo box when you check out.

Applies to:

  • Java 8 in Action: Lambdas, Streams, and functional-style programming
  • Elixir in Action
  • Erlang and OTP in Action
  • Functional Programming in Scala
  • Scala in Action
  • Scala in Depth
  • Akka in Action
  • F# Deep Dives
  • Real-World Functional Programming
  • Clojure in Action, Second Edition
  • Joy of Clojure, Second Edition

I will ask Manning to coordinate with me next year if they want to use my birthday for functional programming day. Not that I mind but a little advance notice would be courteous. 😉

Enjoy and retweet this!

Legendary Lands:…

Filed under: Mapping,Maps,Metaphors,Symbol — Patrick Durusau @ 3:38 pm

Legendary Lands: Umberto Eco on the Greatest Maps of Imaginary Places and Why They Appeal to Us by Maria Popova.

From the review:

“Often the object of a desire, when desire is transformed into hope, becomes more real than reality itself.”

Celebrated Italian novelist, philosopher, essayist, literary critic, and list-lover Umberto Eco has had a long fascination with the symbolic and the metaphorical, extending all the way back to his vintage semiotic children’s books. Half a century later, he revisits the mesmerism of the metaphorical and the symbolic in The Book of Legendary Lands (public library) — an illustrated voyage into history’s greatest imaginary places, with all their fanciful inhabitants and odd customs, on scales as large as the mythic continent Atlantis and as small as the fictional location of Sherlock Holmes’s apartment. A dynamic tour guide for the human imagination, Eco sets out to illuminate the central mystery of why such utopias and dystopias appeal to us so powerfully and enduringly, what they reveal about our relationship with reality, and how they bespeak the quintessential human yearning to make sense of the world and find our place in it — after all, maps have always been one of our greatest sensemaking mechanisms for life, which we’ve applied to everything from the cosmos to time to emotional memory.

Eco writes in the introduction:

Legendary lands and places are of various kinds and have only one characteristic in common: whether they depend on ancient legends whose origins are lost in the mists of time or whether they are an effect of a modern invention, they have created flows of belief.

The reality of these illusions is the subject of this book.

Definitely going to the top of my wish list!

I suspect that like Gladwell‘s Tipping Point, Blink, Flop (forthcoming?), it is one thing to see a successful utopia in retrospect but quite another to intentionally create one.

Tolkien did with the Hobbit but for all of its power, it has never, to my knowledge, influenced a United States Congress appropriations bill.

Perhaps it is more accurate to say that successful utopias are possible but it is difficult to calculate their success and/or impact.

In any event, I am looking forward to spending serious time with The Book of Legendary Lands.

PS: For the library students among us, the subject classifications given by WorldCat:

  • Geographical myths in literature.
  • Geographical myths in art — Pictorial works.
  • Geographical myths.
  • Art and literature.
  • Geographical myths in art.

I haven’t gotten a copy of the book, yet, but that looks really impoverished to me. If I am looking for materials on reality, belief, social consensus, social fabric, legends, etc. I am going to miss this book in your library?

Suggestions?

Kernel From Scratch

Filed under: Linux OS,Programming — Patrick Durusau @ 2:07 pm

Kernel From Scratch by David A. Dalrymple.

From the post:

One of my three major goals for Hacker School was to create a bootable, 64-bit kernel image from scratch, using only nasm and my text editor. Well, folks, one down, two to go.

The NASM/x64 assembly code is listed below, with copious comments for your pleasure. It comprises 136 lines including comments; 75 lines with comments removed. You may wish to refer to the IntelÂŽ 64 Software Developers’ Manual (16.5MB PDF), especially if you’re interested in doing something similar yourself.

Just in case you are looking for something more challenging that dialogue mapping. 😉

Just like natural languages, computer languages can represent subjects that are not explicitly identified. Probably don’t want subject identity overhead that close to the metal but for debugging purposes it might be worth investigating.

I first saw this in a tweet by Julia Evans.

Research Opportunities and …

Filed under: Digital Research,Humanities — Patrick Durusau @ 1:57 pm

Research Opportunities and Themes in Digital Scholarship by Professor Andrew Prescott.

Unlike death-by-powerpoint-slides, only four or five of these slides have much text at all.

Which makes them more difficult to interpret, absent the presentation. (So there is a downside to low-text slides.)

But the slides reference such a wide range and depth of humanities projects that you are likely to find them very useful.

Either as pointers to present projects or as inspiration for variations or entirely new projects.

Enjoy!

A Tool for Wicked Problems:…

Filed under: Mapping,Uncategorized,Wicked Problems — Patrick Durusau @ 1:42 pm

A Tool for Wicked Problems: Dialogue Mapping™ FAQs

From the webpage:

What is Dialogue Mapping™?

Dialogue Mapping™ is a radically inclusive facilitation process that creates a diagram or ‘map’ that captures and connects participants’ comments as a meeting conversation unfolds. It is especially effective with highly complex or “Wicked” problems that are wrought with both social and technical complexity, as well as a sometimes maddening inability to move forward in a meaningful and cost effective way.

Dialogue Mapping™ creates forward progress in situations that have been stuck; it clears the way for robust decisions that last. It is effective because it works with the non-linear way humans really think, communicate, and make decisions.

I don’t disagree that humans really think in a non-linear way but some of that non-linear thinking is driven by self-interest, competition, and other motives that you are unlikely to capture with dialogue mapping.

Still, to keep you from hunting for software, the CompendiumInstitute was at the Open University until early 2013.

CompediumNG has taken over maintenance of the project.

All three sites have videos and other materials that you may find of interest.

If you want to go beyond dialogue mapping per se, consider augmenting a dialogue map, post-dialogue with additional information. Just as you would add information to any other subject identification.

Or in real time if you really want a challenge.

A live dialogue map of one of the candidate “debates” could be very amusing.

I put “debates” in quotes because no moderator ever penalizes the participants for failing to answer questions. The faithful hear what they want to hear and strain at the mote in the opposition’s eye.

I first saw this in a tweet by Neil Saunders.

James Iry’s history of programming languages

Filed under: Humor,Programming — Patrick Durusau @ 1:13 pm

James Iry’s history of programming languages (illustrated with pictures and large fonts)

To quote Alex Popescu‘s tweet: “This is truly a masterpiece:”

Enough said. Enjoy!

Data Analysis: The Hard Parts

Filed under: Data Analysis,Data Mining — Patrick Durusau @ 11:51 am

Data Analysis: The Hard Parts by Milo Braun.

Milo has cautions about data tools that promise quick and easy data analysis:

  1. data analysis is so easy to get wrong
  2. it’s too easy to lie to yourself about it working
  3. it’s very hard to tell whether it could work if it doesn’t
  4. there is no free lunch

You will find yourself nodding along as you read Milo’s analysis.

I particularly liked:

So in essence, there is no way around properly learning data analysis skills. Just like you wouldn’t just give a blowtorch to anyone, you need proper training so that you know what you’re doing and produce robust and reliable results which deliver in the real-world. Unfortunately, this training is hard, as it requires familiarity with at least linear algebra and concepts of statistics and probability theory, stuff which classical coders are not that well trained in.

I agree on the blowtorch question but then I am not in corporate management.

The corporate management answer is yes, just about anyone can have a data blowtorch. “Who is more likely to provide a desired answer?,” is the management question for blowtorch assignments.

I recommend Milo’s post and the resources he points to in order for you to become a competent data scientist.

Competence may give you an advantage in a blowtorch war.

I first saw this in a tweet by Peter Skomoroch.

Better Search = Better Results

Filed under: Bing,Programming,Searching — Patrick Durusau @ 11:29 am

Bing Code Search Makes Developers More Productive by Rob Knies.

The problem:

Software developers routinely rely on the Internet to find and reuse code samples that pertain to their current projects. Sites such as the Microsoft Developer Network (MSDN) and StackOverflow provide a rich collection of code samples to address many of the needs programmers face.

The process for doing so, though, is not particularly streamlined. The developer has to exit the programming environment, switch to a browser, enter a search query, sift through the search results for useful code snippets, copy and paste a promising snippet back into the programming environment, and adapt the pasted snippet to the programming context at hand.

It works, but it’s not optimal.

The Solution:


The result of all this collaboration is a free add-in, which became available for download on Feb. 17, that makes it easier for .NET developers to search for and reuse code samples from across the coding community. The news about Bing Code Search also appears on the Bing and Visual Studio blogs.

The Payoff:

A recent study indicated that Bing Code Search provides to programmers a time improvement of more than 60 percent, compared with the browser-search-copy-and-paste scenario. (emphasis added)

Whether you use category theory with your spreadsheets or not, a 60 percent time improvement on code searching for your developers is impressive!

Your next goal should be 60 percent re-use of the code they find. 😉

PS: This is the type of metric semantic integration software needs to demonstrate. Take some concrete or even routine task that is familiar, time consuming and/or hard to get good search results. Save time and/or produce markedly better results.

Writing about Math…

Filed under: Communication,Mathematics,Writing — Patrick Durusau @ 11:02 am

Writing about Math for the Perplexed and the Traumatized by Steven Strogatz.

From the introduction:

In the summer of 2009 I received an unexpected email from David Shipley, the editor of the op-ed page for the New York Times. He invited me to look him up next time I was in the city and said there was something he’d like to discuss.

Over lunch at the Oyster Bar restaurant in Grand Central Station, he asked whether I’d ever have time to write a series about the elements of math aimed at people like him. He said he’d majored in English in college and hadn’t studied math since high school. At some point he’d lost his way and given up. Although he could usually do what his math teachers had asked of him, he’d never really seen the point of it. Later in life he’d been puzzled to hear math described as beautiful. Could I convey some of that beauty to his readers, many of whom, he suspected, were as lost he was?

I was thrilled by his proposition. I love math, but even more than that, I love trying to explain it. Here I’d like to touch on a few of the writing challenges that this opportunity entailed, along with the goals I set for myself, and then describe how, by borrowing from three great science writers, I tried to meet those challenges. I’m not sure if any of my suggestions will help other mathematicians who’d like to share their own love of math with the public, but that’s my hope.

If you are looking for tips and examples of how to explain computer science topics, you have arrived!

Not only is this essay by Strogatz highly useful and entertaining, you can also consult his fifteen (15) part series on math that appeared in the New York Times.

The New York Times series ended in 2010 but you can following Steven at: @stevenstrogatz and at RadioLab.

I first saw this in a tweet by Michael Nielsen.

BTW, if you have contacts at the New York Times, would you mention that including hyperlinks for Twitter handles and websites is a matter of common courtesy? Thanks!

« Newer PostsOlder Posts »

Powered by WordPress