Another Word For It Patrick Durusau on Topic Maps and Semantic Diversity

February 25, 2014

Apache Hadoop 2.3.0 Released!

Filed under: Hadoop,Hortonworks,MapReduce — Patrick Durusau @ 2:21 pm

Apache Hadoop 2.3.0 Released! by Arun Murthy.

From the post:

It gives me great pleasure to announce that the Apache Hadoop community has voted to release Apache Hadoop 2.3.0!

hadoop-2.3.0 is the first release for the year 2014, and brings a number of enhancements to the core platform, in particular to HDFS.

With this release, there are two significant enhancements to HDFS:

  • Support for Heterogeneous Storage Hierarchy in HDFS (HDFS-2832)
  • In-memory Cache for data resident in HDFS via Datanodes (HDFS-4949)

With support for heterogeneous storage classes in HDFS, we now can take advantage of different storage types on the same Hadoop clusters. Hence, we can now make better cost/benefit tradeoffs with different storage media such as commodity disks, enterprise-grade disks, SSDs, Memory etc. More details on this major enhancement are available here.

Along similar lines, it is now possible to use memory available in the Hadoop cluster to centrally cache and administer data-sets in-memory in the Datanode’s address space. Applications such as MapReduce, Hive, Pig etc. can now request for memory to be cached (for the curios, we use a combination of mmap, mlock to achieve this) and then read it directly off the Datanode’s address space for extremely efficient scans by avoiding disk altogether. As an example, Hive is taking advantage of this feature by implementing an extremely efficient zero-copy read path for ORC files – see HIVE-6347 for details.

See Arun’s post for more details.

I guess there really is a downside to open source development.

It’s so much faster than commercial product development cycles. 😉 (Hard to keep up.)

R Markdown:… [Open Analysis, successor to Open Data?]

Filed under: Government,Government Data,Open Data,Open Government — Patrick Durusau @ 11:53 am

R Markdown: Integrating A Reproducible Analysis Tool into Introductory Statistics by Ben Baumer, et.al.

Abstract:

Nolan and Temple Lang argue that “the ability to express statistical computations is an essential skill.” A key related capacity is the ability to conduct and present data analysis in a way that another person can understand and replicate. The copy-and-paste workflow that is an artifact of antiquated user-interface design makes reproducibility of statistical analysis more difficult, especially as data become increasingly complex and statistical methods become increasingly sophisticated. R Markdown is a new technology that makes creating fully-reproducible statistical analysis simple and painless. It provides a solution suitable not only for cutting edge research, but also for use in an introductory statistics course. We present evidence that R Markdown can be used effectively in introductory statistics courses, and discuss its role in the rapidly-changing world of statistical computation. (emphasis in original)

The author’s third point for R Markdown I would have made the first:

Third, the separation of computing from presentation is not necessarily honest… More subtly and less perniciously, the copy-and-paste paradigm enables, and in many cases even encourages, selective reporting. That is, the tabular output from R is admittedly not of presentation quality. Thus the student may be tempted or even encouraged to prettify tabular output before submitting. But while one is fi ddling with margins and headers, it is all too tempting to remove rows or columns that do not suit the student’s purpose. Since the commands used to generate the table are not present, the reader is none the wiser.

Although I have to admit that reproducibility has a lot going for it.

Can you imagine reproducible analysis from the OMB? Complete with machine readable data sets? Or for any other agency reports. Or for that matter, for all publications by registered lobbyists. That could be real interesting.

Open Analysis (OA) as a natural successor to Open Data.

That works for me.

You?

PS: More resources:

Create Dynamic R Statistical Reports Using R Markdown

R Markdown

Using R Markdown with RStudio

Writing papers using R Markdown

If journals started requiring R Markdown as a condition for publication, some aspects of research would become more transparent.

Some will say that authors will resistl

Assume Science or Nature has accepted your article on the condition of your use of R Markdown.

Honestly, are you really going to say no?

I first saw this in a tweet by Scott Chamberlain.

February 24, 2014

[Browsing] the .Net Reference Source

Filed under: .Net,Microsoft — Patrick Durusau @ 5:08 pm

How to browse the .NET Reference Source by Immo Landwerth.

About 2.5 minutes introduction to browing the .Net Reference source.

When you see the user experience, I think you are going to be way under-impressed.

Much better than what they had but whether it is up to par for today?, is a different question.

Imbuing source code with semantics and enabling browsing/searching on the basis those semantics would produce much more attractive results.

Preview the beta release at: http://referencesource-beta.microsoft.com/

How would you improve the source code!

Even minor comments have the potential to impact 90+% of the operating system in existence.

Enjoy!

Findability and Exploration:…

Findability and Exploration: the future of search by Stijn Debrouwere.

From the introduction:

The majority of people visiting a news website don’t care about the front page. They might have reached your site from Google while searching for a very specific topic. They might just be wandering around. Or they’re visiting your site because they’re interested in one specific event that you cover. This is big. It changes the way we should think about news websites.

We need ambient findability. We need smart ways of guiding people towards the content they’d like to see — with categorization and search playing complementary goals. And we need smart ways to keep readers on our site, especially if they’re just following a link from Google or Facebook, by prickling their sense of exploration.

Pete Bell recently opined that search is the enemy of information architecture. That’s too bad, because we’re really going to need great search if we’re to beat Wikipedia at its own game: providing readers with timely information about topics they care about.

First, we need to understand a bit more about search. What is search?

A classic (2010) statement of the requirements for a “killer” app. I didn’t say “search” app because search might not be a major aspect of its success. At least if you measure success in terms of user satisfaction after using an app.

A satisfaction that comes from obtaining the content they want to see. How they got there isn’t important to them.

GenomeBrowse

Filed under: Bioinformatics,Genomics,Interface Research/Design,Visualization — Patrick Durusau @ 4:36 pm

GenomeBrowse

From the webpage:

Golden Helix GenomeBrowse® visualization tool is an evolutionary leap in genome browser technology that combines an attractive and informative visual experience with a robust, performance-driven backend. The marriage of these two equally important components results in a product that makes other browsers look like 1980s DOS programs.

Visualization Experience Like Never Before

GenomeBrowse makes the process of exploring DNA-seq and RNA-seq pile-up and coverage data intuitive and powerful. Whether viewing one file or many, an integrated approach is taken to exploring your data in the context of rich annotation tracks.

This experience features:

  • Zooming and navigation controls that are natural as they mimic panning and scrolling actions you are familiar with.
  • Coverage and pile-up views with different modes to highlight mismatches and look for strand bias.
  • Deep, stable stacking algorithms to look at all reads in a pile-up zoom, not just the first 10 or 20.
  • Context-sensitive information by clicking on any feature. See allele frequencies in control databases, functional predictions of a non-synonymous variants, exon positions of genes, or even details of a single sequenced read.
  • A dynamic labeling system which gives optimal detail on annotation features without cluttering the view.
  • The ability to automatically index and compute coverage data on BAM or VCF files in the background.

I’m very interested in seeing how the interface fares in the bioinformatics domain. Every domain is different but there may be some cross-over in term of popular UI features.

I first saw this in a tweet by Neil Saunders.

Index and Search Multilingual Documents in Hadoop

Filed under: Hadoop,Lucene,Solr — Patrick Durusau @ 4:27 pm

Index and Search Multilingual Documents in Hadoop by Justin Kestelyn.

From the post:

Basis Technology’s Rosette Base Linguistics for Java (RBL-JE) provides a comprehensive multilingual text analytics platform for improving search precision and recall. RBL provides tokenization, lemmatization, POS tagging, and de-compounding for Asian, European, Nordic, and Middle Eastern languages, and has just been certified for use with Cloudera Search.

Cloudera Search brings full-text, interactive search, and scalable indexing to Apache Hadoop by marrying SolrCloud with HDFS and Apache HBase, and other projects in CDH. Because it’s integrated with CDH, Cloudera Search brings the same fault tolerance, scale, visibility, and flexibility of your other Hadoop workloads to search, and allows for a number of indexing, access control, and manageability options.

In this post, you’ll learn how to use Cloudera Search and RBL-JE to index and search documents. Since Cloudera takes care of the plumbing for distributed search and indexing, the only work needed to incorporate Basis Technology’s linguistics is loading the software and configuring your Solr collections.

You may have guessed by the way the introduction is worded that Rosette Base Linguistics isn’t free. I checked at the website but found no pricing information. Not to mention that the coverage looks spotty:

  • Arabic
  • Chinese (simplified)
  • Chinese (traditional)
  • English
  • Japanese
  • Korean
  • If your multilingual needs fall in one or more of those languages, this may work for you.

    On the other hand, for indexing and searching multilingual text, you should compare Solr, which has factories for the following languages:

    • Arabic
    • Brazilian Portuguese
    • Bulgarian
    • Catalan
    • Chinese
    • Simplified Chinese
    • CJK
    • Czech
    • Danish
    • Dutch
    • Finnish
    • French
    • Galician
    • German
    • Greek
    • Hebrew, Lao, Myanmar, Khmer
    • Hindi
    • Indonesian
    • Italian
    • Irish
    • Kuromoji (Japanese)
    • Latvian
    • Norwegian
    • Persian
    • Polish
    • Portuguese
    • Romanian
    • Russian
    • Spanish
    • Swedish
    • Thai
    • Turkish

    Source: Solr Wiki.

Word Tree [Standard Editor’s Delight]

Filed under: Data Mining,Text Analytics,Visualization — Patrick Durusau @ 3:45 pm

Word Tree by Jason Davies.

From the webpage:

The Word Tree visualisation technique was invented by the incredible duo Martin Wattenberg and Fernanda Viégas in 2007. Read their paper for the full details.

Be sure to also check out various text analysis projects by Santiago Ortiz

Created by Jason Davies. Thanks to Mike Bostock for comments and suggestions. .

This is excellent!

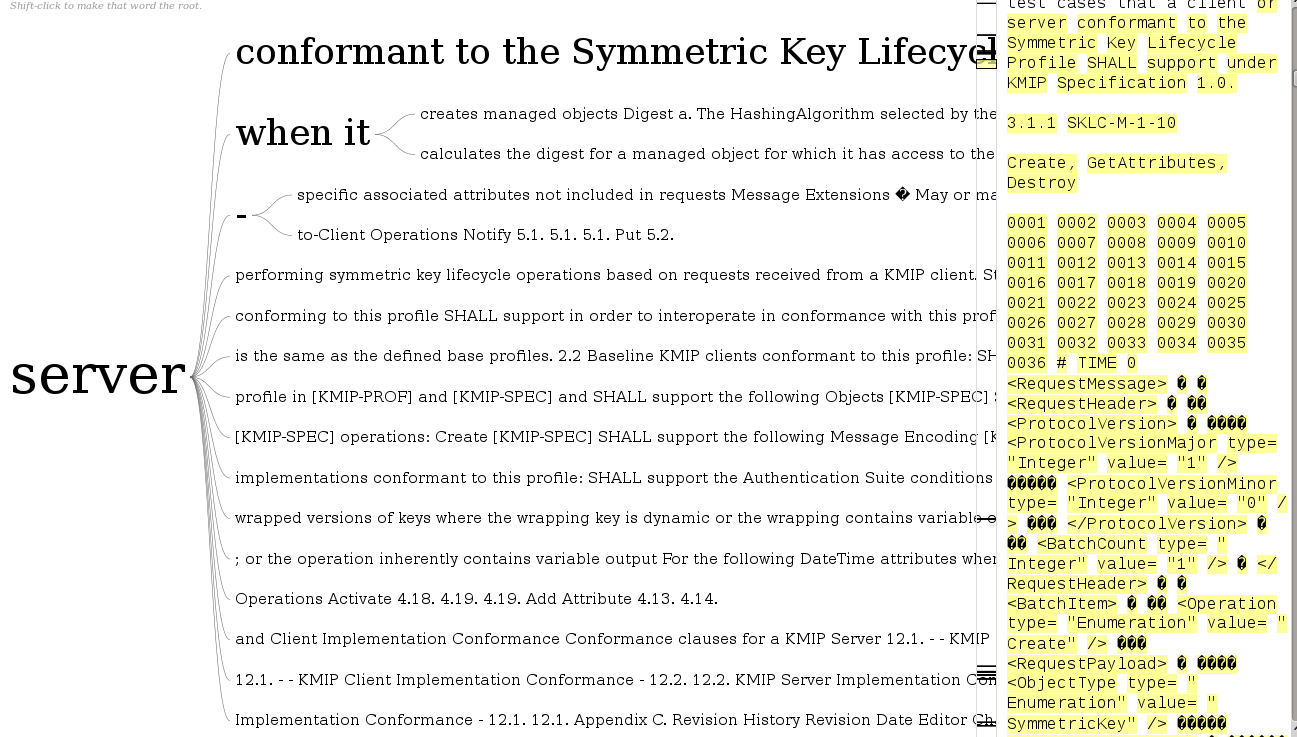
I pasted in the URL from a specification I am reviewing and got this result:

wordtree

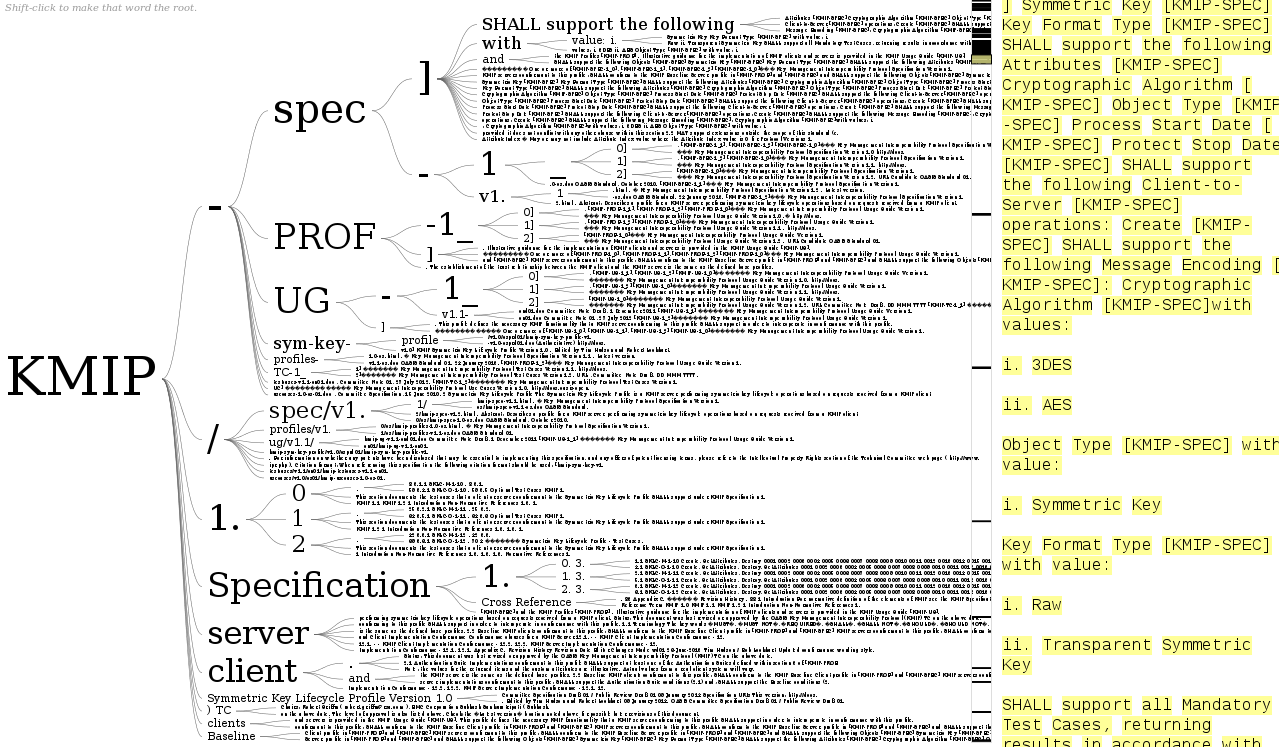
I then changed the focus to “server” and had this result:

wordtree2

Granted I need to play with it a good bit more but not bad for throwing a URL at the page.

I started to say this probably won’t work across multiple texts, in order to check consistency of the documents.

But, I already have text versions of the files with various formatting and boilerplate stripped out. I could just cat all the files together and then run word tree on the resulting file.

Would make checking for consistency a lot easier. True, tracking down the inconsistencies will be a pain but that’s going to be true in any event.

Not feasible to do it manually with 600+ pages of text spread over twelve (12) documents. Well, could if I were in a monastery and had several months to complete the task. 😉

This also looks like a great data exploration tool for topic map authoring as well.

I first saw this in a tweet by Elena Glassman.

Why Apple’s Recent Security Flaw Is So Scary

Filed under: Cybersecurity,Security — Patrick Durusau @ 3:06 pm

Why Apple’s Recent Security Flaw Is So Scary by Brian Barrett.

From the post:

On Friday, Apple quietly released iOS 7.0.6, explaining in a brief release note that it fixed a bug in which “an attacker with a privileged network position may capture or modify data in sessions protected by SSL/TLS.” That’s the understated version. Another way to put it? Update your iPhone right now.

Oh, and by the way, OS X has the same issues—except there’s no fix out yet.

Google’s Adam Langley detailed the specifics of the bug in his personal blog, if you’re looking to stare at some code. But essentially, it comes down to one simple extra line out of nearly 2,000. As ZDNet points out, one extra “goto fail;” statement tucked in about a third of the way means that the SSL verification will go through in almost every case, regardless of if the keys match up or not.

Langley’s take, and the most plausible? That it could have happened to anybody:

This sort of subtle bug deep in the code is a nightmare. I believe that it’s just a mistake and I feel very bad for whomever might have slipped in an editor and created it.

I am sure editing mistakes happen but what puzzles me is why such a “…subtle bug deep in the code…” wasn’t detected during QA?

No matter how subtle or how deep the bug, if passing invalid SSH keys works, you have a bug.

Might be very hard to find the bug, but detecting it under any sane testing conditions should have been trivial. Yes?

Or was it that the bug was discovered in testing and couldn’t be easily found so the code shipped anyway?

All the more reason to have sufficient subject identities to track both coding and testing. And orders related to the same.

I expected a Model T, but instead I got a loom:…

Filed under: BigData,Marketing — Patrick Durusau @ 2:37 pm

I expected a Model T, but instead I got a loom: Awaiting the second big data revolution by Mark Huberty.

Abstract:

Big data” has been heralded as the agent of a third industrial revolution{one with raw materials measured in bits, rather than tons of steel or barrels of oil. Yet the industrial revolution transformed not just how firms made things, but the fundamental approach to value creation in industrial economies. To date, big data has not achieved this distinction. Instead, today’s successful big data business models largely use data to scale old modes of value creation, rather than invent new ones altogether. Moreover, today’s big data cannot deliver the promised revolution. In this way, today’s big data landscape resembles the early phases of the first industrial revolution, rather than the culmination of the second a century later. Realizing the second big data revolution will require fundamentally di fferent kinds of data, diff erent innovations, and diff erent business models than those seen to date. That fact has profound consequences for the kinds of investments and innovations firms must seek, and the economic, political, and social consequences that those innovations portend.

From the introduction:

Four assumptions need special attention: First, N = all, or the claim that our data allow a clear and unbiased study of humanity; second, that today equals tomorrow, or the claim that understanding online behavior today implies that we will still understand it tomorrow; third, that understanding online behavior off ers a window into offine behavior; and fourth, that complex patterns of social behavior, once understood, will remain stable enough to become the basis of new data-driven, predictive products and services. Each of these has its issues. Taken together, those issues limit the future of a revolution that relies, as today’s does, on the \digital exhaust” of social networks, e-commerce, and other online services. The true revolution must lie elsewhere.

Mark makes a compelling case for most practices with “Big Data” are more of same, writ large, as opposed to something completely different.

Topic mappers can take heart from this passage:

Online behavior is a culmination of culture, language, social norms and other factors that shape both people and how they express their identity. These factors are in constant flux. The controversies and issues of yesterday are not those of tomorrow; the language we used to discuss anger, love, hatred, or envy change. The pathologies that afflict humanity may endure, but the ways we express them do not.

The only place where Mark loses me is in the argument that because our behavior changes, it cannot be predicted. Advertisers have been predicting human behavior long enough that they do miss, still, but they hit more than they miss.

Mark mentions Google but in terms of advertising, Google is the kid with a lemonade stand when compared to traditional advertisers.

One difference between Google advertising and traditional advertising is Google has limited itself to online behavior in constructing a model for its ads. Traditional advertisers measure every aspect of their target audience that is possible to measure.

Not to mention that traditional advertising is non-rational. That is traditional advertising will use whatever images, themes, music, etc., that has been shown to make a difference in sales. How that relates to the product or a rational basis for purchasing, is irrelevant.

If you don’t read any other long papers this week, you need to read this one.

Then ask yourself: What new business, data or technologies are you bringing to the table?

I first saw this in a tweet by Joseph Reisinger.

Word Storms:…

Filed under: Text Analytics,Text Mining,Visualization,Word Cloud — Patrick Durusau @ 1:58 pm

Word Storms: Multiples of Word Clouds for Visual Comparison of Documents by Quim Castellà and Charles Sutton.

Abstract:

Word clouds are popular for visualizing documents, but are not as useful for comparing documents, because identical words are not presented consistently across different clouds. We introduce the concept of word storms, a visualization tool for analyzing corpora of documents. A word storm is a group of word clouds, in which each cloud represents a single document, juxtaposed to allow the viewer to compare and contrast the documents. We present a novel algorithm that creates a coordinated word storm, in which words that appear in multiple documents are placed in the same location, using the same color and orientation, across clouds. This ensures that similar documents are represented by similar- looking word clouds, making them easier to compare and contrast visually. We evaluate the algorithm using an automatic evaluation based on document classifi cation, and a user study. The results con rm that a coordinated word storm allows for better visual comparison of documents.

I never have cared for word clouds all that much but word storms as presented by the authors looks quite useful.

The paper examines the use of word storms at a corpus, document and single document level.

You will find Word Storms: Multiples of Word Clouds for Visual Comparison of Documents (website) of particular interest, including its like to Github for the source code used in this project.

Of particular interests for topic mappers is the observation:

similar documents should be represented by visually similar clouds (emphasis in original)

Now imagine for a moment visualizing topics and associations with “similar” appearances. Even if limited to colors that are easy to distinguish, that could be a very powerful display/discover tool for topic maps.

Not the paper’s use case but one that comes to mind with regard to display/discovery in a heterogeneous data set (such as a corpus of documents).

qdap 1.1.0 Released on CRAN [Text Analysis]

Filed under: R,Text Analytics — Patrick Durusau @ 11:44 am

qdap 1.1.0 Released on CRAN by Tyler Rinker.

From the post:

We’re very pleased to announce the release of qdap 1.1.0

This is the fourth installment of the qdap package available at CRAN. Major development has taken place since the last CRAN update.

The qdap package automates many of the tasks associated with quantitative discourse analysis of transcripts containing discourse, including frequency counts of sentence types, words, sentence, turns of talk, syllable counts and other assorted analysis tasks. The package provides parsing tools for preparing transcript data but may be useful for many other natural language processing tasks. Many functions enable the user to aggregate data by any number of grouping variables providing analysis and seamless integration with other R packages that undertake higher level analysis and visualization of text.

Appropriate for chat rooms, IRC transcripts, plays (the sample data is Romeo and Juliet), etc.

February 23, 2014

How Companies are Using Spark

Filed under: BigData,Hadoop,Spark — Patrick Durusau @ 7:50 pm

How Companies are Using Spark, and Where the Edge in Big Data Will Be by Matei Zaharia.

Description:

While the first big data systems made a new class of applications possible, organizations must now compete on the speed and sophistication with which they can draw value from data. Future data processing platforms will need to not just scale cost-effectively; but to allow ever more real-time analysis, and to support both simple queries and today’s most sophisticated analytics algorithms. Through the Spark project at Apache and Berkeley, we’ve brought six years research to enable real-time and complex analytics within the Hadoop stack.

At time mark 1:53, Matei says when size of storage is no longer an advantage, you can gain an advantage by:

Speed: how quickly can you go from data to decisions?

Sophistication: can you run the best algorithms on the data?

As you might suspect, I strongly disagree that those are the only two points where you can gain an advantage with Big Data.

How about including:

Data Quality: How do you make data semantics explicit?

Data Management: Can you re-use data by knowing its semantics?

You can run sophisticated algorithms on data and make quick decisions, but if your data is GIGO (garbage in, garbage out), I don’t see the competitive edge.

Nothing against Spark, managing video streams with only 1 second of buffering was quite impressive.

To be fair, Matei does include ClearStoryData as one of his examples and ClearStory says that they merge data based in its semantics. Unfortunately, the website doesn’t mention any details other than there is a “patent pending.”

But in any event, I do think data quality and data management should be explicit items in any big data strategy.

At least so long as you want big data and not big garbage.

Understanding UMLS

Filed under: Bioinformatics,Medical Informatics,PubMed,UMLS — Patrick Durusau @ 6:02 pm

Understanding UMLS by Sujit Pal.

From the post:

I’ve been looking at Unified Medical Language System (UMLS) data this last week. The medical taxonomy we use at work is partly populated from UMLS, so I am familiar with the data, but only after it has been processed by our Informatics team. The reason I was looking at it is because I am trying to understand Apache cTakes, an open source NLP pipeline for the medical domain, which uses UMLS as one of its inputs.

UMLS is provided by the National Library of Medicine (NLM), and consists of 3 major parts: the Metathesaurus, consisting of over 1M medical concepts, a Semantic Network to categorize concepts by semantic type, and a Specialist Lexicon containing data to help do NLP on medical text. In addition, I also downloaded the RxNorm database that contains drug/medication information. I found that the biggest challenge was accessing the data, so I will describe that here, and point you to other web resources for the data descriptions.

Before getting the data, you have to sign up for a license with UMLS Terminology Services (UTS) – this is a manual process and can take a few days over email (I did this couple of years ago so details are hazy). UMLS data is distributed as .nlm files which can (as far as I can tell) be opened and expanded only by the Metamorphosis (mmsys) downloader, available on the UMLS download page. You need to run the following sequence of steps to capture the UMLS data into a local MySQL database. You can use other databases as well, but you would have to do a bit more work.

….

The table and column names are quite cryptic and the relationships are not evident from the tables. You will need to refer to the data dictionaries for each system to understand it before you do anything interesting with the data. Here are the links to the online references that describe the tables and their relationships for each system better than I can.

I have only captured the highlights from Sujit’s post so see his post for additional details.

There has been no small amount of time and effort invested in UMLS. Than names are cryptic and relationships not specified is more typical than any other state of data.

Take the opportunity to learn about UMLS and to ponder what solutions you would offer.

Accountability in a Computerized Society

Filed under: Cybersecurity,Law,Programming,Security — Patrick Durusau @ 5:46 pm

Accountability in a Computerized Society by Helen Nissenbaum. (The ACM Digital Library reports a publication date of 1997, but otherwise there is no date of publication.)

Abstract:

This essay warns of eroding accountability in computerized societies. It argues that assumptions about computing and features of situations in which computers are produced create barriers to accountability. Drawing on philosophical analyses of moral blame and responsibility, four barriers are identified: (1) the problem of many hands, (2) the problem of bugs, (3) blaming the computer, and (4) software ownership without liability. The paper concludes with ideas on how to reverse this trend.

If a builder has built a house for a man and has not made his work sound, and the house which he has built has fallen down and so caused the death of the householder, that builder shall be put to death.

If it destroys property, he shall replace anything that it has destroyed; and, because he has not made sound the house which he has built and it has fallen down, he shall rebuild the house which has fallen down from his own property.

If a builder has built a house for a man and does not make his work perfect and a wall bulges, that builder shall put that wall into sound condition at his own cost.
—Laws of Hammu-rabi [229, 232, 233]1, circa 2027 B.C.

The leaky bucket style of security detailed in Back to Basics: Beyond Network Hygiene is echoed from this paper from 1997.

Where I disagree with the author is on the need for strict liability in order to reverse the descent into universally insecure computing environments.

Strict liability is typically used when society wants every possible means to be used to prevent damage from a product. Given the insecure habits and nature of software production, strict liability would be grind the software industry to a standstill. Which would be highly undesirable, considering all the buggy software presently in use.

One of the problems that Lindner and Gaycken uncover is a lack of financial incentive to prevent or fix bugs in software.

Some may protest that creating incentives for vendors to fix bugs they created is in some way immoral.

My response would be:

We know lacking incentives results in the bugs continuing to be produced and to remain unfixed. If incentives result in fewer bugs and faster fixes for those that already exists, what is your objection?

What we lack is a model for such incentives. Debating who has the unpaid responsibility for bugs seems pointless. We should be discussing an incentive model to get bugs detected and fixed.

Software vendors will be interested because at present patches and bug fixes are loss centers in their budgets.

Users will be interested because they won’t face routine hammer strikes from script kiddies to mid-level hackers.

The CNO (Computer Network Offense) crowd will be interested because fewer opportunities for script kiddies means more demand for their exceptional exploits.

Like they say, something for everybody.

The one thing no one should want is legislative action on this front. No matter how many legislators you own, the result is going to be bad.

I first saw this in Pete Warden’s Five Short Links for February 21, 2014.

YASP

Filed under: Programming — Patrick Durusau @ 5:04 pm

YASP

From the webpage:

yasp is a fully functional web-based assembler development environment, including a real assembler, emulator and debugger. The assembler dialect is a custom which is held very simple so as to keep the learning curve as shallow as possible. It also features some hardware-elements (LED, Potentiometer, Button, etc.). The main purpose of this project is to create an environment in which students can learn the assembly language so that they understand computers better. Furthermore it allows them to experiment without the fear of breaking something.

The original project team of yasp consists of Robert Fischer and Michael “luto” Lutonsky. For more information take a look at the about-section in the IDEs menu.

Quite a ways from assembly for a GPU but it is a starting point.

Could be useful in discovering young adults with a knack for assembly.

Enjoy!

I first saw this in Nate Torkington’s Four short links: 21 February 2014.

Extending GraphLab to tables

Filed under: GraphLab,Graphs,Tables — Patrick Durusau @ 4:48 pm

Extending GraphLab to tables by Ben Lorica.

From the post:

GraphLab’s SFrame, an interesting and somewhat under-the-radar tool was unveiled1 at Strata Santa Clara. It is a disk-based, flat table representation that extends GraphLab to tabular data. With the addition of SFrame, users can leverage GraphLab’s many algorithms on data stored as either graphs or tables. More importantly SFrame increases GraphLab’s coverage of the data science workflow: it allows users with terabyte-sized datasets to clean their data and create new features directly within GraphLab (SFrame performance can scale linearly with the number of available cores).

The beta version of SFrame can read data from local disk, HDFS, S3 or a URL, and save to a human-readable .csv or a more efficient native format. Once an SFrame is created and saved to disk no reprocessing of the data is needed. Below is Python code that illustrates how to read a .csv file into SFrame, create a new data feature and save it to disk on S3:

Jay Gu wrote Introduction to SFrame, which isn’t as short as the coverage on the GraphLab Create FAQ.

Remember that Spark has integrated GraphX and so also extended it reach into data processing workflow.

The standard for graph software is growing by leaps and bounds!

Making the meaning of contracts visible…

Filed under: Law,Law - Sources,Legal Informatics,Transparency,Visualization — Patrick Durusau @ 4:27 pm

Making the meaning of contracts visible – Automating contract visualization by Stefania Passera, Helena Haapio, Michael Curtotti.

Abstract:

The paper, co-authored by Passera, Haapio and Curtotti, presents three demos of tools to automatically generate visualizations of selected contract clauses. Our early prototypes include common types of term and termination, payment and liquidated damages clauses. These examples provide proof-of-concept demonstration tools that help contract writers present content in a way readers pay attention to and understand. These results point to the possibility of document assembly engines compiling an entirely new genre of contracts, more user-friendly and transparent for readers and not too challenging to produce for lawyers.

Demo.

Slides.

From slides 2 and 3:

Need for information to be accessible, transparent, clear and easy to understand
   Contracts are no exception.

Benefits of visualization

  • Information encoded explicitly is easier to grasp & share
  • Integrating pictures & text prevents cognitive overload by distributing effort on 2 different processing systems
  • Visual structures and cues act as paralanguage, reducing the possibility of misinterpretation

Sounds like the output from a topic map doesn’t it?

A contract is “explicit and transparent” to a lawyer, but that doesn’t mean everyone reading it sees the contract as “explicit and transparent.”

Making what the lawyer “sees” explicit, in other words, is another identification of the same subject, just a different way to describe it.

What’s refreshing is the recognition that not everyone understands the same description, hence the need for alternative descriptions.

Some additional leads to explore on these authors:

Stefania Passera Homepage with pointers to her work.

Helena Haapio Profile at Lexpert, pointers to her work.

Michael Curtotti – Computational Tools for Reading and Writing Law.

There is a growing interest in making the law transparent to non-lawyers, which is going to require a lot more than “this is the equivalent of that, because I say so.” Particularly for re-use of prior mappings.

Looks like a rapid growth area for topic maps to me.

You?

I first saw this at: Passera, Haapio and Curtotti: Making the meaning of contracts visible – Automating contract visualization.

Architecture Matters…

Filed under: Architecture,Clojure,Scalability — Patrick Durusau @ 3:30 pm

Architecture Matters : Building Clojure Services At Scale At SoundCloud by Charles Ditzel.

Charles points to three posts on Clojure services at scale:

Building Clojure Services at Scale by Joseph Wilk.

Architecture behind our new Search and Explore experience by Petar Djekic.

Evolution of SoundCloud’s Architecture by Sean Treadway.

If you aren’t already following Charle’s blog (I wasn’t, am now), you should be.

Data Analysis for Genomics MOOC

Filed under: Data Analysis,Genomics,R — Patrick Durusau @ 2:48 pm

Data Analysis for Genomics MOOC by Stephen Turner.

HarvardX: Data Analysis for Genomics
April 7, 2014.

From the post:

Last month I told you about Coursera’s specializations in data science, systems biology, and computing. Today I was reading Jeff Leek’s blog post defending p-values and found a link to HarvardX’s Data Analysis for Genomics course, taught by Rafael Irizarry and Mike Love. Here’s the course description:

If you’ve ever wanted to get started with data analysis in genomics and you’d learn R along the way, this looks like a great place to start. The course is set to start April 7, 2014.

A threefer: genomics, R and noticing what subjects are unidentified in current genomics practices. Are those subjects important?

If you are worried about the PH207x prerequisite, take a look at: PH207x Health in Numbers: Quantitative Methods in Clinical & Public Health Research. It’s an archived course but still accessible for self-study.

A slow walk through Ph207x will give you a broad exposure to methods in clinical and public health research.

is t

Common Crawl’s Move to Nutch

Filed under: Nutch,Search Engines,Webcrawler — Patrick Durusau @ 2:30 pm

Common Crawl’s Move to Nutch by Jordan Mendelson.

From the post:

Last year we transitioned from our custom crawler to the Apache Nutch crawler to run our 2013 crawls as part of our migration from our old data center to the cloud.

Our old crawler was highly tuned to our data center environment where every machine was identical with large amounts of memory, hard drives and fast networking.

We needed something that would allow us to do web-scale crawls of billions of webpages and would work in a cloud environment where we might run on a heterogenous machines with differing amounts of memory, CPU and disk space depending on the price plus VMs that might go up and down and varying levels of networking performance.

Before you hand roll a custom web crawler, you should read this short but useful report on the Common Crawl experience with Nutch.

…Into Dreamscapes

Filed under: Communication,Graphics,Visualization — Patrick Durusau @ 10:43 am

A Stunning App That Turns Radiohead Songs Into Dreamscapes by Liz Stinson.

From the post:

There’s something about a good Radiohead song that lets your mind roam. And if you could visualize what a world in which Radiohead were the only soundtrack, it would look a lot like the world Universal Everything created for the band’s newly released app PolyFauna (available on iOS and Android). Which is to say, a world that’s full of cinematic landscapes and bizarre creatures that only reside in our subconscious minds.

“I got an email out of nowhere from Thom [Yorke], who’d seen a few projects we’d done,” says Universal Everything founder Matt Pyke. Radiohead was looking to design a digital experience for its 2011 King of Limbs session that departed from the typical music apps available, which tend to put emphasis on discography or tour dates. Instead, the band wanted an audio/visual piece that was more digital art than serviceable app.

Pyke met with Yorke and Stanley Donwood, the artist who’s been responsible for crafting Radiohead’s breed of peculiar, moody aesthetics. “We had a really good chat about how we could push this into a really immersive atmospheric audio/visual environment,” says Pyke. What they came up with was PolyFauna, a gorgeously weird interactive experience based on the skittish beats and melodies of “Bloom,” the first track off of King of Limbs.

Does this suggest a way to visualize financial or business data? Everyone loves staring at rows and rows of spreadsheet numbers, but just for a break, what if you visualized the information corridors for departments in an annual (internal) report? Where each corridors is as wide or narrow as access by other departments to their data?

Or approval processes where gate-keepers are trolls by bridges?

I wouldn’t do an entire report that way but one or two slide or two images could leave a lasting impression.

Remembering the more powerfully you communicate information, the more powerful the information becomes.

February 22, 2014

Fractal Ferns in D3

Filed under: Fractals — Patrick Durusau @ 9:21 pm

Fractal Ferns in D3 by Steve Hall.

From the post:

This week I have been busy exploring the generation of fractals using D3. The image above is a “fractal fern” composed of 150,000 tiny SVG circles generated using some surprisingly simple JavaScript. Fractals are everywhere in the nature world and can be stunningly beautiful, but they are also useful for efficiently generating complex graphics in games and mapping applications. In my own work I like to cast a wide net and checkout new data visualization tools and techniques – you never know when it may come in handy. Some knowledge of fractals is definitely a good thing to have in your toolbox.

There are three parts to this post. The first part will be light introduction to fractals in general with a few links that I found useful. Next, I put together three examples that explore generating fractal ferns using JavaScript and provide some insight into how a simple algorithm repeated many times can produce such a stunning final result.

The last part deals with scaling an SVG to fit the browser window which often comes up in doing responsive design work with D3 visualizations. The solution presented here can really be applied to any data visualization project. If you look closely at the examples, they are being generated to an SVG element that is initially 2px high by 2px wide, yet scale to a large size in the browser window without the need to re-generate the graphic using code as the window size changes.

If you are interested in fractals after reading Steve’s post, Fractal over at Wikipedia has enough links to give you a good start.

Fractals are a reminder that observed smoothness is an artifact of the limitations of our measurements/observations.

The observed smoothness of subject identity in most ontologies is a self-imposed limitation.

Latest Kepler Discoveries

Filed under: Astroinformatics,Data — Patrick Durusau @ 9:01 pm

NASA Hosts Media Teleconference to Announce Latest Kepler Discoveries

NASA Kepler Teleconference: 1 p.m. EST, Wednesday, Feb. 26, 2014.

From the post:

NASA will host a news teleconference at 1 p.m. EST, Wednesday, Feb. 26, to announce new discoveries made by its planet-hunting mission, the Kepler Space Telescope.

The briefing participants are:

Douglas Hudgins, exoplanet exploration program scientist, NASA’s Astrophysics Division in Washington

Jack Lissauer, planetary scientist, NASA’s Ames Research Center, Moffett Field, Calif.

Jason Rowe, research scientist, SETI Institute, Mountain View, Calif.

Sara Seager, professor of planetary science and physics, Massachusetts Institute of Technology, Cambridge, Mass.

Launched in March 2009, Kepler was the first NASA mission to find Earth-size planets in or near the habitable zone — the range of distance from a star in which the surface temperature of an orbiting planet might sustain liquid water. The telescope has since detected planets and planet candidates spanning a wide range of sizes and orbital distances. These findings have led to a better understanding of our place in the galaxy.

The public is invited to listen to the teleconference live via UStream, at: http://www.ustream.tv/channel/nasa-arc

Questions can be submitted on Twitter using the hashtag #AskNASA.

Audio of the teleconference also will be streamed live at: http://www.nasa.gov/newsaudio

A link to relevant graphics will be posted at the start of the teleconference on NASA’s Kepler site: http://www.nasa.gov/kepler

If you aren’t mining Kepler data, this may be the inspiration to get you started!

Someone is going to discover a planet of the right size in the “Goldilocks zone.” It won’t be you for sure if you don’t try.

That would make nice bullet on your data scientist resume: Discovered first Earth sized planet in Goldilocks zone….

OpenRFPs:…

Filed under: Government,Government Data,Open Data,Open Government — Patrick Durusau @ 8:45 pm

OpenRFPs: Open RFP Data for All 50 States by Clay Johnson.

From the post:

Tomorrow at CodeAcross we’ll be launching our first community-based project, OpenRFPs. The goal is to liberate the data inside of every state RFP listing website in the country. We hope you’ll find your own state’s RFP site, and contribute a parser.

The Department of Better Technology’s goal is to improve the way government works by making it easier for small, innovative businesses to provide great technology to government. But those businesses can barely make it through the front door when the RFPs themselves are stored in archaic systems, with sloppy user interfaces and disparate data formats, or locked behind paywalls.

I have posted to the announcement suggesting they use UBL. But in any event, mapping the semantics of RFPs, to enable wider participation would make an interesting project.

I first saw this in a tweet by Tim O’Reilly.

Getty Art & Architecture Thesaurus Now Available

Filed under: Architecture,Art,Linked Data,Museums,Thesaurus — Patrick Durusau @ 8:36 pm

Art & Architecture Thesaurus Now Available as Linked Open Data by James Cuno.

From the post:

We’re delighted to announce that today, the Getty has released the Art & Architecture Thesaurus (AAT)® as Linked Open Data. The data set is available for download at vocab.getty.edu under an Open Data Commons Attribution License (ODC BY 1.0).

The Art & Architecture Thesaurus is a reference of over 250,000 terms on art and architectural history, styles, and techniques. It’s one of the Getty Research Institute’s four Getty Vocabularies, a collection of databases that serves as the premier resource for cultural heritage terms, artists’ names, and geographical information, reflecting over 30 years of collaborative scholarship. The other three Getty Vocabularies will be released as Linked Open Data over the coming 18 months.

In recent months the Getty has launched the Open Content Program, which makes thousands of images of works of art available for download, and the Virtual Library, offering free online access to hundreds of Getty Publications backlist titles. Today’s release, another collaborative project between our scholars and technologists, is the next step in our goal to make our art and research resources as accessible as possible.

What’s Next

Over the next 18 months, the Research Institute’s other three Getty Vocabularies—The Getty Thesaurus of Geographic Names (TGN)®, The Union List of Artist Names®, and The Cultural Objects Name Authority (CONA)®—will all become available as Linked Open Data. To follow the progress of the Linked Open Data project at the Research Institute, see their page here.

A couple of points of particular interest:

Getty documentation says this is the first industrial application of ISO 25964 Information and documentation – Thesauri and interoperability with other vocabularies..

You will probably want to read AAT Semantic Representation rather carefully.

A great source of data and interesting reading on the infrastructure as well.

I first saw this in a tweet by Semantic Web Company.

Back to Basics: Beyond Network Hygiene

Filed under: Cybersecurity,Security — Patrick Durusau @ 5:14 pm

Back to Basics: Beyond Network Hygiene by Felix ‘FX’ Lindner and Sandro Gaycken.

Abstract:

In the past, Computer Network Defense (CND) intended to be minimally intrusive to the other requirements of IT development, business, and operations. This paper outlines how different security paradigms have failed to become effective defense approaches, and what the root cause of the current situation is. Based on these observations, a different point of view is proposed: acknowledging the inherent composite nature of computer systems and software. Considering the problem space from the composite point of view, the paper offers ways to leverage composition for security, and concludes with a list of recommendations.

Before someone starts bouncing around on one leg crying “GRAPH! GRAPH!,” yes, what is described can be modeled as a graph. Any sufficiently fundamental structure can model anything you are likely to encounter. That does not mean any particular structure is appropriate for a given problem.

From the introduction:

Defending computer networks can appear to be an always losing position in the 21st century. It is increasingly obvious that the state of the art in Computer Network Defense (CND) is over a decade behind its counterpart Computer Network Offense (CNO). Even intelligence and military organizations, considered to be best positioned to defend their own infrastructures, struggle to keep the constant onslaught of attackers with varying motives, skills, and resources at bay. Many NATO member states leave the impression that they have all but given up when it comes to recommending effective defense strategies to the entities operating their critical national infrastructure and to the business sector.

At the core of the problem lies a simple but hard historic truth: currently, nobody can purchase secure computer hardware or software. Since the early days of commercial computer use, computer products, including the less obvious elements of the network infrastructure that enable modern use of interconnected machines, have come with absolutely no warranty. They do not even promise any enforceable fitness for a particular purpose. Computer users have become used to the status quo and many do not even question this crucial situation anymore.

The complete lack of product liability was and is one of the driving factors of the IT industry as it fosters a continuous update and upgrade cycle, driving revenue. Therefore, no national economy that has any computer or software industry to speak of can afford to change the product liability status quo. Such a change would most likely exterminate a nation’s entire IT sector immediately, either by exodus or indemnity claims. The same economic factor caused the IT industry to focus research and development efforts on functionality aspects of their products, adding more and more features, in order to support the sales of the next version of products. Simply put, there is no incentive to build secure and robust software, so nobody does it.

The most convincing aspect of this paper is the lack of a quick-fix solution from the authors for network security issues.

In fact, the authors suggest that not using security software is statistically safer than using it.

If you have any interest in computer or network security, read this paper and translate it into blog posts, security stories for news outlets, etc.

That you and the authors “know” some likely solutions to computer security concerns isn’t going to help. Not by itself.

I first saw this in a tweet by Steve Christey Coley.

CIDOC Conceptual Reference Model

Filed under: Conceptualizations,Heterogeneous Data,Integration,Museums,Semantic Diversity — Patrick Durusau @ 4:45 pm

CIDOC Conceptual Reference Model (pdf)

From the “Definition of the CIDOC Conceptual Reference Model:”

This document is the formal definition of the CIDOC Conceptual Reference Model (“CRM”), a formal ontology intended to facilitate the integration, mediation and interchange of heterogeneous cultural heritage information. The CRM is the culmination of more than a decade of standards development work by the International Committee for Documentation (CIDOC) of the International Council of Museums (ICOM). Work on the CRM itself began in 1996 under the auspices of the ICOM-CIDOC Documentation Standards Working Group. Since 2000, development of the CRM has been officially delegated by ICOM-CIDOC to the CIDOC CRM Special Interest Group, which collaborates with the ISO working group ISO/TC46/SC4/WG9 to bring the CRM to the form and status of an International Standard.

Objectives of the CIDOC CRM

The primary role of the CRM is to enable information exchange and integration between heterogeneous sources of cultural heritage information. It aims at providing the semantic definitions and clarifications needed to transform disparate, localised information sources into a coherent global resource, be it with in a larger institution, in intranets or on the Internet. Its perspective is supra-institutional and abstracted from any specific local context. This goal determines the constructs and level of detail of the CRM.

More specifically, it defines and is restricted to the underlying semantics of database schemata and document structures used in cultural heritage and museum documentation in terms of a formal ontology. It does not define any of the terminology appearing typically as data in the respective data structures; however it foresees the characteristic relationships for its use. It does not aim at proposing what cultural institutions should document. Rather it explains the logic of what they actually currently document, and thereby enables semantic interoperability.

It intends to provide a model of the intellectual structure of cultural documentation in logical terms. As such, it is not optimised for implementation-specific storage and processing aspects. Implementations may lead to solutions where elements and links between relevant elements of our conceptualizations are no longer explicit in a database or other structured storage system. For instance the birth event that connects elements such as father, mother, birth date, birth place may not appear in the database, in order to save storage space or response time of the system. The CRM allows us to explain how such apparently disparate entities are intellectually interconnected, and how the ability of the database to answer certain intellectual questions is affected by the omission of such elements and links.

The CRM aims to support the following specific functionalities:

  • Inform developers of information systems as a guide to good practice in conceptual modelling, in order to effectively structure and relate information assets of cultural documentation.
  • Serve as a common language for domain experts and IT developers to formulate requirements and to agree on system functionalities with respect to the correct handling of cultural contents.
  • To serve as a formal language for the identification of common information contents in different data formats; in particular to support the implementation of automatic data transformation algorithms from local to global data structures without loss of meaning. The latter being useful for data exchange, data migration from legacy systems, data information integration and mediation of heterogeneous sources.
  • To support associative queries against integrated resources by providing a global model of the basic classes and their associations to formulate such queries.
  • It is further believed, that advanced natural language algorithms and case-specific heuristics can take significant advantage of the CRM to resolve free text information into a formal logical form, if that is regarded beneficial. The CRM is however not thought to be a means to replace scholarly text, rich in meaning, by logical forms, but only a means to identify related data.

(emphasis in original)

Apologies for the long quote but this covers a number of important topic map issues.

For example:

For instance the birth event that connects elements such as father, mother, birth date, birth place may not appear in the database, in order to save storage space or response time of the system. The CRM allows us to explain how such apparently disparate entities are intellectually interconnected, and how the ability of the database to answer certain intellectual questions is affected by the omission of such elements and links.

In topic map terms I would say that the database omits a topic to represent “birth event” and therefore there is no role player for an association with the various role players. What subjects will have representatives in a topic map is always a concern for topic map authors.

Helpfully, CIDOC explicitly separates the semantics it documents from data structures.

Less helpfully:

Because the CRM’s primary role is the meaningful integration of information in an Open World, it aims to be monotonic in the sense of Domain Theory. That is, the existing CRM constructs and the deductions made from them must always remain valid and well-formed, even as new constructs are added by extensions to the CRM.

Which restricts integration using CRM to systems where CRM is the primary basis for integration, as opposed to be one way to integrate several data sets.

That may not seem important in “web time,” where 3 months equals 1 Internet year. But when you think of integrating data and integration practices as they evolve over decades if not centuries, the limitations of monotonic choices come to the fore.

To take one practical discussion under way, how to handle warning about radioactive waste, which must endure anywhere from 10,000 to 1,000,000 years? A far simpler task than preserving semantics over centuries.

If you think that is easy, remember that lots of people saw the pyramids of Egypt being built. But it was such common knowledge, that no one thought to write it down.

Preservation of semantics is a daunting task.

CIDOC merits a slow read by anyone interested in modeling, semantics, vocabularies, and preservation.

PS: CIDOC: Conceptual Reference Model as a Word file.
MathDL Mathematical Communication

Filed under: Communication,Mathematics,Statistics — Patrick Durusau @ 3:53 pm

MathDL Mathematical Communication

From the post:

MathDL Mathematical Communication is a developing collection of resources for engaging students in writing and speaking about mathematics, whether for the purpose of learning mathematics or of learning to communicate as mathematicians.

This site addresses diverse aspects of mathematical communication, including

Here is a brief summary of suggestions to consider as you design a mathematics class that includes communication.

This site originated at M.I.T. so most of the current content is for teaching upper-level undergraduates to communicate as mathematicians.

The site is now yours. Contribute materials! Suggest improvements!

I discovered this site from a reference at Project Laboratory in Mathematics.

As the complexity of data and data analysis increases, so is you need to communicate mathematics and mathematics-based concepts to lay persons. There is much here that may assist in that task.

With enough experience: The wise you can persuade and the lesser folks you can daunt. 😉

Project Laboratory in Mathematics

Filed under: Education,Mathematics — Patrick Durusau @ 3:17 pm

Project Laboratory in Mathematics by Prof. Haynes Miller, Dr. Nat Stapleton, Saul Glasman, and Susan Ruff.

From the description:

Project Laboratory in Mathematics is a course designed to give students a sense of what it’s like to do mathematical research. In teams, students explore puzzling and complex mathematical situations, search for regularities, and attempt to explain them mathematically. Students share their results through professional-style papers and presentations.

This course site was created specifically for educators interested in offering students a taste of mathematical research. This site features extensive description and commentary from the instructors about why the course was created and how it operates.

Aside from the introductory lecture by Prof. Miller, the next best part are two problem sets, the editing process and resulting final paper.

Something like this, adjusted for grade level, looks far more valuable rote coding exercises.

80 Maps that “Explain” the World

Filed under: Environment,Government,Mapping,Maps,Politics — Patrick Durusau @ 3:06 pm

Max Fisher, writing for the Washington Post, has two posts on maps that “explain” the world. Truly remarkable posts.

40 maps that explain the world, 12 August 2014.

From the August post:

Maps can be a remarkably powerful tool for understanding the world and how it works, but they show only what you ask them to. So when we saw a post sweeping the Web titled “40 maps they didn’t teach you in school,” one of which happens to be a WorldViews original, I thought we might be able to contribute our own collection. Some of these are pretty nerdy, but I think they’re no less fascinating and easily understandable. A majority are original to this blog (see our full maps coverage here)*, with others from a variety of sources. I’ve included a link for further reading on close to every one.

* I repaired the link to “our full maps coverage here.” It is broken in the original post.

40 more maps that explain the world, 13 January 2014.

From the January post:

Maps seemed to be everywhere in 2013, a trend I like to think we encouraged along with August’s 40 maps that explain the world. Maps can be a remarkably powerful tool for understanding the world and how it works, but they show only what you ask them to. You might consider this, then, a collection of maps meant to inspire your inner map nerd. I’ve searched far and wide for maps that can reveal and surprise and inform in ways that the daily headlines might not, with a careful eye for sourcing and detail. I’ve included a link for more information on just about every one. Enjoy.

Bear in mind the usual caveats about the underlying data, points of view represented and unrepresented but this is a remarkable collection of maps.

Highly recommended!

BTW, don’t be confused by the Part two: 40 more maps that explain the world link in the original article. The January 2014 article doesn’t say Part two but after comparing the links, I am satisfied that is what was intended, although it is confusing at first glance.

« Newer PostsOlder Posts »

Powered by WordPress