Another Word For It Patrick Durusau on Topic Maps and Semantic Diversity

January 9, 2014

More digital than thou

Filed under: Digital Research,Humanities — Patrick Durusau @ 8:22 pm

More digital than thou by Michael Sperberg-McQueen.

From the post:

An odd thing has started happening in reviews for the Digital Humanities conference: reviewers are objecting to papers if the reviewer thinks it has relevance beyond the field of DH, apparently on the grounds that the topic is then insufficiently digital. It doesn’t matter how relevant the topic is to work in DH, or how deeply embedded the topic is in a core DH topic like text encoding — if some reviewers don’t see a computer in the proposal, they want to exclude it from the conference.

Michael’s focus on the TEI (Text Encoding Initiative), XML Schema at the W3C, and other projects, kept him from seeing the ramparts being thrown up around digital humanities.

Well, and Michael is just Michael. Whether you are a long time XML hacker or a new comer, Michael is just Michael. When you are really good, you don’t need to cloak yourself in disciplinary robes, boundaries and secret handshakes.

You don’t have to look far in the “digital humanities” to find forums where hand wringing over the discipline of digital humanities is a regular feature. As opposed to concern over what digital technologies have, can, will contribute to the humanities.

Digital technologies should be as much a part of each humanities discipline as the more traditional periodical indexes, concordances, dictionaries and monographs.

After all, I thought there was general agreement that “separate but equal” was a poor policy.

Clojure for the Brave and True

Filed under: Clojure,Functional Programming,Programming — Patrick Durusau @ 7:53 pm

Clojure for the Brave and True by Daniel Higginbotham.

From the webpage:

For weeks, months — no! from the very moment you were born — you’ve felt it calling to you. Every time you’ve held your keyboard aloft, crying out in anguish over an incomprehensible class hierarchy; every time you’ve lain awake at night, disturbing your loved ones with sobs over a mutation-induced heisenbug; every time a race condition has caused you to pull out more of your ever-dwindling hair, some secret part of you has known that there has to be a better way.

Now, at long last, the instructional material you have in front of your face will unite you with the programming language you’ve been longing for.

Are you ready, brave reader? Are you ready to meet your true destiny? Grab your best pair of parentheses: you’re about to embark on the journey of a lifetime!

You have to admit it is a great title!

Probably the start of a * for the Brave and True series. 😉

The Rain Project:…

Filed under: Climate Data,Data,Weather Data — Patrick Durusau @ 7:30 pm

The Rain Project: An R-based Open Source Analysis of Publicly Available Rainfall Data by Gopi Goteti.

From the post:

Rainfall data used by researchers in academia and industry does not always come in the same format. Data is often in atypical formats and in extremely large number of files and there is not always guidance on how to obtain, process and visualize the data. This project attempts to resolve this issue by serving as a hub for the processing of such publicly available rainfall data using R.

The goal of this project is to reformat rainfall data from their native format to a consistent format, suitable for use in data analysis. Within this project site, each dataset is intended to have its own wiki. Eventually, an R package would be developed for each data source.

Currently R code is available to process data from three sources – Climate Prediction Center (global coverage), US Historical Climatology Network (USA coverage) and APHRODITE (Asia/Eurasia and Middle East).

The project home page is here – http://rationshop.github.io/rain_r/

Links to the original sources:

Climate Prediction Center

US Historical Climatology Network

APHRODITE

There are five (5) other sources listed at the project home page “to be included in the future.”

All of these datasets were “transparent” to someone, once upon a time.

Restoring them to transparency is a good deed.

Preventing datasets from going dark is an even better one.

Getting Into Overview

Filed under: Data Mining,Document Management,News,Reporting,Text Mining — Patrick Durusau @ 7:09 pm

Getting your documents into Overview — the complete guide Jonathan Stray.

From the post:

The first and most common question from Overview users is how do I get my documents in? The answer varies depending the format of your material. There are three basic paths to get documents into Overview: as multiple PDFs, from a single CSV file, and via DocumentCloud. But there are several other tricks you might need, depending on your situation.

Great coverage of the first step towards using Overview.

Just in case you are not familiar with Overview (for the about page):

Overview is an open-source tool to help journalists find stories in large numbers of documents, by automatically sorting them according to topic and providing a fast visualization and reading interface. Whether from government transparency initiatives, leaks or Freedom of Information requests, journalists are drowning in more documents than they can ever hope to read.

There are good tools for searching within large document sets for names and keywords, but that doesn’t help find the stories you’re not specifically looking for. Overview visualizes the relationships among topics, people, and places to help journalists to answer the question, “What’s in there?”

Overview is designed specifically for text documents where the interesting content is all in narrative form — that is, plain English (or other languages) as opposed to a table of numbers. It also works great for analyzing social media data, to find and understand the conversations around a particular topic.

It’s an interactive system where the computer reads every word of every document to create a visualization of topics and sub-topics, while a human guides the exploration. There is no installation required — just use the free web application. Or you can run this open-source software on your own server for extra security. The goal is to make advanced document mining capability available to anyone who needs it.

Examples of people using Overview? See Completed Stories for a sampling.

Overview is a good response to government “disclosures” that attempt to hide wheat in lots of chaff.

Light Table is open source

Filed under: Documentation,Programming,Uncategorized — Patrick Durusau @ 5:34 pm

Light Table is open source by Chris Granger.

From the post:

Today Light Table is taking a huge step forward – every bit of its code is now on Github and along side of that, we’re releasing Light Table 0.6.0, which includes all the infrastructure to write and use plugins. If you haven’t been following the 0.5.* releases, this latest update also brings a tremendous amount of stability, performance, and clean up to the party. All of this together means that Light Table is now the open source developer tool platform that we’ve been working towards. Go download it and if you’re new give our tutorial a shot!

If you aren’t already familiar with Light Table, check out The IDE as a value, also by Chris Granger.

Just a mention in the notes, but start listening for “contextuality.” It comes up in functional approaches to graph algorithms.

Newspeak: It’s doubleplusgood

Filed under: Functional Programming,Newspeak,Programming — Patrick Durusau @ 11:41 am

Newspeak: It’s doubleplusgood

From the webpage:

What is Newspeak?

Newspeak is a new programming language in the tradition of Self and Smalltalk. Newspeak is highly dynamic and reflective – but designed to support modularity and security. It supports both object-oriented and functional programming.

Like Self, Newspeak is message-based; all names are dynamically bound. However, like Smalltalk, Newspeak uses classes rather than prototypes. As in Beta, classes may nest. Because class names are late bound, all classes are virtual, every class can act as a mixin, and class hierarchy inheritance falls out automatically. Top level classes are essentially self contained parametric namespaces, and serve to define component style modules, which naturally define sandboxes in an object-capability style. Newspeak was deliberately designed as a principled dynamically typed language. We plan to evolve the language to support pluggable types.

After I posted Deconstructing Functional Programming by Gilad Bracha, I wanted to highlight Newspeak and list some resources for it.

Listed at the website:

Documents

Downloads (latest version September 14, 2013)

Newspeak Programming Language (Google Group)

Video & Audio

One additional resource I discovered:

Parsing JSON with Newspeak by Luis Diego Fallas.

What else have I missed?

January 8, 2014

Create Real-Time Graphs with PubNub and D3.js

Filed under: Charts,D3,Graphics — Patrick Durusau @ 8:19 pm

Create Real-Time Graphs with PubNub and D3.js by Dan Ristic.

From the post:

Graphs make data easier to understand for any user. Previously we created a simple graph using D3.js to show a way to Build a Real-Time Bitcoin Pricing and Trading Infrastructure. Now we are going to dive a bit deeper with the power of D3.js, showing how graphs on web pages can be interactive and display an array of time plot data using a standard Cartesian coordinate system in an easily understandable fashion.

Unfortunately, once a user has loaded a web graph, the data is already stale and the user would normally need to refresh the entire page to get the latest information. However, not having the most current, updated information can be extremely detrimental to a decision making process. Thus, the need for real-time charting! This blog post will show how you can fix this problem and use the PubNub Real-Time Network to enhance D3.js with Real-Time graphing without reloading the page or polling with AJAX requests for changes.

Want to see it in action? Check out our live, working bitcoin graph demo here.

Yes, I know, it is a chart, not a graph. 😉

Maybe that should be an early vocabulary to propose. A vocabulary that distinguishes graphic representations from data structures. It would make for much better search results.

Suggestions?

PS: Despite my quibbles about the terminology, the article has techniques you will find generally useful.

BIIIG:…

Filed under: BI,Graphs,Neo4j,Networks — Patrick Durusau @ 8:03 pm

BIIIG : Enabling Business Intelligence with Integrated Instance Graphs by André Petermann, Martin Junghanns, Robert Müller, Erhard Rahm.

Abstract:

We propose a new graph-based framework for business intelligence called BIIIG supporting the flexible evaluation of relationships between data instances. It builds on the broad availability of interconnected objects in existing business information systems. Our approach extracts such interconnected data from multiple sources and integrates them into an integrated instance graph. To support specific analytic goals, we extract subgraphs from this integrated instance graph representing executed business activities with all their data traces and involved master data. We provide an overview of the BIIIG approach and describe its main steps. We also present initial results from an evaluation with real ERP data.

Very interesting paper because on one hand it talks about merging data from heterogeneous data sets and at the same time claims to be using Neo4j.

In case you didn’t know, Neo4j enforces normalization and doesn’t have a concept of merging nodes. (True, Cypher has a “merge” operator but it doesn’t “merge” nodes in any meaningful sense of the word. Either a node is matched or a new node is created. Not how I interpret “merge.”)

It took more than one read but in puzzling over:

For integrated objects we can merge the properties from the sources. For the example in Fig. 2, we can combine employees objects with CIT.employees.erp_empl_number = ERP.EmplyeeTable.number and merge their properties from both sources (name, degree, dob, address, phone).

I realized the authors were producing a series of graphs where only the final version of the graph has the “merged” nodes. If you notice, the nodes are created first and then populated with associations, which resolves the question of using different pointers from the original sources.

The authors also point out that Neo4j cannot manage sets of graphs. I had overlooked that point. That is a fairly severe limitation.

Do spend some time at the Database Group Leipzig. There are several other recent papers that look very interesting.

Elastic Mesos

Filed under: Amazon Web Services AWS,Clustering (servers),Mesos — Patrick Durusau @ 7:21 pm

Mesosphere Launches Elastic Mesos, Makes Setting Up A Mesos Cluster A 3-Step Process by Frederic Lardinois.

From the post:

Mesosphere, a startup that focuses on developing Mesos, a technology that makes running complex distributed applications easier, is launching Elastic Mesos today. This new product makes setting up a Mesos cluster on Amazon Web Services a basic three-step process that asks you for the size of the cluster you want to set up, your AWS credentials and an email where you want to get notifications about your cluster’s state.

Given the complexity of setting up a regular Mesos cluster, this new project will make it easier for developers to experiment with Mesos and the frameworks Mesosphere and others have created around it.

As Mesosphere’s founder Florian Leibert describes it, for many applications, the data center is now the computer. Most applications now run on distributed systems, but connecting all of the distributed parts is often still a manual process. Mesos’ job is to abstract away all of these complexities and to ensure that an application can treat the data center and all your nodes as a single computer. Instead of setting up various server clusters for different parts of your application, Mesos creates a shared pool of servers where resources can be allocated dynamically as needed.

Remote computing isn’t as secure as my NATO SDIP-27 Level A (formerly AMSG 720B) and USA NSTISSAM Level I conformant office but there is a trade-off between maintenance/upgrade of local equipment and the convenience of remote computing.

In the near future, all forms of digital communication will be secure from the NSA and others. Before Snowden, it was widely known in a vague sense that the NSA and others were spying on U.S. citizens and others. Post-Snowden, user demand will result in vendors developing secure communications with two settings, secure and very secure.

Ironic that overreaching by the NSA will result in greater privacy for everyone of interest to the NSA.

PS: See Learn how to use Apache Mesos as well.

Vocabularies at W3C

Filed under: Schema.org,Vocabularies — Patrick Durusau @ 4:54 pm

Vocabularies at W3C by Phil Archer.

From the post:

In my opening post on this blog I hinted that another would follow concerning vocabularies. Here it is.

When the Semantic Web first began, the expectation was that people would create their own vocabularies/schemas as required – it was all part of the open world (free love, do what you feel, dude) Zeitgeist. Over time, however, and with the benefit of a large measure of hindsight, it’s become clear that this is not what’s required.

The success of Linked Open Vocabularies as a central information point about vocabularies is symptomatic of a need, or at least a desire, for an authoritative reference point to aid the encoding and publication of data. This need/desire is expressed even more forcefully in the rapid success and adoption of schema.org. The large and growing set of terms in the schema.org namespace includes many established terms defined elsewhere, such as in vCard, FOAF, Good Relations and rNews. I’m delighted that Dan Brickley has indicated that schema.org will reference what one might call ‘source vocabularies’ in the near future, I hope with assertions like owl:equivalentClass, owl:equivalentProperty etc.

Designed and promoted as a means of helping search engines make sense of unstructured data (i.e. text), schema.org terms are being adopted in other contexts, for example in the ADMS. The Data Activity supports the schema.org effort as an important component and we’re delighted that the partners (Google, Microsoft, Yahoo! and Yandex) develop the vocabulary through the Web Schemas Task Force, part of the W3C Semantic Web Interest Group of which Dan Brickley is chair.

Phil then makes a pitch for doing vocabulary work at the W3C but you can see his post for the details.

I think the success of schema.org is a flashing pointer to a semantic sweet spot.

It isn’t nearly everything that you could do with RDF/OWL or with topic maps, but it’s enough to show immediate ROI for a minimum of investment.

Make no mistake, people will develop different vocabularies for the same activities. Not a problem. Topic maps will be able to help you robustly map between different vocabularies.

Astera Centerprise

Filed under: Data Integration,Documentation — Patrick Durusau @ 4:28 pm

Asteria Centerprise

From the post:

The first in our Centerprise Best Practices Webinar Series discusses the features of Centerprise that make it the ideal integration solution for the high volume data warehouse. Topics include data quality (profiling, quality measurements, and validation), translating data to star schema (maintaining foreign key relationships and cardinality with slowly changing dimensions), and performance, including querying data with in-database joins and caching. We’ve posted the Q&A below, which delves into some interesting topics.

You can view the webinar video, as well as all our demo and tutorial videos, at Astera TV.

Very visual approach to data integration.

Be aware that comments on objects in a dataflow are a “planned” feature:

An exteremly useful (and simple) addition to Centerprise would be the ability to pin notes onto a flow to be quickly and easily seen by anyone who opens the flow.

This would work as an object which could be dragged to the flow, and allow the user enter enter a note which would remain on-screen, unlike the existing comments which require you to actually open the object and page to the ‘comments’ pane.

This sort of logging ability will prove very useful to explain to future dataflow maintainers why certain decisions were made in the design, as well as informing them of specific changes/additions and the reasons why they were enacted.

As Centerprise is almost ‘self-documenting’, the note-keeping ability would allow us to avoid maintaining and refering to seperate documentation (which can become lost)

A comment on each data object would be an improvement but a flat comment would be of limited utility.

A structured comment (perhaps extensible comment?) that captures the author, date, data source, target, etc. would make comments usefully searchable.

Including structured comments on the dataflows, transformations, maps and workflows themselves and to query for the presence of structured comments would be very useful.

A query for the existence of structured comments could help enforce local requirements for documenting data objects and operations.

Data Loading Neo4j Graphs From SQL Sources [+ 98 others]

Filed under: Mule,Neo4j — Patrick Durusau @ 3:48 pm

Data Loading Neo4j Graphs From SQL Sources by Richard Donovan.

From the post:

Neo4j’s powerful graph database can be used for analytics, recommendation engines, social graphs and many more applications.

In the following example we demonstrate in a few steps how you can load Neo4j from your legacy relations sql source.

You can download Mule Studio from; http://www.mulesoft.org/download-mule-esb-community-edition

A short post on using Mule to load SQL data into Neo4j.

More importantly Mule has ninety-nine (98) connectors (99 including Neo4j), opening up a world of data sources for Neo4j.

See the Mule documentation for details.

Morpho project

Filed under: Language,Parsing — Patrick Durusau @ 2:02 pm

Morpho project

From the webpage:

The goal of the Morpho project is to develop unsupervised data-driven methods that discover the regularities behind word forming in natural languages. In particular, we are focusing on the discovery of morphemes, which are the primitive units of syntax, the smallest individually meaningful elements in the utterances of a language. Morphemes are important in automatic generation and recognition of a language, especially in languages in which words may have many different inflected forms.

This may not be of general interest but I mention it as one aspect of data-driven linguistics.

Long dead languages are often victims of well-meaning but highly imaginative work meant to explain those languages.

Grounding work in texts of a language introduces a much needed sanity check.

BigDataBench:…

Filed under: Benchmarks,BigData — Patrick Durusau @ 11:07 am

BigDataBench: a Big Data Benchmark Suite from Internet Services by Lei Wang, et.al.

Abstract:

As architecture, systems, and data management communities pay greater attention to innovative big data systems and architecture, the pressure of benchmarking and evaluating these systems rises. However, the complexity, diversity, frequently changed workloads, and rapid evolution of big data systems raise great challenges in big data benchmarking. Considering the broad use of big data systems, for the sake of fairness, big data benchmarks must include diversity of data and workloads, which is the prerequisite for evaluating big data systems and architecture. Most of the state-of-the-art big data benchmarking efforts target evaluating specific types of applications or system software stacks, and hence they are not qualified for serving the purposes mentioned above.

This paper presents our joint research efforts on this issue with several industrial partners. Our big data benchmark suite—BigDataBench not only covers broad application scenarios, but also includes diverse and representative data sets. Currently, we choose 19 big data benchmarks from dimensions of application scenarios, operations/ algorithms, data types, data sources, software stacks, and application types, and they are comprehensive for fairly measuring and evaluating big data systems and architecture. BigDataBench is publicly available from the project home page http://prof.ict.ac.cn/BigDataBench.

Also, we comprehensively characterize 19 big data workloads included in BigDataBench with varying data inputs. On a typical state-of-practice processor, Intel Xeon E5645, we have the following observations: First, in comparison with the traditional benchmarks: including PARSEC, HPCC, and SPECCPU, big data applications have very low operation intensity, which measures the ratio of the total number of instructions divided by the total byte number of memory accesses; Second, the volume of data input has non-negligible impact on micro-architecture characteristics, which may impose challenges for simulation-based big data architecture research; Last but not least, corroborating the observations in CloudSuite and DCBench (which use smaller data inputs), we find that the numbers of L1 instruction cache (L1I) misses per 1000 instructions (in short, MPKI) of the big data applications are higher than in the traditional benchmarks; also, we find that L3 caches are effective for the big data applications, corroborating the observation in DCBench.

An excellent summary of current big data benchmarks along with datasets and diverse benchmarks for varying big data inputs.

I emphasize diverse because we have all known “big data” covers a wide variety of data. Unfortunately, that hasn’t always been a point of emphasis. This paper corrects that oversight.

The User_Manual for Big Data Bench 2.1.

Summaries of the data sets and benchmarks:

No. data sets data size

1

Wikipedia Entries

4,300,000 English articles

2

Amazon Movie Reviews

7,911,684 reviews

3

Google Web Graph

875713 nodes, 5105039 edges

4

Facebook Social Network

4039 nodes, 88234 edges

5

E-commerce Transaction Data

table1: 4 columns, 38658 rows.

table2: 6 columns, 242735 rows

6

ProfSearch Person Resumes

278956 resumes


Table 2: The Summary of BigDataBench

Application Scenarios

Operations & Algorithm

Data Type

Data Source

Software stack

Application type

Micro Benchmarks

Sort

Unstructured

Text

MapReduce, Spark, MPI

Offline Analytics

Grep

Unstructured

Text

MapReduce, Spark, MPI

Offline Analytics

WordCount

Unstructured

Text

MapReduce, Spark, MPI

Offline Analytics

BFS

Unstructured

Graph

MapReduce, Spark, MPI

Offline Analytics

Basic Datastore Operations (“Cloud OLTP”)

Read

Semi-structured

Table

Hbase, Cassandra, MongoDB, MySQL

Online Service

Write

Semi-structured

Table

Hbase, Cassandra, MongoDB, MySQL

Online Services

Scan

Semi-structured

Table

Hbase, Cassandra, MongoDB, MySQL

Online Services

Relational Query

Select Query

Structured

Table

Impala, Shark, MySQL, Hive

Realtime Analytics

Aggregate Query

Structured

Table

Impala, Shark, MySQL, Hive

Realtime Analytics

Join Query

Structured

Table

Impala, Shark, MySQL, Hive

Realtime Analytics

Search Engine

Nutch Server

Structured

Table

Hadoop

Online Services

PageRank

Unstructured

Graph

Hadoop, MPI, Spark

Offline Analytics

Index

Unstructured

Text

Hadoop, MPI, Spark

Offline Analytics

Social Network

Olio Server

Structured

Table

MySQL

Online Service

K-means

Unstructured

Graph

Hadoop, MPI, Spark

Offline Analytics

Connected Com-ponents

Unstructured

Graph

Hadoop, MPI, Spark

Offline Analytics

E-commerce

Rubis Server

Structured

Table

MySQL

Online Service

Collaborative Filtering

Unstructured

Text

Hadoop, MPI, Spark

Offline Analytics

Naive Bayes

Unstructrued

Text

Hadoop, MPI, Spark

Offline Analytics

I first saw this in a tweet by Stefano Bertolo.

Introducing mangal,…

Filed under: Environment,Graphs,Networks,R,Taxonomy — Patrick Durusau @ 9:37 am

Introducing mangal, a database for ecological networks

From the post:

Working with data on ecological networks is usually a huge mess. Most of the time, what you have is a series of matrices with 0 and 1, and in the best cases, another file with some associated metadata. The other issue is that, simply put, data on ecological networks are hard to get. The Interaction Web Database has some, but it's not as actively maintained as it should, and the data are not standardized in any way. When you need to pull a lot of networks to compare them, it means that you need to go through a long, tedious, and error-prone process of cleaning and preparing the data. It should not be that way, and that is the particular problem I've been trying to solve since this spring.

About a year ago, I discussed why we should have a common language to represent interaction networks. So with this idea in mind, and with great feedback from colleagues, I assembled a series of JSON schemes to represent networks, in a way that will allow programmatic interaction with the data. And I'm now super glad to announce that I am looking for beta-testers, before I release the tool in a formal way. This post is the first part of a series of two or three posts, which will give informations about the project, how to interact with the database, and how to contribute data. I'll probably try to write a few use-cases, but if reading these posts inspire you, feel free to suggest some!

So what is that about?

mangal (another word for a mangrove, and a type of barbecue) is a way to represent and interact with networks in a way that is (i) relatively easy and (ii) allows for powerful analyses. It's built around a data format, i.e. a common language to represent ecological networks. You can have an overview of the data format on the website. The data format was conceived with two ideas in mind. First, it must makes sense from an ecological point of view. Second, it must be easy to use to exchange data, send them to database, and get them through APIs. Going on a website to download a text file (or an Excel one) should be a thing of the past, and the data format is built around the idea that everything should be done in a programmatic way.

Very importantly, the data specification explains how data should be formatted when they are exchanged, not when they are used. The R package, notably, uses igraph to manipulate networks. It means that anyone with a database of ecological networks can write an API to expose these data in the mangal format, and in turn, anyone can access the data with the URL of the API as the only information.

Because everyone uses R, as I've mentionned above, we are also releasing a R package (unimaginatively titled rmangal). You can get it from GitHub, and we'll see in a minute how to install it until it is released on CRAN. Most of these posts will deal with how to use the R package, and what can be done with it. Ideally, you won't need to go on the website at all to interact with the data (but just to make sure you do, the website has some nice eye-candy, with clickable maps and animated networks).

An excellent opportunity to become acquainted with the iGraph package for R (299 pages), IGraph for Python (394 pages), and iGraph C Library (812 pages).

Unfortunately, iGraph does not support multigraphs or hypergraphs.

January 7, 2014

Small Crawl

Filed under: Common Crawl,Data,Webcrawler,WWW — Patrick Durusau @ 7:40 pm

meanpath Jan 2014 Torrent – 1.6TB of crawl data from 115m websites

From the post:

October 2012 was the official kick off date for development of meanpath – our source code search engine. Our goal was to crawl as much of the web as we could using mostly open source software and a decent (although not Google level) financial investment. Outside of many substantial technical challenges, we also needed to acquire a sizeable list of seed domains as the starting block for our crawler. Enter Common Crawl which is an open crawl of the web that can be accessed and analysed by everyone. Of specific interest to us was the Common Crawl URL Index which we combined with raw domain zone files and domains from the Internet Census 2012 to create our master domain list.

We are firm supporters of open access to information which is why we have chosen to release a free crawl of over 115 million sites. This index contains only the front page HTML, robots.txt, favicons, and server headers of every crawlable .com, .net, .org, .biz, .info, .us, .mobi, and .xxx that were in the 2nd of January 2014 zone file. It does not execute or follow JavaScript or CSS so is not 100% equivalent to what you see when you click on view source in your browser. The crawl itself started at 2:00am UTC 4th of January 2014 and finished the same day.

Get Started:
You can access the meanpath January 2014 Front Page Index in two ways:

  1. Bittorrent – We have set up a number of seeds that you can download from using this descriptor. Please seed if you can afford the bandwidth and make sure you have 1.6TB of disk space free if you plan on downloading the whole crawl.
  2. Web front end – If you are not interested in grappling with the raw crawl files you can use our web front end to do some sample searches.

Data Set Statistics:

  1. 149,369,860 seed domains. We started our crawl with a full zone file list of all domains in the .com (112,117,307), .net (15,226,877), .org (10,396,351), .info (5,884,505), .us (1,804,653), .biz (2,630,676), .mobi (1,197,682) and .xxx (111,809) top level domains (TLD) for a total of 149,369,860 domains. We have a much larger set of domains that cover all TLDs but very few allow you to download a zone file from the registrar so we cannot guarantee 100% coverage. For statistical purposes having a defined 100% starting point is necessary.
  2. 115,642,924 successfully crawled domains. Of the 149,369,860 domains only 115,642,924 were able to be crawled which is a coverage rate of 77.42%
  3. 476 minutes of crawling. It took us a total of 476 minutes to complete the crawl which was done in 5 passes. If a domain could not be crawled in the first pass we tried 4 more passes before giving up (those excluded by robots.txt are not retried). The most common reason domains are not able to be crawled is a lack of any valid A record for domain.com or www.domain.com
  4. 1,500GB of uncompressed data. This has been compressed down to 352.40gb using gzip for ease of download.

I just scanned the Net for 2TB hard drives and the average runs between $80 and $100. There doesn’t seem to be much difference between internal and external.

The only issue I foresee is that some ISPs limit downloads. You can always tunnel to another box using SSH but that requires enough storage on the other box as well.

Be sure to check out meanpath’s search capabilities.

Perhaps the day of boutique search engines is getting closer!

Unaccountable:…

Filed under: Finance Services,Marketing,Topic Maps — Patrick Durusau @ 7:19 pm

Unaccountable: The high cost of the Pentagon’s bad bookkeeping.

Part 1: Number Crunch by by Scot J. Paltrow and Kelly Carr (July 2, 2013)

Part 2: Faking It. by Scot J. Paltrow (November 18, 2013)

Part 3: Broken Fixes by Scot J. Paltrow (December 23, 2013)

If you imagine NSA fraud as being out of control, you haven’t seen anything yet.

Stated bluntly, bad bookkeeping by the Pentagon has a negative impact on its troops, its ability to carry out its primary missions and is a sinkhole for taxpayer dollars.

If you make it to the end of Part 3, you will find:

  • The Pentagon was required to be auditable by 1996 (with all other federal agencies). The current, largely fictional deadline is 2017.
  • Since 1996, the Pentagon has spent an unaudited $8.5 trillion.
  • The Pentagon may have as many as 5,000 separate accounting systems.
  • Attempts to replace Pentagon accounting systems have been canceled after expenditures of $1 billion on more than one, as failures.
  • There are no legal consequences for the Pentagon, the military services, their members or civilian contractors if the Pentagon fails to meet audit deadlines.

If external forces were degrading the effectiveness of the U.S. military to this degree, Congress would be hot to fix the problem.

Topic maps aren’t a complete answer to this problem but they could help with the lack of accountability for the problem. Every order originates with someone approving it. Topic maps could bind that order to a specific individual and track its course through whatever systems exist today.

A running total of unaudited funds would be kept for every individual who approved an order. If those funds cannot be audited within say 90 days of the end of the fiscal year, that a lien is placed against any and all benefits they have accrued to that point. And everyone higher than themselves in the chain of command. To give commanders “skin in the game.”

Tracking of responsibility and not the funds, with automatic consequences for failure, would provide incentives for the Pentagon to improve the morale of its troops, to improve its combat readiness and to be credible when asking the Congress and American pubic for additional funds for specific purposes.

Do you have similar problems at your enterprise?

Hash Tags

Filed under: Humor — Patrick Durusau @ 6:40 pm

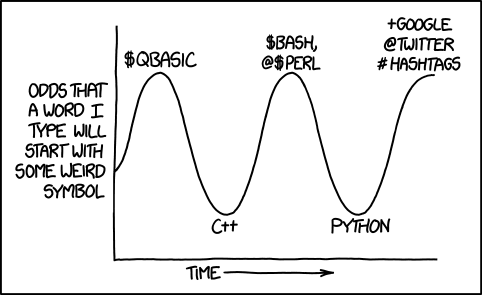
hash tags

The mouse over doesn’t work with the embedded image. Mouse over should display:

“The cycle seems to be ‘we need these symbols to clarify what types of things we’re referring to!’ followed by ‘wait, it turns out words already do that.'”

Could it be that computer languages are pigdin languages? Languages that lack the richness of natural languages? That could explain the duplication of some symbols. 😉

I first saw this at Greg Linden’s Quick links, January 2, 2014.

Filtering: Seven Principles

Filed under: Filters,Legends,Merging — Patrick Durusau @ 5:29 pm

Filtering: Seven Principles by JP Rangaswami.

When you read “filters” in the seven rules, think merging rules.

From the post:

  1. Filters should be built such that they are selectable by subscriber, not publisher.
  2. Filters should intrinsically be dynamic, not static.
  3. Filters should have inbuilt “serendipity” functionality.
  4. Filters should be interchangeable, exchangeable, even tradeable.
  5. The principal filters should be by choosing a variable and a value (or range of values) to include or exclude.
  6. Secondary filters should then be about routing.
  7. Network-based filters, “collaborative filtering” should then complete the set.

Nat Torkington comments on this list:

I think the basic is: 0: Customers should be able to run their own filters across the information you’re showing them.

+1!

And it should be simpler than hunting for .config/google-chrome/Default/User Stylesheets/Custom.css (for Chrome on Ubuntu).

Ideally a select (from a webpage) and choose an action.

The ability to dynamically select properties for merging would greatly enhance a user’s ability to explore and mine a topic map.

I first saw this in Nat Torkington’s Four short links: 6 January 2014.

January 6, 2014

Linking Visualization and Understanding in Astronomy

Filed under: Astroinformatics,Visualization — Patrick Durusau @ 8:03 pm

Linking Visualization and Understanding in Astronomy by Alyssa Goodman.

Abstract:

In 1610, when Galileo pointed his small telescope at Jupiter, he drew sketches to record what he saw. After just a few nights of observing, he understood his sketches to be showing moons orbiting Jupiter. It was the visualization of Galileo’s observations that led to his understanding of a clearly Sun-centered solar system, and to the revolution this understanding then caused. Similar stories can be found throughout the history of Astronomy, but visualization has never been so essential as it is today, when we find ourselves blessed with a larger wealth and diversity of data, per astronomer, than ever in the past. In this talk, I will focus on how modern tools for interactive “linked-view” visualization can be used to gain insight. Linked views, which dynamically update all open graphical displays of a data set (e.g. multiple graphs, tables and/or images) in response to user selection, are particularly important in dealing with so-called “high-dimensional data.” These dimensions need not be spatial, even though, e.g. in the case of radio spectral-line cubes or optical IFU data), they often are. Instead, “dimensions” should be thought of as any measured attribute of an observation or a simulation (e.g. time, intensity, velocity, temperature, etc.). The best linked-view visualization tools allow users to explore relationships amongst all the dimensions of their data, and to weave statistical and algorithmic approaches into the visualization process in real time. Particular tools and services will be highlighted in this talk, including: Glue (glueviz.org), the ADS All Sky Survey (adsass.org), WorldWide Telescope (worldwidetelescope.org), yt (yt-project.org), d3po (d3po.org), and a host of tools that can be interconnected via the SAMP message-passing architecture. The talk will conclude with a discussion of future challenges, including the need to educate astronomers about the value of visualization and its relationship to astrostatistics, and the need for new technologies to enable humans to interact more effectively with large, high-dimensional data sets.

Extensive list of links mentioned in the talk along with other resources follows the abstract.

Slides from the keynote (90MB) are available now.

Video of the keynote should be posted by tomorrow.

There are differences between disciplines, vocabularies differ, techniques differ, data practices vary, but they all share the common task of making sense of the data they collect.

Watching other disciplines may be one of the better ways to get ahead in your own.

Not to mention the slides really rock on a night when it is too cold to venture out!

Enron, Email, Kiji, Hive, YARN, Tez (Jan. 7th, DC)

Filed under: Email,Hadoop YARN,Hive,KIji Project,Tez — Patrick Durusau @ 7:43 pm

Exploring Enron Email Dataset with Kiji and Hive; Apache YARN and Apache Tez Hadoop-DC.

Tuesday, January 7, 2014 6:00 PM to 9:30 PM
Neustar (Room: Neuview) 21575 Ridgetop Circle, Sterling, VA

From the webpage:

Exploring Enron Email Dataset with Kiji and Hive

Lee Sheng, WibiData

Apache Hive is a data warehousing system for large volumes of data stored in Hadoop that provides SQL based access for exploring datasets. KijiSchema provides evolvable schemas of primitive and compound types on top of HBase. The integration between these provides the best aspects of both worlds (ad hoc SQL based querying on top of datasets using evolvable schemas containing complex objects). This talk will present an examples of queries utilizing this integration to do exploratory analysis of the Enron email corpus. Delving into topics such as email responder pairs and sentiment analysis can expose many of the interesting points in the rise and fall of Enron.

Apache YARN & Apache Tez

Tom McCuch Technical Director, Hortonworks

Apache Hadoop has become synonymous with Big Data and powers large scale data processing across some of the biggest companies in the world. Hadoop 2 is the next generation release of Hadoop and marks a pivotal point in its maturity with YARN – the new Hadoop compute framework. YARN – Yet Another Resource Negotiator – is a complete re-architecture of the Hadoop compute stack with a clean separation between platform and application. This opens up Hadoop data processing to new applications that can be executed IN Hadoop instead of outside Hadoop, thus improving efficiency, performance, data sharing and lowering operation costs. The Big Data ecosystem is already converging on YARN with new applications like Apache Tez being written specifically for YARN. Apache Tez aims to provide high performance and efficiency out of the box, across the spectrum of low latency queries and heavy-weight batch processing. The talk will provide a brief overview of key Hadoop 2 innovations, focusing in on YARN and Tez – covering architecture, motivational use cases and future roadmap. Finally, the impact of YARN on the Hadoop community will be demonstrated through running interactive queries with both Hive on Tez and with Hive on MapReduce, and comparing their performance side-by-side on the same Hadoop 2 cluster.

When I saw the low tomorrow in DC is going to be 16F and the high 21F, I thought I should pass this along.

Does anyone have a very large set of phone metadata that is public?

Thinking rather than grinding over Enron’s stumbles, again, phone metadata could be hands-on training for a variety of careers. 😉

Looking forward to seeing videos of these presentations!

Why the Feds (U.S.) Need Topic Maps

Filed under: Data Mining,Project Management,Relevance,Text Mining — Patrick Durusau @ 7:29 pm

Earlier today I saw this offer to “license” technology for commercial development:

ORNL’s Piranha & Raptor Text Mining Technology

From the post:

UT-Battelle, LLC, acting under its Prime Contract No. DE-AC05-00OR22725 with the U.S. Department of Energy (DOE) for the management and operation of the Oak Ridge National Laboratory (ORNL), is seeking a commercialization partner for the Piranha/Raptor text mining technologies. The ORNL Technology Transfer Office will accept licensing applications through January 31, 2014.

ORNL’s Piranha and Raptor text mining technology solves the challenge most users face: finding a way to sift through large amounts of data that provide accurate and relevant information. This requires software that can quickly filter, relate, and show documents and relationships. Piranha is JavaScript search, analysis, storage, and retrieval software for uncertain, vague, or complex information retrieval from multiple sources such as the Internet. With the Piranha suite, researchers have pioneered an agent approach to text analysis that uses a large number of agents distributed over very large computer clusters. Piranha is faster than conventional software and provides the capability to cluster massive amounts of textual information relatively quickly due to the scalability of the agent architecture.

While computers can analyze massive amounts of data, the sheer volume of data makes the most promising approaches impractical. Piranha works on hundreds of raw data formats, and can process data extremely fast, on typical computers. The technology enables advanced textual analysis to be accomplished with unprecedented accuracy on very large and dynamic data. For data already acquired, this design allows discovery of new opportunities or new areas of concern. Piranha has been vetted in the scientific community as well as in a number of real-world applications.

The Raptor technology enables Piranha to run on SharePoint and MS SQL servers and can also operate as a filter for Piranha to make processing more efficient for larger volumes of text. The Raptor technology uses a set of documents as seed documents to recommend documents of interest from a large, target set of documents. The computer code provides results that show the recommended documents with the highest similarity to the seed documents.

Gee, that sounds so very hard. Using seed documents to recommend documents “…from a large, target set of documents.”?

Many ways to do that but just looking for “Latent Dirichlet Allocation” in “.gov” domains, my total is 14,000 “hits.”

If you were paying for search technology to be developed, how many times would you pay to develop the same technology?

Just curious.

In order to have a sensible development of technology process, the government needs a topic map to track its development efforts. Not only to track but prevent duplicate development.

Imagine if every web project had to develop its own httpd server, instead of the vast majority of them using Apache HTTPD.

With a common server base, a community has developed to maintain and extend that base product. That can’t happen where the same technology is contracted for over and over again.

Suggestions on what might be an incentive for the Feds to change their acquisition processes?

LXC 1.0: Blog post series [0/10]

Filed under: Linux OS,Programming,Virtualization — Patrick Durusau @ 5:47 pm

LXC 1.0: Blog post series [0/10] by Stéphane Graber.

From the post:

So it’s almost the end of the year, I’ve got about 10 days of vacation for the holidays and a bit of time on my hands.

Since I’ve been doing quite a bit of work on LXC lately in prevision for the LXC 1.0 release early next year, I thought that it’d be a good use of some of that extra time to blog about the current state of LXC.

As a result, I’m preparing a series of 10 blog posts covering what I think are some of the most exciting features of LXC. The planned structure is:

Stéphane has promised to update the links on post 0/10 so keep that page bookmarked.

Whether you use LXC in practice or not, this a good enough introduction for you to ask probing questions.

And you may gain some insight into the identity issues that virtualization can give rise to.

The Scalable Hyperlink Store

Filed under: Database,Graphs — Patrick Durusau @ 5:26 pm

The Scalable Hyperlink Store by Marc Najork.

Abstract:

This paper describes the Scalable Hyperlink Store, a distributed in-memory “database” for storing large portions of the web graph. SHS is an enabler for research on structural properties of the web graph as well as new link-based ranking algorithms. Previous work on specialized hyperlink databases focused on finding efficient compression algorithms for web graphs. By contrast, this work focuses on the systems issues of building such a database. Specifically, it describes how to build a hyperlink database that is fast, scalable, fault-tolerant, and incrementally updateable.

The design goals call for partitioning because:

…the maximum memory size on commodity machines is limited to a few tens of gigabytes….

So the paper is a bit dated but still instructive in terms of building a hyperlink store.

Consider this background to the notion of a hyperlink store that doesn’t offer a user transit to another site but could return the user the content pointed to by a hyperlink.

The Scalable Hyperlink Store at MS Research has more details and software.

TU Delft Spreadsheet Lab

Filed under: Business Intelligence,Data Mining,Spreadsheets — Patrick Durusau @ 5:07 pm

TU Delft Spreadsheet Lab

From the about page:

The Delft Spreadsheet Lab is part of the Software Engineering Research Group of the Delft University of Technology. The lab is headed by Arie van Deursen and Felienne Hermans. We work on diverse topics concerning spreadsheets, such as spreadsheet quality, design patterns testing and refactoring. Our current members are:

This project started last June so there isn’t a lot of content here, yet.

Still, I mention it as a hedge against the day that some CEO “discovers” all the BI locked up in spreadsheets that are scattered from one end of their enterprise to another.

Perhaps they will name it: Big Relevant Data, or some such.

Oh, did I mention that spreadsheets have no change tracking? Or means to document as part of the spreadsheet the semantics of it data or operations?

At some point those and other issues are going to become serious concerns, not to mention demands upon IT to do something, anything.

For IT to have a reasoned response to demands of “do something, anything,” a better understanding of spreadsheets is essential.

PS: Before all the Excel folks object that Excel does track changes, you might want to read: Track Changes in a Shared Workbook. As Obi-Wan Kenobi would say, “it’s true, Excel does track changes, from a certain point of view.” 😉

Clojure TV Channels

Filed under: Clojure,Functional Programming,Programming — Patrick Durusau @ 4:47 pm

Stuart Sierra mentions ClojureTV in Clojure 2013 Year in Review.

As of today, I could some eighty-one (81) videos.

Once you finish there, there are one hundred and eleven (111) waiting for you at: InfoQ Clojure presentations.

I just spot checked but I am not picking up duplicates between these two video sources.

Say potentially one hundred and ninety-two (192) Clojure videos between these two sites.

You don’t have to wait for the new seasons to start on cable TV. 😉

Open Census Data (UK)

Filed under: Census Data,Open Data — Patrick Durusau @ 4:12 pm

Open Census Data

From the post:

First off, congratulations to Jeni Tennison OBE and Keith Dugmore MBE on their gongs for services to Open Data. As we release our Census Data as Open Data it is worth remembering how ‘bad’ things were before Keith’s tireless campaign for Open Census data. Young data whippersnappers may not believe this, but when I first started working with Census data a corporate license for the ED boundaries (just the boundaries, no actual flippin’ data) was £80,000. In the late 90′s a simple census reporting tool in a GIS usually involved license fees of more than £250K. Today using QGIS, POSTGIS, opendata and a bit of imagination you could have such a thing for £0K license costs

Talking of Census data, we’ve released our full UK census data pack today as Open Data. You can access it here. http://www.geolytix.co.uk/geodata/census.

Good news on all fronts!

However, I am waiting for “open data” to trickle down to the drafts of agency budgets and details of purchases and other expenditures with the payees being identified.

With that data you could draw boundaries around the individuals and groups favored by an agency.

I don’t know what the results would be in the UK but I would wager considerable sums on the results if applied to in Washington, D.C.

You would find out where retirees from federal “service” go when they retire. (Hint, it’s not Florida.)

Needles in Stacks of Needles:…

Filed under: Bioinformatics,Biomedical,Genomics,Searching,Visualization — Patrick Durusau @ 3:33 pm

Needles in Stacks of Needles: genomics + data mining by Martin Krzywinski. (ICDM2012 Keynote)

Abstract:

In 2001, the first human genome sequence was published. Now, just over 10 years later, we capable of sequencing a genome in just a few days. Massive parallel sequencing projects now make it possible to study the cancers of thousands of individuals. New data mining approaches are required to robustly interrogate the data for causal relationships among the inherently noisy biology. How does one identify genetic changes that are specific and causal to a disease within the rich variation that is either natural or merely correlated? The problem is one of finding a needle in a stack of needles. I will provide a non-specialist introduction to data mining methods and challenges in genomics, with a focus on the role visualization plays in the exploration of the underlying data.

This page links to the slides Martin used in his presentation.

Excellent graphics and a number of amusing points, even without the presentation itself:

Cheap Data: A fruit fly that expresses high sensitivity to alcohol.

Kenny: A fruit fly without this gene dies in two days, named for the South Park character who dies in each episode.

Ken and Barbie: Fruit flys that fail to develop external genitalia.

One observation that rings true across disciplines:

Literature is still largely composed and published opaquely.

I searched for a video recording of the presentation but came up empty.

Need a Human

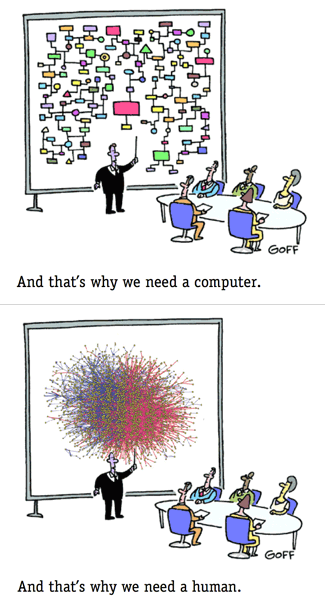
Filed under: Bioinformatics,Biomedical,Genomics — Patrick Durusau @ 11:38 am

Need a Human

Shamelessly stolen from Martin Krzywinski’s ICDM2012 Keynote — Needles in Stacks of Needles.

I am about to post on that keynote but thought the image merited a post of its own.

« Newer PostsOlder Posts »

Powered by WordPress