Another Word For It Patrick Durusau on Topic Maps and Semantic Diversity

January 28, 2014

Open Microscopy Environment

Filed under: Biology,Data,Image Processing,Microscopy — Patrick Durusau @ 5:23 pm

Open Microscopy Environment

From the webpage:

OME develops open-source software and data format standards for the storage and manipulation of biological microscopy data. It is a joint project between universities, research establishments, industry and the software development community.

Where you will find:

OMERO: OMERO is client-server software for visualization, management and analysis of biological microscope images.

Bio-Formats: Bio-Formats is a Java library for reading and writing biological image files. It can be used as an ImageJ plugin, Matlab toolbox, or in your own software.

OME-TIFF Format: A TIFF-based image format that includes the OME-XML standard.

OME Data Model: A common specification for storing details of microscope set-up and image acquisition.

More data formats for sharing of information. And for integration with other data.

Not only does data continue to expand but so does the semantics associated with it.

We have “big data” tools for the data per se. Have you seen any tools capable of managing the diverse semantics of “big data?”

Me neither.

I first saw this in a tweet by Paul Groth.

Visualization of Narrative Structure

Filed under: Graphics,Narrative,Visualization — Patrick Durusau @ 3:49 pm

Visualization of Narrative Structure. Created by Natalia Bilenko and Asako Miyakawa.

From the webpage:

Can books be summarized through their emotional trajectory and character relationships? Can a graphic representation of a book provide an at-a-glance impression and an invitation to explore the details?

We visualized character interactions and relative emotional content for three very different books: a haunting memory play, a metaphysical mood piece, and a children’s fantasy classic. A dynamic graph of character relationships displays the evolution of connections between characters throughout the book. Emotional strength and valence of each sentence are shown in a color-coded sentiment plot. Hovering over the sentence bars reveals the text of the original sentences. The emotional path of each character through the book can be traced by clicking on the character names in the graph. This highlights the corresponding sentences in the sentiment plot where that character appears. Click on the links below to see each visualization.

Best viewed in Google Chrome at 1280×800 resolution.

Visualizations of:

The Hobbit by J.R.R. Tolkien.

Kafka on the shore by Haruki Murakami.

The Glass Menagerie by Tennessee Williams.

Reading of any complex narrative would be enhanced by the techniques used here.

I first saw this in a tweet by Christophe Viau.

January 27, 2014

ProPublica Launches New Version of SecureDrop

Filed under: Cybersecurity,News,Reporting,Security — Patrick Durusau @ 9:45 pm

ProPublica Launches New Version of SecureDrop by Trevor Timm.

From the post:

Today, ProPublica became the first US news organization to launch the new 0.2.1 version of SecureDrop, our open-source whistleblower submission system journalism organizations can use to safely accept documents and information from sources.

ProPublica, an independent, not-for profit news outlet, is known for their hard-hitting journalism and has won several Pulitzer Prizes since its founding just five and a half years ago. ProPublica’s mission focuses on “producing journalism that shines a light on exploitation of the weak by the strong and on the failures of those with power to vindicate the trust placed in them.”

It’s exactly the type of journalism that we aim support at Freedom of the Press Foundation and we hope SecureDrop will help ProPublica further that mission.

Get your IT people to read this post and its references in detail.

Poor security is worse than no security at all. Poor security betrays the trust of those who relied on it.

…NFL’s ‘Play by Play’ Dataset

Filed under: Hadoop,MapReduce — Patrick Durusau @ 9:28 pm

Data Insights from the NFL’s ‘Play by Play’ Dataset by Jesse Anderson.

From the post:

In a recent GigaOM article, I shared insights from my analysis of the NFL’s Play by Play Dataset, which is a great metaphor for how enterprises can use big data to gain valuable insights into their own businesses. In this follow-up post, I will explain the methodology I used and offer advice for how to get started using Hadoop with your own data.

To see how my NFL data analysis was done, you can view and clone all of the source code for this project on my GitHub account. I am using Hadoop and its ecosystem for this processing. All of the data for this project uses the NFL 2002 season to the 4th week of the 2013 season.

Two MapReduce programs do the initial processing. These programs process the Play by Play data and parse out the play description. Each play has unstructured or handwritten data that describes what happened in the play. Using Regular Expressions, I figured out what type of play it was and what happened during the play. Was there a fumble, was it a run or was it a missed field goal? Those scenarios are all accounted for in the MapReduce program.

Just in case you aren’t interested in winning $1 billion at basketball or you just want to warm up for that challenge, try some NFL data on for size.

Could be useful in teaching you the limits of analysis. For all the stats that can be collected and crunched, games don’t always turn out as predicted.

On any given Monday morning you may win or lose a few dollars in the office betting pool, but number crunching is used for more important decisions as well.

Tutorial 1: Hello World… [Hadoop/Hive/Pig]

Filed under: Hadoop,Hive,Hortonworks,Pig — Patrick Durusau @ 9:17 pm

Tutorial 1: Hello World – An Overview of Hadoop with Hive and Pig

Don’t be frightened!

The tutorial really doesn’t use big data tools to quickly say “Hello World” or to even say it quickly, many times. 😉

One of the clearer tutorials on big data tools.

You won’t quite be dangerous by the time you finish this tutorial but you should have a strong enough taste of the tools to want more.

Enjoy!

MetaModel

Filed under: Database,MetaModel — Patrick Durusau @ 9:10 pm

MetaModel

From the Metamodel Wiki:

MetaModel is a library that encapsulates the differences and enhances the capabilities of different datastores. Rich querying abilities are offered to datastores that do not otherwise support advanced querying and a unified view of the datastore structure is offered through a single model of the schemas, tables, columns and relationships.

Also from the MetaModel Wiki, supported data formats:

Relational databases known to be working with MetaModel

Database Version JDBC driver
MySQL 5+ Connector/J
PostgreSQL 8+ PostgreSQL JDBC driver
Oracle 10g SQLJ/JDBC
Apache Derby 10+ Derby driver
Firebird SQL 2.0+ Jaybird driver
Hsqldb/HyperSQL 1.8+ Hsqldb driver
H2 1.2+ H2 driver
SQLite 3.6.0+ Xerial driver
Microsoft SQL Server 2005+ JTDS driver
Ingres

Ingres JDBC driver

Non-relational / NoSQL databases supported by MetaModel

  • MongoDB
  • CouchDB

Business application supported (through system services) by MetaModel

  • Salesforce.com
  • SugarCRM

File data formats supported by MetaModel

File format File extension Version
Comma separated file .csv
Microsoft Excel spreadsheet .xls Excel ’97-2003
. .xlsx Excel 2007+
OpenOffice.org database .odb OpenOffice 2.0+
XML file (SAX based) .xml
XML file (DOM based) .xml
Microsoft Access database .mdb Access ’97-2003
. .accdb Access 2007+
dBase database .dbf

Java object datastores (aka POJO datastores)

MetaModel also supports creating datastores built on top of plain Java objects. Either by using a collection of Java bean objects (with getters and setters) or by using collections of Maps or arrays. In the case of using collections of arrays, you will need to manually appoint column names to each index in the arrays.

Composite datastores

MetaModel supports an advanced feature called composite datastores. In short it means that it’s possible to access and query several datastores as if they where one. This involves transparent client-side joining, filtering, grouping etc. Composite datastores are typically not as performant in terms of querying but provides for a convenient way to combine data that is otherwise inherently separated from each other.

That’s an impressive list but who have they missed?

  • AllegroGraph
  • HBase
  • Hive
  • Neo4j
  • OrientDB

Just as a starter list. How many more can you name?

The Sonification Handbook

Filed under: BigData,Data Mining,Music,Sonification,Sound — Patrick Durusau @ 5:26 pm

The Sonification Handbook. Edited by Thomas Hermann, Andy Hunt, John G. Neuhoff. (Logos Publishing House, Berlin 2011, 586 pages, 1. edition (11/2011) ISBN 978-3-8325-2819-5)

Summary:

This book is a comprehensive introductory presentation of the key research areas in the interdisciplinary fields of sonification and auditory display. Chapters are written by leading experts, providing a wide-range coverage of the central issues, and can be read from start to finish, or dipped into as required (like a smorgasbord menu).

Sonification conveys information by using non-speech sounds. To listen to data as sound and noise can be a surprising new experience with diverse applications ranging from novel interfaces for visually impaired people to data analysis problems in many scientific fields.

This book gives a solid introduction to the field of auditory display, the techniques for sonification, suitable technologies for developing sonification algorithms, and the most promising application areas. The book is accompanied by the online repository of sound examples.

The text has this advice for readers:

The Sonification Handbook is intended to be a resource for lectures, a textbook, a reference, and an inspiring book. One important objective was to enable a highly vivid experience for the reader, by interleaving as many sound examples and interaction videos as possible. We strongly recommend making use of these media. A text on auditory display without listening to the sounds would resemble a book on visualization without any pictures. When reading the pdf on screen, the sound example names link directly to the corresponding website at http://sonification.de/handbook. The margin symbol is also an active link to the chapter’s main page with supplementary material. Readers of the printed book are asked to check this website manually.

Did I mention the entire text, all 586 pages, can be downloaded for free?

Here’s an interesting idea: What if you had several dozen workers listening to sonofied versions of the same data stream, listening along different dimensions for changes in pitch or tone? When heard, each user signals the change. When some N of the dimensions all have a change at the same time, the data set is pulled at that point for further investigation.

I will regret suggesting that idea. Someone from a leading patent holder will boilerplate an application together tomorrow and file it with the patent office. 😉

NASA’s Voyager Data Is Now a Musical

Filed under: Music,Sonification,Sound — Patrick Durusau @ 5:01 pm

NASA’s Voyager Data Is Now a Musical by Victoria Turk.

From the post:

You might think that big data would sound like so many binary beeps, but a project manager at Géant in the UK has turned 320,000 measurements from NASA Voyager equipment into a classically-inspired track. The company describes it as “an up-tempo string and piano orchestral piece.”

Domenico Vicinanza, who is a trained musician as well as a physicist, took measurements from the cosmic ray detectors on Voyager 1 and Voyager 2 at hour intervals, and converted it into two melodies. The result is a duet: the data sets from the two spacecraft play off each other throughout to create a rather charming harmony. …

Data sonification, the technique of representing data points with sound, makes it easier to spot trends, peaks, patterns, and anomalies in a huge data set without having to pore over the numbers.

Some data sonification resources:

audiolyzR: Data sonification with R

Georgia Tech Sonification Lab

Sonification Sandbox

Sonification.de

I suspect that sonification is a much better way to review monotonous data for any unusual entries.

My noticing an OMB calculation that multiplied a budget item by zero (0) and produced a larger number, was just chance. Had math operations been set to music, I am sure that would have struck a discordant note!

Human eyesight is superior to computers for galaxy classification.

Human hearing as superior way to explore massive datasets is a promising avenue of research.

Overview-Server – Developer Install

Filed under: News,Reporting — Patrick Durusau @ 4:31 pm

Setting up a development Environment

The Overview project has posted a four (4) step process to setup an Overview development environment (Github):

  1. Install PostgreSQL, a Java Development Kit and Git.
  2. git clone https://github.com/overview/overview-server.git
  3. cd overview-server
  4. ./run

That last command will take a long time — maybe an hour as it downloads and compiles all required components. It will be clear when it’s ready.

Overview lowers the bar for swimming in a sea of documents. Not quite big data style oceans of documents but goodly sized seas of documents.

Documents that are delivered in a multitude of formats, usually as inconveniently as possible.

The hope being too many documents for timely/economical review will break any requester before they find embarrassing data.

I prefer to disappoint that hope.

Don’t you?

January 26, 2014

EVEX

Filed under: Bioinformatics,Biomedical,Genomics — Patrick Durusau @ 8:25 pm

EVEX

From the about page:

EVEX is a text mining resource built on top of PubMed abstracts and PubMed Central full text articles. It contains over 40 million bio-molecular events among more than 76 million automatically extracted gene/protein name mentions. The text mining data further has been enriched with gene identifiers and gene families from Ensembl and HomoloGene, providing homology-based event generalizations. EVEX presents both direct and indirect associations between genes and proteins, enabling explorative browsing of relevant literature.

Ok, it’s not web-scale but it is important information. 😉

What I find the most interesting is the “…direct and indirect associations between genes and proteins, enabling explorative browsing of the relevant literature.”

See their tutorial on direct and indirect associations.

I think part of the lesson here is that no matter how gifted, a topic map with static associations limits a user’s ability to explore the infoverse.

That may work quite well where uniform advice, even if incorrect, is preferred over exploration. However, in rapidly changing areas like medical research, static associations could be more of a hindrance than a boon.

…a quantified-self, semantic-analysis tool to track web browsing

Filed under: Information Sharing,News,Reporting — Patrick Durusau @ 8:17 pm

The New York Times’ R&D Lab is building a quantified-self, semantic-analysis tool to track web browsing

From the post:

Let’s say you work in a modern digital newsroom. Your colleagues are looking at interesting stuff online all day long — reading stimulating news stories, searching down rabbit holes you’ve never thought of. There are probably connections between what the reporter five desks down from you is looking for and what you already know — or vice versa. Wouldn’t it be useful if you could somehow gather up that all that knowledge-questing and turn it into a kind of intraoffice intel?

A version of that vision is what Noah Feehan and others in The New York Times’ R&D Lab is working on with a new system called Curriculum. It started as an in-house browser extension he and Jer Thorp built last year called Semex, which monitored your browsing and, by semantically analyzing the web pages you visit, rendered it as a series of themes.

…if Semex was most useful to me as a way to record my cognitive context, the state in which I left a problem, maybe I could share that state with other people who might need to know it. Sharing topics from my browsing history with a close group of colleagues can afford us insight into one another’s processes, yet is abstracted enough (and constrained to a trusted group) to not feel too invasive…

Each user in a group has a Chrome extension that submits pageviews to a server to perform semantic analysis and publish a private, authenticated feed. (I should note here that the extension ignores any pages using HTTPS, to avoid analyzing emails, bank statements, and other secure pages.) Curriculum is carefully designed to be anonymous; that is, no topic in the feed can be traced back to any one particular user. The anonymity isn’t perfect, of course: because there are only five people using it, and because we five are in very close communication with each other, it is usually not too difficult to figure out who might be researching a particular topic.

Curriculum is kind of like a Fitbit for context, an effortless way to record what’s on our minds throughout the day and make it available to the people who need it most: the people we work with. The function Curriculum performs, that of semantic listening, is fantastically useful when people need to share their contexts (what they were working on, what approaches they were investigating, what problems they’re facing) with each other.

The Curriculum feed is truly a new channel of input for us, a stream of information of a different character than we’ve encountered before. Having access to the residue of our collective web travels has led to many questions, conversations, and jokes that wouldn’t have happened without it. (emphasis added)

Are you ready for real information sharing?

I was rather surprised that anyone in a newsroom would be that sensitive about their browsing history. I would stream mine to the Net if I thought anyone were interested. You might be offended by what you find, but that’s not my problem. 😉

I do know of rumored intelligence service projects that never got off the ground because of information sharing concerns. As well as one state legislature that decided it liked to talk about transparency more than it enjoyed practicing it.

While we call for tearing down data silos (those of others) are we anxious to keep our own personal data silos in place?

Pricing “The Internet of Everything”

Filed under: Transparency,WWW — Patrick Durusau @ 8:11 pm

I was reading Embracing the Internet of Everything To Capture Your Share of $14.4 Trillion by Joseph Bradley, Joel Barbier, and Doug Handler, when I realized their projected Value at Stake of $14.4 trillion left out an important number. The price for an Internet of Everything.

Prices are usually calculated by the product price multiplied by the quantity of the product. Let’s start there to evaluate Cisco’s pricing.

In How Many Things Are Currently Connected To The “Internet of Things” (IoT)?, appearing in Forbes, Rob Soderberry, Cisco Executive, said that:

the number of connected devices reached 8.7 billion in 2012.

The Internet of Everything (IoE) paper projects 50 billion “things” being connected by 2020.

Roughly that’s 41.3 billion more connections than exist at present.

Let’s take some liberties with Cisco’s numbers. Assume the networking in each device, leaving aside the cost of a new device with networking capability, is $10. So $10 times 41.3 billion connections = $410.3 billion. The projected ROI just dropped from $14.4 trillion to $14 trillion.

Let’s further assume that Internet connectivity has radically dropped in price and so it only $10 per month. For our additional 41.3 billion devices, $10 times 41.3 billion things times 12 or $4.130 trillion per year. The projected ROI just dropped to $10 trillion.

I say the ROI “dropped,” but that’s not really true. Someone is getting paid for Internet access, the infrastructure to support it, etc. Can you spell “C-i-s-c-o?”

In terms of complexity, consider Mark Zuckerberg’s (Facebook founder) Internet.org, which is working with Ericsson, MediaTek, Nokia, Opera, Qualcomm, and Samsung:

to help bring web access to the five billion people who are not yet connected. (From: Mark Zuckerberg launches Internet.org to help bring web access to the whole world by Mark Wilson.)

A coalition of major players working on connecting 5 billion people versus Cisco’s hand waving about connecting 50 billion “things.”

That’s not a cost estimate but it does illustrate the enormity of the problem of creating the IoE.

But the cost of the proposed IoE isn’t just connecting to the Internet.

For commercial ground vehicles the Cisco report says:

As vehicles become more connected with their environment (road, signals, toll booths, other vehicles, air quality reports, inventory systems), efficiencies and safety greatly increase. For example, the driver of a vending-machine truck will be able to look at a panel on the dashboard to see exactly which locations need to be replenished. This scenario saves time and reduces costs.

Just taking roads and signals, do you know how much is spent on highway and street construction in the United States every month?

Would you believe it averages between $77 billion and 83+ billion a month? US Highway and Street Construction Spending:
82.09B USD for Nov 2013

And the current state of road infrastructures in the United States?

Forty-two percent of America’s major urban highways remain congested, costing the economy an estimated $101 billion in wasted time and fuel annually. While the conditions have improved in the near term, and Federal, state, and local capital investments increased to $91 billion annually, that level of investment is insufficient and still projected to result in a decline in conditions and performance in the long term. Currently, the Federal Highway Administration estimates that $170 billion in capital investment would be needed on an annual basis to significantly improve conditions and performance. (2013 Report Card: Roads D+. For more infrastructure reports see: 2013 Report Card )

I read that to say an estimated $170 billion is needed annually just to improve current roads. Yes?

That doesn’t include the costs of Internet infrastructure, the delivery vehicle, other vehicles, inventory systems, etc.

I am certain that however and whenever the Internet of Things comes into being, Cisco, as part of the core infrastructure now, will prosper. I can see Cisco’s ROI from the IoE.

What I don’t see is the ROI for the public or private sector, even assuming the Cisco numbers are spot on.

Why? Because there is no price tag for the infrastructure to make the IoE a reality. Someone, maybe a lot of someones, will be paying that cost.

If you encounter costs estimates sufficient for players in the public or private sectors to make their own ROI calculations, please point them out. Thanks!

PS: A future Internet more to my taste would have tagged Cisco’s article with “speculation,” “no cost data,” etc. as aids for unwary readers.

PPS: Apologies for only U.S. cost figures. Other countries will have similar issues but I am not as familiar with where to find their infrastructure data.
Storing and querying RDF in Neo4j

Filed under: Graphs,Neo4j,RDF,SPARQL — Patrick Durusau @ 8:07 pm

Storing and querying RDF in Neo4j by Bob DuCharme.

From the post:

In the typical classification of NoSQL databases, the “graph” category is one that was not covered in the “NoSQL Databases for RDF: An Empirical Evaluation” paper that I described in my last blog entry. (Several were “column-oriented” databases, which I always thought sounded like triple stores—the “table” part of they way people describe these always sounded to me like a stretched metaphor designed to appeal to relational database developers.) A triplestore is a graph database, and Brazilian software developer Paulo Roberto Costa Leite has developed a SPARQL plugin for Neo4j, the most popular of the NoSQL graph databases. This gave me enough incentive to install Neo4j and play with it and the SPARQL plugin.

As Bob points out, the plugin isn’t ready for prime time but I mention it in case you are interested in yet another storage solution for RDF.

January 25, 2014

12 Free eBooks on Scala

Filed under: Books,Programming,Scala,Scalability — Patrick Durusau @ 8:27 pm

12 Free eBooks on Scala by Atithya Amaresh.

If you are missing any of these, now is the time to grab a copy:

  1. Functional Programming in Scala
  2. Play for Scala
  3. Scala Cookbook
  4. Lift Cookbook
  5. Scala in Action
  6. Testing in Scala
  7. Programming Scala by Venkat Subramaniam
  8. Programming Scala by Dean Wampler, Alex Payne
  9. Software Performance and Scalability
  10. Scalability Rules
  11. Lift in Action
  12. Scala in Depth

Enjoy!

Graph Databases – 250% Spike in Popularity – Really?

Filed under: Graph Databases,SQL — Patrick Durusau @ 8:15 pm

I prefer graph databases for a number of reasons but the rhetoric about them has gotten completely out of hand.

The most recent Internet rumor is that graph database had a 250% spike in popularity.

Really?

Care to guess how that “measurement” was taken? It was more intellectually honest than Office of Management and Budget‘s sequestration numbers, but only just.

Here are the parameters for the 250% increase:

  • Number of mentions of the system on websites, measured as number of results in search engines queries. At the moment, we use Google and Bing for this measurement. In order to count only relevant results, we are searching for “ database”, e.g. “Oracle database”.
  • General interest in the system. For this measurement, we use the frequency of searches in Google Trends.
  • Frequency of technical discussions about the system. We use the number of related questions and the number of interested users on the well-known IT-related Q&A sites Stack Overflow and DBA Stack Exchange.
  • Number of job offers, in which the system is mentioned. We use the number of offers on the leading job search engines Indeed and Simply Hired.
  • Number of profiles in professional networks, in which the system is mentioned. We use the internationally most popular professional network LinkedIn.

We calculate the popularity value of a system by standardizing and averaging of the individual parameters. These mathematical transformations are made in a way ​​so that the distance of the individual systems is preserved. That means, when system A has twice as large a value in the DB-Engines Ranking as system B, then it is twice as popular when averaged over the individual evaluation criteria.

The DB-Engines Ranking does not measure the number of installations of the systems, or their use within IT systems. It can be expected, that an increase of the popularity of a system as measured by the DB-Engines Ranking (e.g. in discussions or job offers) precedes a corresponding broad use of the system by a certain time factor. Because of this, the DB-Engines Ranking can act as an early indicator. (emphasis added) (Source: DB-Engines)

So, this 250% increase in popularity is like a high school cheerleader election. Yes?

Oracle, may have signed several nation level contracts in the past year but are outdistanced in the rankings by twitter traffic?

Not what I would call reliable intelligence.

PS: the rumor apparently originates with: Tables turning? Graph databases see 250% spike in popularity by Lucy Carey.

Personally I can’t see how Lucy got 250% out of the reported numbers. There is a story about repeating something so often that it is believed. Do you remember it?

Use Cases for Taming Text, 2nd ed.

Filed under: Lucene,Mahout,MALLET,OpenNLP,Solr,Stanford NLP — Patrick Durusau @ 5:31 pm

Use Cases for Taming Text, 2nd ed. by Grant Ingersoll.

From the post:

Drew Farris, Tom Morton and I are currently working on the 2nd Edition of Taming Text (http://www.manning.com/ingersoll for first ed.) and are soliciting interested parties who would be willing to contribute to a chapter on practical use cases (i.e. you have something in production and are willing to write about it) for search with Solr, NLP using OpenNLP or Stanford NLP and machine learning using Mahout, OpenNLP or MALLET — ideally you are using combinations of 2 or more of these to solve your problems. We are especially interested in large scale use cases in eCommerce, Advertising, social media analytics, fraud, etc.

The writing process is fairly straightforward. A section roughly equates to somewhere between 3 – 10 pages, including diagrams/pictures. After writing, there will be some feedback from editors and us, but otherwise the process is fairly simple.

In order to participate, you must have permission from your company to write on the topic. You would not need to divulge any proprietary information, but we would want enough information for our readers to gain a high-level understanding of your use case. In exchange for your participation, you will have your name and company published on that section of the book as well as in the acknowledgments section. If you have a copy of Lucene in Action or Mahout In Action, it would be similar to the use case sections in those books.

Cool!

I am guessing the second edition isn’t going to take as long as the first. 😉

Couldn’t be in better company as far as co-authors.

See the post for the contact details.

Flax UKMP

Filed under: Government,Politics,Tweets — Patrick Durusau @ 5:24 pm

Flax UKMP

From the about page:

Welcome to the Flax UKMP application, providing search and analysis of tweets posted by UK members of Parliament.

This application started life during a hackday organised by Flax for the Enterprise Search Meetup for Cambridge in the UK. During the day, the participants split into groups working on a number of different activities, two of them using a sample of Twitter data from members of the UK Parliament’s House of Commons. By the end of the day, both groups had small web applications available which used the data in slightly different ways. Both of those applications have been used in the construction of this site.

The content is gathered from four Twitter lists: one for each of the Conservative, Labour and Liberal Democrat parties, and a further list for the smaller parties. We extract the relevant data, and use the Stanford NLP software to extract entities (organisations, people and locations) mentioned in the tweet, and feed the tweets into a Solr search engine. The tweets are then made available to view, filter and search on the Browse page.

The source code is available in the Flax github repository. Do let us know what you think.

I don’t think programmers are in danger from projects like this one, primarily because they work with the “data” and don’t necessarily ingest a lot of it.

Readers, testers on the other hand, I fear that in sufficient quantities, tweets from politicians could make the average reader dumber by the minute.

As a safety precaution, particularly in the United States, have multiple copies of Shakespeare and Dante about, just in case anyone’s mind seizes while reading such drivel.

Readers should also be cautioned to wait at least 10 to 15 minutes for they attempt to operate a motor vehicle. 😉

Searching in Solr, Analyzing Results and CJK

Filed under: CJK,Lucene,Solr — Patrick Durusau @ 5:08 pm

Searching in Solr, Analyzing Results and CJK

From the post:

In my recently completed twelve post series on Chinese, Japanese and Korean (CJK) with Solr for Libraries, my primary objective was to make information available to others in an expeditious manner. However, the organization of the topics is far from optimal for readers, and the series is too long for easy skimming for topics of interest. Therefore, I am providing this post as a sort of table of contents into the previous series.
Introduction

In Fall 2013, we rolled out some significant improvements for Chinese, Japanese and Korean (CJK) resource discovery in SearchWorks, the Stanford library “catalog” built with Blacklight on top of our Solr index. If your collection has a significant number of CJK resources and they are in multiple languages, you might be interested in our recipes. You might also be interested if you have a significant number of resources in multiple languages, period.

If you are interested in improving searching, or in improving your methodology when working on searching, these posts provide a great deal of information. Analysis of Solr result relevancy figured heavily in this work, as did testing: relevancy/acceptance/regression testing against a live Solr index, unit testing, and integration testing. In addition, there was testing by humans, which was well managed and produced searches that were turned into automated tests. Many of the blog entries contain useful approaches for debugging Solr relevancy and for test driven development (TDD) of new search behavior.
….

Excellent!

I am sure many of the issues addressed here will be relevant should anyone decide to create a Solr index to the Assyrian Dictionary of the Oriental Institute of the University of Chicago (CAD).

Quite serious. At least I would be interested at any rate.

WorldWide Telescope Upgrade!

Filed under: Astroinformatics,Microsoft — Patrick Durusau @ 4:56 pm

A notice about the latest version was forwarded to me and it read in part:

WorldWide Telescope is celebrating its 5th anniversary with a new release that has a completely re-written rendering engine that supports DirectX11 and runs in 64bit to give you the a wealth of new features including cinematic quality rendering and new timeline tours that allow channel by channel key frames for precise control, loads of new overlays and much more.

We also have a completely new website for this release with a responsive design for our modern mix of devices. Please use it and give use feedback. We will be adding lots of new content, including many new web interactive pages using our HTML5 control so that people with any device can enjoy our data even without the full Windows Client.

All of which sounds great and kudos to Microsoft.

Unfortunately I can’t view the upgraded site because I am running (on a VM) a version of Windows prior to Windows 7 and Windows 8. My, where does the time go. 😉

I have plenty of room for another VM so I guess it is time to spin another one up.

If you are already on Windows 7 or 8, check out the new site. If not, look for the legacy version until you can upgrade!

How to use Overview to analyze social media posts

Filed under: News,Reporting — Patrick Durusau @ 3:57 pm

How to use Overview to analyze social media posts by Jonathan Stray.

From the post:

Even when 10,000 people post about the same topic, they’re not saying 10,000 different things. People talking about an event will focus on different aspects of it, or have different reactions, but many people will be saying pretty much the same thing. People posting about a product might be talking about one or another of its features, the price, their experience using it, or how it compares to competitors. Citizens of a city might be concerned about many different things, but which things are the most important? Overview’s document sorting system groups similar posts so you can find these conversations quickly, and figure out how many people are saying what.

This post explains how to use Overview to quickly figure out what the different “conversations” are, how many people are involved in each, and how they overlap.

I wondered at first about Jonathan mentioning Radian 6, Sysomos, and Datasift as tools to harvest social media data.

After thinking about it, I realized that all of these tools can capture content from a variety of social media feeds.

Suggestions of open source alternatives that can harvest from multiple social media feeds? Particularly with export capabilities.

Thanks!

Exporting GraphML from Neo4j

Filed under: GraphML,Graphs,Neo4j — Patrick Durusau @ 3:09 pm

I created a graph database in Neo4j 2.0 directly from a Twitter stream. To get better display capabilities, I wanted to export the database for loading into Gephi using neo4j-shell-tools.

Well, the export did create an XML file. Unfortunately, not a “well-formed” one. 🙁

The first error was that the “&” character was not written with an entity. The “&” characters were in the Twitter text stream but should have been replaced upon export as XML. Michael Hunger responded quite quickly with a revision to neo4j-shell-tools to get me past that issue. (The new version also replaces < and > in the text flow. Be careful if you have markup inside processing instructions stored in a Neo4j database. Admittedly an edge case.)

A problem that remains unresolved is that the Graphml export file has a UTF-8 declaration but in fact contains high ASCII characters.

Here are four examples that are part of what I posted to the Neo4j mailing list. Each example is preceded by an XML comment about the improper character at that node.

<code><!– Node n16, see “non SGML character number 128_” immediately following “BBSeedfund”
<node id=”n16″ labels=”User” > @SBSSeedfund • Looking into …</data></node>
<!– Node n26 – “ÜT” non SGML character number 156 – special ASCII character –>
<node id=”n26″ labels=”User” ><data key=”labels”>…<data key=”location”>ÜT: 51.450038,6.802151</data>…</node>
<!– Node n35 – ≠ non SGML character number 137 –>
<node id=”n35″ labels=”User” >… RT ≠ endorsement</data>…</node>
<!– Node n58 – ™ non SGML character number 132 –>
<node id=”n58″ labels=”User” >CONFERENCE™ is the …</data></node>
</code>

One solution is to parse the file in an XML editor and with save/replace to eliminate the offending characters.

A better solution is to grab a copy of HTML Tidy for HTML5 (experimental) and use it to eliminate the high ASCII characters.

HTML Tidy converts high ASCII into entities so you will have some odd looking display text.

I used a config.txt file with the following settings:

input-encoding: ascii
output-xml: yes
input-xml: yes
show-warnings: yes
numeric-entities: yes

I set input-encoding: ascii because the UTF-8 encoding declaration from Neo4j isn’t correct. And with that setting, HTML Tidy automatically replaces high ASCII with entities.

Made the file acceptable to Gephi.

While I understand Neo4j being liberal in terms of what it accepts for input, it needs to work on exporting well-formed XML.

Using Neo4J for Website Analytics

Filed under: Graphs,Modeling,Neo4j,Web Analytics — Patrick Durusau @ 2:23 pm

Using Neo4J for Website Analytics by Francesco Gallarotti.

From the post:

Working at the office customizing and installing different content management systems (CMS) for some of our clients, I have seen different ways of tracking users and then using the collected data to:

  1. generate analytics reports
  2. personalize content

I am not talking about simple Google Analytics data. I am referring to ways to map users into predefined personas and then modify the content of the site based on what that persona is interested into.

Interesting discussion of tracking users for web analytics with a graph database.

Not NSA grade tracking because users are collapsed into predefined personas. Personas limit the granularity of your tracking.

On the other hand, if that is all the granularity that is required, personas allow you to avoid a lot of “merge” statements that test for the prior existence of a user in the graph.

Depending on the circumstances, I would create new nodes for each visit by a user, reasoning it is quicker to stream the data and later combine for specific users, if desired. Defining “personas” on the fly from the pages visited and ignoring the individual users.

Thinking I can always ignore granularity I don’t need but once lost, granularity is forever lost.

How Many Years a Slave?

Filed under: Data Analysis,Data Integration,Palantir — Patrick Durusau @ 10:51 am

How Many Years a Slave? by Karin Knox.

From the post:

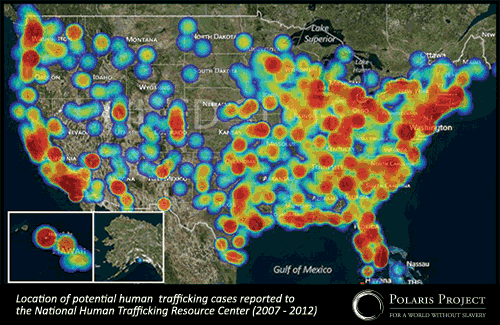
Each year, human traffickers reap an estimated $32 billion in profits from the enslavement of 21 million people worldwide. And yet, for most of us, modern slavery remains invisible. Its victims, many of them living in the shadows of our own communities, pass by unnoticed. Polaris Project, which has been working to end modern slavery for over a decade, recently released a report on trafficking trends in the U.S. that draws on five years of its data. The conclusion? Modern slavery is rampant in our communities.

slavery in US

January is National Slavery and Human Trafficking Prevention Month, and President Obama has called upon “businesses, national and community organizations, faith-based groups, families, and all Americans to recognize the vital role we can play in ending all forms of slavery.” The Polaris Project report, Human Trafficking Trends in the United States, reveals insights into how anti-trafficking organizations can fight back against this global tragedy.

….

Bradley Myles, CEO of the Polaris Project, makes a compelling case for data analysis in the fight against human trafficking. The post has an interview with Bradley and a presentation he made as part of the Palantir Night Live series.

Using Palantir software, the Polaris Project is able to rapidly connect survivors with responders across the United States. Their use of the data analytics aspect of the software is also allowing the project to find common patterns and connections.

The Polaris Project is using modern technology to recreate a modern underground railroad but at the same time, appears to be building a modern data silo as well. Or as Bradley puts it in his Palantir presentation, every report is “…one more data point that we have….”

I’m sure that’s true and helpful, to a degree. But going beyond the survivors of human trafficking, to reach the sources of human trafficking, will require the integration of data sets across many domains and languages.

Police sex crime units have data points, federal (U.S.) prosecutors have data points, social welfare agencies have data points, foreign governments and NGOs have data points, all related to human trafficking. I don’t think anyone believes a uniform solution is possible across all those domains and interests.

One way to solve that data integration problem is to disregard data points from anyone unable or unwilling to use some declared common solution or format. I don’t recommend that one.

Another way to attempt to solve the data integration problem is to have endless meetings to derive a common format, while human trafficking continues unhindered by data integration. I don’t recommend that approach either.

What I would recommend is creating maps between data systems, declaring and identifying the implicit subjects that support those mappings, so that disparate data systems can both export and import shared data across systems. Imports and exports that are robust, verifiable and maintainable.

Topic maps anyone?

January 24, 2014

Clojure In Small Pieces

Filed under: Clojure,Programming — Patrick Durusau @ 7:04 pm

Clojure In Small Pieces by Timothy Daly (editor)

From the Foreword:

Rich Hickey invented Clojure. This is a fork of the project to experiment with literate programming as a development and documentation technology.

Every effort is made to give credit for any and all contributions.

Clojure is a break with the past traditions of Lisp. This literate fork is a break with the past traditions of code development. As such it is intended as an experiment, not a replacement or competition with the official version of Clojure.

Most programmers are still locked into the idea of making a program out of a large pile of tiny files containing pieces of programs. They do not realize that this organization was forced by the fact that machines like the PDP 11 only had 8k of memory and a limit of 4k buffers in the editor. Thus there was a lot of machinery built up, such as overlay linkers, to try to reconstruct the whole program.

The time has come to move into a more rational means of creating and maintaining programs. Knuth suggested we write programs like we write literature, with the idea that we are trying to communicate the ideas to other people. The fact that the machine can also run the programs is a useful side-effect but not important.

Very few people have seen a literate program so this is intended as a complete working example, published in book form. The intent is that you can sit and read this book like any other novel. At the end of it you will be familiar with the ideas and how those ideas are actually expressed in the code.

If programmers can read it and understand it then they can maintain and modify it. The ideas will have been communicated. The code will be changed to match changes in the idea. We will all benefit.

I’ve tried to make it as simple as possible. Try it once, you might like it.

Well, with 1,801 pages, I’m just glad the next Game of Thrones novel is some time off in the future. 😉

This version is dated November 14, 2013.

It’s not Clojure in 140 characters or in 30 seconds but if you learn a language that way, you have 140 characters and/or 30 seconds of understanding.

I suspect working through this text will slow the reader down enough to appreciate Clojure as a language.

It will take a while before I know. 😉 The northern side of 600 pages of different drafts are due to be reviewed by this time next month.

While I find time to read Clojure in Small Pieces, enjoy!

Biodiversity Information Serving Our Nation (BISON)

Filed under: Biodiversity,Data — Patrick Durusau @ 6:41 pm

Biodiversity Information Serving Our Nation (BISON)

From the about tab:

Researchers collect species occurrence data, records of an organism at a particular time in a particular place, as a primary or ancillary function of many biological field investigations. Presently, these data reside in numerous distributed systems and formats (including publications) and are consequently not being used to their full potential. As a step toward addressing this challenge, the Core Science Analytics and Synthesis (CSAS) program of the US Geological Survey (USGS) is developing Biodiversity Information Serving Our Nation (BISON), an integrated and permanent resource for biological occurrence data from the United States.

BISON will leverage the accumulated human and infrastructural resources of the long-term USGS investment in research and information management and delivery.

If that sounds impressive, consider the BISON statistics as of December 31, 2013:

Total Records: 126,357,352
Georeferenced: 120,394,780
Taxa: 315,663
Data Providers: 307

Searches are by scientific or common name and ITIS enabled searching is on by default. Just in case you are curious:

BISON has integrated taxonomic information provided by the Integrated Taxonomic Information System (ITIS) allowing advanced search capability in BISON. With the integration, BISON users have the ability to search more completely across species records. Searches can now include all synonyms and can be conducted hierarchically by genera and higher taxa levels using ITIS enabled queries. Binding taxonomic structure to search terms will make possible broad searches on species groups such as Salmonidae (salmon, trout, char) or Passeriformes (cardinals, tanagers, etc) as well as on all of the many synonyms and included taxa (there are 60 for Poa pratensis – Kentucky Bluegrass – alone).

Clue: With sixty (60) names, the breakfast of champions since 1875.

I wonder if Watson would have answered: “What is Kentucky Bluegrass?” on Jeopardy. The first Kentucky Derby was run on May 17, 1875.

BISON also offers developer tools and BISON Web Services.

Anonymous Authoring of Topic Maps?

Filed under: Authoring Topic Maps — Patrick Durusau @ 1:54 pm

Arthur D. Santana documents in Virtuous or Vitriolic: The effect of anonymity on civility in online newspaper reader comment boards that anonymity have given online discussion boards their chief characteristic, “rampant incivility.”

Abstract:

In an effort to encourage community dialogue while also building reader loyalty, online newspapers have offered a way for readers to become engaged in the news process, most popularly with online reader comment boards. It is here that readers post their opinion following an online news story, and however much community interaction taking place therein, one thing appears evident: sometimes the comments are civil; sometimes they are not. Indeed, one of the chief defining characteristics of these boards has become the rampant incivility—a dilemma many newspapers have struggled with as they seek to strengthen the value of the online dialogue. Many journalists and industry observers have pointed to a seemingly straightforward reason for the offensive comments: anonymity. Despite the claim, however, there is a striking dearth of empirical evidence in the academic literature of the effect that anonymity has on commenters’ behavior. This research offers an examination of user comments of newspapers that allow anonymity (N=450) and the user comments of newspapers that do not (N=450) and compares the level of civility in both. In each group, comments follow news stories on immigration, a topic prevalent in the news in recent years and which is especially controversial and prone to debate. Results of this quantitative content analysis, useful for journalism practitioners and scholars, provide empirical evidence of the effect that anonymity has on the civility of user comments.

I haven’t surveyed the academic literature specific to online newspaper forums but it is a common experience that shouting from a crowd is one thing. Standing separate and apart as an individual is quite another.

There is a long history of semi-anonymous flame wars conducted in forums and email lists, so the author’s conclusions come as no surprise.

Despite being “old news,” I do think the article raises the question of whether you want to allow anonymous authoring in an shared topic map environment?

Assuming that authors cannot specify merges that damage the ability of the map to function, would you allow anonymous authoring in a shared topic map?

I say “shared” topic map rather than “online” because topic map environments exist separate from any public facing network or even any network at all but what’s critical here is with multiple authors, should any of them be able to be anonymous?

I have heard it argued that some analysts, I won’t say what discipline, want to be able to float their ideas anonymously but then also get credit should they be proven to be correct. Anonymity but also tracking at the author’s behest.

If required to build such a system I would, but I would not encourage it.

In part because of the civility issue but also because people should own their ideas, suggestions, statements, etc., and to take responsibility for them.

Think of it this way, segregation wasn’t ended by people posting anonymous comments to newspaper forums. Segregation was ended by people of different races and religions owning their words in opposition to segregation, to the point of discrimination, harassment, physical injury and even death.

If you are not that brave, why would anyone want to listen to you?

January 23, 2014

Foundation…

Filed under: ElasticSearch,Lucene — Patrick Durusau @ 8:29 pm

Foundation: Learn and Play with Elasticsearch

I have posted about several of the articles here but missed posting about the homepage for this site.

Take a close look at Play. It offers you the opportunity to alter documents and search settings, online experimentation I would call it, with ElasticSearch.

The idea of simple, interactive play with search software is a good one.

I wonder how that would translate into an interface for the same thing for topic maps?

The immediacy of feedback along with a non-complex interface would be selling points to me.

You will also find some twenty-five articles (as of today) ranging from beginner to more advanced topics on ElasticSearch.

Data Citation Implementation Group

Filed under: Citation Practices,Humor — Patrick Durusau @ 7:33 pm

Data Citation Implementation Group

I try to capture “new” citation groups as they arise, mostly so if I encounter the need to integrate two or more “new” citations I will know where to start.

I thought you might be amused at this latest edition to the seething welter of citation groups:

You must be a member of this group to view and participate in it. Membership is by invitation only.

This group is invite only, so you may not apply for membership.

So, not only will we have:

Traditional citations

New web?-based citations

but also:

Unknown citations.

😉

Data integration, like grave digging, is an occupation with a lot of job security.

Finding long tail suggestions…

Filed under: Lucene,Search Engines,Searching — Patrick Durusau @ 7:26 pm

Finding long tail suggestions using Lucene’s new FreeTextSuggester by Mike McCandless.

From the post:

Lucene’s suggest module offers a number of fun auto-suggest implementations to give a user live search suggestions as they type each character into a search box.

For example, WFSTCompletionLookup compiles all suggestions and their weights into a compact Finite State Transducer, enabling fast prefix lookup for basic suggestions.

AnalyzingSuggester improves on this by using an Analyzer to normalize both the suggestions and the user’s query so that trivial differences in whitespace, casing, stop-words, synonyms, as determined by the analyzer, do not prevent a suggestion from matching.

Finally, AnalyzingInfixSuggester goes further by allowing infix matches so that words inside each suggestion (not just the prefix) can trigger a match. You can see this one action at the Lucene/Solr Jira search application (e.g., try “python”) that I recently created to eat our own dog food. It is also the only suggester implementation so far that supports highlighting (this has proven challenging for the other suggesters).

Yet, a common limitation to all of these suggesters is that they can only suggest from a finite set of previously built suggestions. This may not be a problem if your suggestions are past user queries and have tons and tons of them (e.g., you are Google). Alternatively, if your universe of suggestions is inherently closed, such as the movie and show titles that Netflix’s search will suggest, or all product names on an e-commerce site, then a closed set of suggestions is appropriate.
….

Since you are unlikely to be Google, Mike goes on to show how FreeTextSuggester can ride to your rescue!

As always, Mike’s post is a pleasure to read.

Schema Alteration [You asked for it.]

Filed under: Datomic — Patrick Durusau @ 7:04 pm

Schema Alteration by Christopher Redinger.

From the post:

Datomic is a database that has flexible, minimal schema. Starting with version 0.9.4470, available here, we have added the ability to alter existing schema attributes after they are first defined. You can alter schema to

  • rename attributes
  • rename your own programmatic identities (uses of :db/ident)
  • add or remove indexes
  • add or remove uniqueness constraints
  • change attribute cardinality
  • change whether history is retained for an attribute
  • change whether an attribute is treated as a component

Schema alterations use the same transaction API as all other transactions, just as schema installation does. All schema alterations can be performed while a database is online, without requiring database downtime. Most schema changes are effective immediately, at the end of the transaction. There is one exception: adding an index requires a background job to build the new index. You can use the new syncSchema API for detecting when a schema change is available.

When renaming an attribute or identity, you can continue to use the old name as long as you haven’t repurposed it. This allows for incremental application updating.

See the schema alteration docs for the details.

Schema alteration has been our most requested enhancement. We hope you find it useful and look forward to your feedback.

Well? Go alter some schemas (non-production would be my first choice) and see what happens. 😉

« Newer PostsOlder Posts »

Powered by WordPress