Another Word For It Patrick Durusau on Topic Maps and Semantic Diversity

December 2, 2013

Top search tips from Exeter and Bristol

Filed under: Searching — Patrick Durusau @ 7:28 pm

Top search tips from Exeter and Bristol by Karen Blakeman.

From the post:

A couple of weeks ago I was in Exeter and Bristol leading workshops for NHS South West on “Google & Beyond”. We covered advanced Google commands, Google Scholar and alternatives to Google. Below are the combined top tips from the two sessions. I may have missed a couple from the list as I could not read my writing, so if you attended one of the workshops let me know if I’ve omitted your suggested tip.

All of these tips are no doubt old hat to readers of this blog but Karen gives a nice list of search tips you can forward to your users. 😉

Enjoy!

A language for search and discovery

Filed under: Search Behavior,Searching,Users — Patrick Durusau @ 7:22 pm

A language for search and discovery by Tony Russell-Rose.

Abstract:

In order to design better search experiences, we need to understand the complexities of human information-seeking behaviour. In this paper, we propose a model of information behaviour based on the needs of users across a range of search and discovery scenarios. The model consists of a set of modes that users employ to satisfy their information goals.

We discuss how these modes relate to existing models of human information seeking behaviour, and identify areas where they differ. We then examine how they can be applied in the design of interactive systems, and present examples where individual modes have been implemented in interesting or novel ways. Finally, we consider the ways in which modes combine to form distinct chains or patterns of behaviour, and explore the use of such patterns both as an analytical tool for understanding information behaviour and as a generative tool for designing search and discovery experiences.

Tony’s post is also available as a pdf file.

A deeply interesting paper but consider the evidence that underlies it:

The scenarios were collected as part of a series of requirements workshops involving stakeholders and customer-facing staff from various client organisations. A proportion of these engagements focused on consumer-oriented site search applications (resulting in 277 scenarios) and the remainder on enterprise search applications (104 scenarios).

The scenarios were generated by participants in breakout sessions and subsequently moderated by the workshop facilitator in a group session to maximise consistency and minimise redundancy or ambiguity. They were also prioritised by the group to identify those that represented the highest value both to the end user and to the client organisation.

This data possesses a number of unique properties. In previous studies of information seeking behaviour (e.g. [5], [10]), the primary source of data has traditionally been interview transcripts that provide an indirect, verbal account of end user information behaviours. By contrast, the current data source represents a self-reported account of information needs, generated directly by end users (although a proportion were captured via proxy, e.g. through customer facing staff speaking on behalf of the end users). This change of perspective means that instead of using information behaviours to infer information needs and design insights, we can adopt the converse approach and use the stated needs to infer information behaviours and the interactions required to support them.

Moreover, the scope and focus of these scenarios represents a further point of differentiation. In previous studies, (e.g. [8]), measures have been taken to address the limitations of using interview data by combining it with direct observation of information seeking behaviour in naturalistic settings. However, the behaviours that this approach reveals are still bounded by the functionality currently offered by existing systems and working practices, and as such do not reflect the full range of aspirational or unmet user needs encompassed by the data in this study.

Finally, the data is unique in that is constitutes a genuine practitioner-oriented deliverable, generated expressly for the purpose of designing and delivering commercial search applications. As such, it reflects a degree of realism and authenticity that interview data or other research-based interventions might struggle to replicate.

It’s not a bad thing to use data from commercial engagements for research and is certainly better than usability studies based on 10 to 12 undergraduates, two of whom did not complete the study. 😉

However, I would be very careful about trying to generalize from a self-selected group even for commercial search, much less the fuller diversity of other search scenarios.

On the other hand, the care with which the data was analyzed makes it an excellent data point against which to compare other data points, hopefully with more diverse populations.

Modern Healthcare Architectures Built with Hadoop

Filed under: Hadoop,Health care,Hortonworks — Patrick Durusau @ 7:03 pm

Modern Healthcare Architectures Built with Hadoop by Justin Sears.

From the post:

We have heard plenty in the news lately about healthcare challenges and the difficult choices faced by hospital administrators, technology and pharmaceutical providers, researchers, and clinicians. At the same time, consumers are experiencing increased costs without a corresponding increase in health security or in the reliability of clinical outcomes.

One key obstacle in the healthcare market is data liquidity (for patients, practitioners and payers) and some are using Apache Hadoop to overcome this challenge, as part of a modern data architecture. This post describes some healthcare use cases, a healthcare reference architecture and how Hadoop can ease the pain caused by poor data liquidity.

As you would guess, I like the phrase data liquidity. 😉

And Justin lays out the areas where we are going to find “poor data liquidity.”

Source data comes from:

  • Legacy Electronic Medical Records (EMRs)
  • Transcriptions
  • PACS
  • Medication Administration
  • Financial
  • Laboratory (e.g. SunQuest, Cerner)
  • RTLS (for locating medical equipment & patient throughput)
  • Bio Repository
  • Device Integration (e.g. iSirona)
  • Home Devices (e.g. scales and heart monitors)
  • Clinical Trials
  • Genomics (e.g. 23andMe, Cancer Genomics Hub)
  • Radiology (e.g. RadNet)
  • Quantified Self Sensors (e.g. Fitbit, SmartSleep)
  • Social Media Streams (e.g. FourSquare, Twitter)

But then I don’t see what part of the Hadoop architecture addresses the problem of “poor data liquidity.”

Do you?

I thought I had found it when Charles Boicey (in the UCIH case study) says:

“Hadoop is the only technology that allows healthcare to store data in its native form. If Hadoop didn’t exist we would still have to make decisions about what can come into our data warehouse or the electronic medical record (and what cannot). Now we can bring everything into Hadoop, regardless of data format or speed of ingest. If I find a new data source, I can start storing it the day that I learn about it. We leave no data behind.”

But that’s not “data liquidity,” not in any meaningful sense of the word. Dumping your data to paper would be just as effective and probably less costly.

To be useful, “data liquidity” must has a sense of being integrated with data from diverse sources. To present the clinician, researcher, health care facility, etc. with all the data about a patient, not just some of it.

I also checked the McKinsey & Company report “The ‘Big Data’ Revolution in Healthcare.” I didn’t expect them to miss the data integration question and they didn’t.

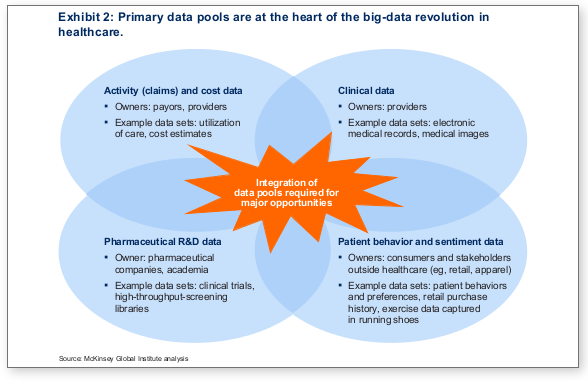
The second exhibit in the McKinsey and Company report (the full report):
big data integration

The part in red reads:

Integration of data pools required for major opportunities.

I take that to mean that in order to have meaningful healthcare reform, integration of health care data pools is the first step.

Do you disagree?

And if that’s true, that we need integration of health care data pools first, do you think Hadoop can accomplish that auto-magically?

I don’t either.

NIH deposits first batch of genomic data for Alzheimer’s disease

Filed under: Bioinformatics,Genomics,Medical Informatics — Patrick Durusau @ 5:44 pm

NIH deposits first batch of genomic data for Alzheimer’s disease

From the post:

Researchers can now freely access the first batch of genome sequence data from the Alzheimer’s Disease Sequencing Project (ADSP), the National Institutes of Health (NIH) announced today. The ADSP is one of the first projects undertaken under an intensified national program of research to prevent or effectively treat Alzheimer’s disease.

The first data release includes data from 410 individuals in 89 families. Researchers deposited completed WGS data on 61 families and have deposited WGS data on parts of the remaining 28 families, which will be completed soon. WGS determines the order of all 3 billion letters in an individual’s genome. Researchers can access the sequence data at dbGaP or the National Institute on Aging Genetics of Alzheimer’s Disease Data Storage Site (NIAGADS), https://www.niagads.org.

“Providing raw DNA sequence data to a wide range of researchers proves a powerful crowd-sourced way to find genomic changes that put us at increased risk for this devastating disease,” said NIH Director, Francis S. Collins, M.D., Ph.D., who announced the start of the project in February 2012. “The ADSP is designed to identify genetic risks for late-onset of Alzheimer’s disease, but it could also discover versions of genes that protect us. These insights could lead to a new era in prevention and treatment.”

As many as 5 million Americans 65 and older are estimated to have Alzheimer’s disease, and that number is expected to grow significantly with the aging of the baby boom generation. The National Alzheimer’s Project Act became law in 2011 in recognition of the need to do more to combat the disease. The law called for upgrading research efforts by the public and private sectors, as well as expanding access to and improving clinical and long term care. One of the first actions taken by NIH under Alzheimer’s Act was the allocation of additional funding in fiscal 2012 for a series of studies, including this genome sequencing effort. Today’s announcement marks the first data release from that project.

You will need to join with or enlist in a open project with bioinformatics and genmics expertise to make a contribution but the data is “out there.”

Not to mention the need to integrate existing medical literature, legacy data from prior patients, drug trials, etc., despite usual semantic confusion of the same.

Google’s R Style Guide [TM Guides?]

Filed under: Authoring Topic Maps,Programming,R — Patrick Durusau @ 5:09 pm

Google’s R Style Guide

From the webpage:

R is a high-level programming language used primarily for statistical computing and graphics. The goal of the R Programming Style Guide is to make our R code easier to read, share, and verify. The rules below were designed in collaboration with the entire R user community at Google.

Useful if you are trying to develop good R coding habits from the start.

Makes me wonder about a similar need for topic maps authors? At least on a project by project basis.

If I am always representing marital status as an occurrence on a topic, that isn’t going to fit well with another author who always uses associations to represent marriages.

There could be compelling reasons in a project for choosing one or the other.

Similar questions will come up with other subjects and relationships as well.

It won’t be 100% but best to try to get everyone off on the same foot and to validate output against your local authoring guidelines.

Fractal Fest

Filed under: Fractals — Patrick Durusau @ 4:58 pm

Fractal Fest

From the tweet by IBM Research:

FRACTAL FEST on IBMblr It’s Tumblr like you’ve never seen it!. Turn your favorite blogs into fractal works of art with the IBMblr Fractalizer. And keep following along as we explore the contours,…

Some things are worth mentioning simply because they exist.

Fractals are one of the few things that fall into that category.

Enjoy!

Vidi Competition [Closes 14th February 2014]

Filed under: Contest,Linked Data — Patrick Durusau @ 4:41 pm

Vidi Competition by Marieke Guy. (A public email notice I received today.)

At the start of November the LinkedUp Project launched the second in our LinkedUp Challenge – the Vidi Competition.

For the Vidi Competition we are inviting you to design and build innovative and robust prototypes and demos for tools that analyse and/or integrate open web data for educational purposes. The competition will run from 4th November 2013 till 14th February 2014. Prizes (up to €3,000 for first) will be awarded at the European Semantic Web Conference in Crete, Greece in May 2014. You can find out full details on the LinkedUp Challenge Website.

For this Competition we have one open track and two focused tracks that may guide teams or provide inspiration.

We’ve recently published blog posts on the tracks:

  • Pathfinder: Using linked data to ease access to recommendations and guidance
  • Simplificator: Using linked data to add context to domain-specific resources

There is also a blog post detailing the technical support we can offer.

We’d like to complement these posts with an online webinar which will introduce LinkedUp and the Vidi Competition. There will also be an opportunity to ask our technical support team questions and find out more about the data sets available. The webinar will take approximately 45 minutes and will be recorded.

The webinar is still in planning but is likely to take place in the next couple of weeks, if you are interested in participating please register your email address and we will share times with you.

A collection of suggested data sources can be found at the LinkedUp Data Repository

The overall theme of the competition:

We’re inviting you to design and build innovative and robust prototypes and demos for tools that analyse and/or integrate open web data for educational purposes. You can submit your Web application, App, analysis toolkit, documented API or any other tool that connects, exploits or analyses open or linked data and that addresses real educational needs. Your tool still may contain some bugs, as long as it has a stable set of features and you have some proof that it can be deployed on a realistic scale.

You could approach this competition several ways:

  1. Do straight linked data as a credential of your ability to produce and use linked data.
  2. Do straight linked data and supplement it with a topic map, either separately or as part of the competition.
  3. Create a solution (topic maps and/or linked data) and approach people with an interest in these resources.

A regular reader of this blog recently reminded me people are not shopping for topic maps (or linked data) but for results. (That’s #3 in my list.)

ElasticSearch 1.0.0.Beta2 released

Filed under: Aggregation,ElasticSearch,Search Engines — Patrick Durusau @ 4:08 pm

ElasticSearch 1.0.0.Beta2 released by Clinton Gromley.

From the post:

Today we are delighted to announce the release of elasticsearch 1.0.0.Beta2, the second beta release on the road to 1.0.0 GA. The new features we have planned for 1.0.0 have come together more quickly than we expected, and this beta release is chock full of shiny new toys. Christmas has come early!

We have added:

Please download elasticsearch 1.0.0.Beta2, try it out, break it, figure out what is missing and tell us about it. Our next release will focus on cleaning up inconsistent APIs and usability, plus fixing any bugs that are reported in the new functionality, so your early bug reports are an important part of ensuring that 1.0.0 GA is solid.

WARNING: This is a beta release – it is not production ready, features are not set in stone and may well change in the next version, and once you have made any changes to your data with this release, it will no longer be readable by older versions!

Suggestion: Pay close attention to the documentation on the new aggregation capabilities.

For example:

There are many different types of aggregations, each with its own purpose and output. To better understand these types, it is often easier to break them into two main families:

Bucketing: A family of aggregations that build buckets, where each bucket is associated with a key and a document criteria. When the aggregations is executed, the buckets criterias are evaluated on every document in the context and when matches, the document is considered to “fall in” the relevant bucket. By the end of the aggreagation process, we’ll end up with a list of buckets – each one with a set of documents that “belong” to it.

Metric: Aggregations that keep track and compute metrics over a set of documents

The interesting part comes next, since each bucket effectively defines a document set (all documents belonging to the bucket), one can potentially associated aggregations on the bucket level, and those will execute within the context of that bucket. This is where the real power of aggregations kicks in: aggregations can be nested!

Interesting, yes?

[Disorderly] Video Lectures in Mathematics

Filed under: Mathematics,Video — Patrick Durusau @ 3:18 pm

[Disorderly] Video Lectures in Mathematics

Pinterest, home to a disorderly collection of video lectures on mathematics.

Not the fault of the lectures but only broad bucket organization is possible.

If you need a holiday project, organizing this collection would be a real value-add for the community.

The organization would have to be outside of Pinterest and pointing back to the lectures.

GraphGist Challenge December (5 Dec. 2013, Thursday)

Filed under: Graphs,Neo4j — Patrick Durusau @ 3:10 pm

GraphGist Challenge December Organizers: Peter Neubauer and Micheal Hunger.

From the meeting announcement:

Thursday, December 5, 2013

It is 7PM CET, 10AM PT.

We’ll talk about our new GraphGist challenge to create the best graph domain models ever and how to model them as a graph gist.

After a quick presentation, we go into demo mode and show hands on how these gists are created, formatted and published.

We’re ready for your questions, comments and feedback.

Preliminary slide deck

We’ll add the hangout link as the time approaches.

Join and RSVP!

That should be 1 PM, Thursday, December 5, 2013, on the East Coast of the US.

If you are unfamiliar with graphgists, check out the GraphGist Wiki.

Entries from the first GraphGist Challenge, details on graphgists, etc.

Graphs for everything, ranging from chess to airports to Harry Potter!

December 1, 2013

Computational Social Science

Filed under: Graphs,Networks,Social Networks,Social Sciences — Patrick Durusau @ 9:26 pm

Georgia Tech CS 8803-CSS: Computational Social Science by Jacob Eisenstein

From the webpage:

The principle aim for this graduate seminar is to develop a broad understanding of the emerging cross-disciplinary field of Computational Social Science. This includes:

  • Methodological foundations in network and content analysis: understanding the mathematical basis for these methods, as well as their practical application to real data.
  • Best practices and limitations of observational studies.
  • Applications to political science, sociolinguistics, sociology, psychology, economics, and public health.

Consider this as an antidote to the “everything’s a graph, so let’s go” type approach.

Useful application of graph or network analysis requires a bit more than enthusiasm for graphs.

Just scanning the syllabus, devoting serious time to the readings will give you a good start on the skills required to be useful with network analysis.

I first saw this in a tweet by Jacob Eisenstein.

44 million stars and counting: …

Filed under: Archives,Astroinformatics,BigData — Patrick Durusau @ 9:14 pm

44 million stars and counting: Astronomers play Snap and remap the sky

From the post:

Tens of millions of stars and galaxies, among them hundreds of thousands that are unexpectedly fading or brightening, have been catalogued properly for the first time.

Professor Bryan Gaensler, Director of the ARC Centre of Excellence for All-sky Astrophysics (CAASTRO) based in the School of Physics at the University of Sydney, Australia, and Dr Greg Madsen at the University of Cambridge, undertook this formidable challenge by combining photographic and digital data from two major astronomical surveys of the sky, separated by sixty years.

The new precision catalogue has just been published in The Astrophysical Journal Supplement Series. It represents one of the most comprehensive and accurate compilations of stars and galaxies ever produced, covering 35 percent of the sky and using data going back as far as 1949.

Professor Gaensler and Dr Madsen began by re-examining a collection of 7400 old photographic plates, which had previously been combined by the US Naval Observatory into a catalogue of more than one billion stars and galaxies.

The researchers are making their entire catalogue public on the WWW, in the lead-up to the next generation of telescopes designed to search for changes in the night sky, such as the Panoramic Survey Telescope and Rapid Response System in Hawaii and the SkyMapper telescope in Australia. (unlike the Astrophysical Journal article referenced above)

Now there’s a big data project!

Because of the time period for comparison, the investigators found variations in star brightness that would have otherwise gone undetected.

Will your data be usable in sixty (60) years?

Bourbon family tree

Filed under: Graphics,Humor — Patrick Durusau @ 8:59 pm

Bourbon family tree by Nathan Yau.

Nathan has located and reproduced a family tree for bourbon produced by the major distillers in three states.

Print out and use this over the holidays to track your drinking across family lines. 😉

Hadoop on a Raspberry Pi

Filed under: Hadoop,Programming — Patrick Durusau @ 8:52 pm

Hadoop on a Raspberry Pi by Isaac Lopez

From the post:

Looking for a fun side project this winter? Jamie Whitehorn has an idea for you. He put Hadoop on a cluster of Raspberry Pi mini-computers. Sound ridiculous? For a student trying to learn Hadoop, it could be ridiculously cool.

For those who don’t know what a Raspberry Pi is, think of it as a computer on a credit card meets Legos. They’re little chunks of computing technology, complete with a Linux operating system, a 700MHz ARM11 processor, a low-power video processor and up to 512MB of Memory. Tinkerers can use it as the computing brains behind any number of applications that they design to their heart’s content. In a recent example, a Raspberry Pi enthusiast built a Raspberry Pi mini PC, which he used to control a mini CNC Laser engraver made out of an old set of salvaged DVD drives and $10 dollars in parts of eBay. Ideas range from building a web server, a weather station, home automation systems, mini arcades – the list of projects is endless.

At the Strata + Hadoop World conference last month, Jamie Whitehorn shared his Hadoop Raspberry Pi creation with an audience. He discussed the challenges a student has in learning the Hadoop system. Chiefly, it’s a distributed architecture that requires multiple computers to operate. Someone looking to build Hadoop skills in a test environment would need several machines, and quite an electricity bill to get a cluster up – a prospect that can be very expensive for a student.

Whitehorn makes the point that while it’s true that this can all be avoided using a Hadoop cloud service, he says that defeats the point, which is understanding the interaction between the software and the hardware. The whole point of the exercise, he explains, is to face the complexity of the project and overcome it.

Whitehorn says that he’s learned a lot about Hadoop from attempting the project, and encourages others to get in on the action. For anyone who is interested in doing that, he has posted a blog entry that discusses his approach and some of the nuances that can be found here.

If you want to learn Hadoop close to the metal, or closer than usual, this is the project for you!

Ordered Container

Filed under: Graphs,Neo4j — Patrick Durusau @ 8:43 pm

Ordered Container by Johannes Mockenhaupt.

From the post:

Mark Needham – via an interesting blogpost – made me go back to finish my pondering on how to model an ordered container. By which I basically mean an ordered list in a graph. Trimming down what he describes to the problem of containment and order, I use the example of songs that are part of an album and part of a playlist, both of which are ordered. Actually, I was modeling that anyway. So just doing the old NEXT relationships on songs to order them won’t work, since the unanswered question would be “who’s NEXT is it anyway?”. The album’s, the playlist’s? Or from another container that will be added in the future?

But why should the NEXT relationship go on the song in the first place? The song doesn’t care. Both the containment and the order are concerns of the album and playlist – the containers. So let them handle it. But how? Have HAS relationships from the container to the songs with position properties on the relationships? Awkward and not very pretty to query. Nor very graphy. So the position can’t be on the song node and it can’t be in the relationship … guess we need more nodes! Let’s extract the ordering into separate nodes:

Interesting but what puzzles me about the “next” relationship/edge is that I have to traverse all of the “next” relationships in order to reach say the fifth song on an album or playlist.

I would treat the order of the songs as a separate node, perhaps AlbumOrder, which contains an ordered list of the song as they appear on the album. Each song (represented by a separate node) can have an albumOrder relationship with the AlbumOrder node.

When at any song that appeared on the album, I can check its albumOrder (or playList1 or playList2) order relationship to discover its place in that album or list. Moreover, without unnecessary edge traversal, searching for another song, I can traverse the list and jump to any song that appeared on the album (assuming the song name and node ID have been captured by the list).

Suggestions/comments?

PS: True that my solution leaves the subject of the relationship of the songs implicit, but if all I am going to say is “next,” that hardly seems worth an edge.

SICP in Clojure

Filed under: Clojure,Programming,Scheme — Patrick Durusau @ 5:44 pm

SICP in Clojure by For reasons unknown, the maintainer posted a link to Steve Deobald as the maintainer. Sorry Steve!

From the webpage:

This site exists to make it easier to use Clojure rather than Scheme while working through SICP. The folks behind SICP were kind enough to release it under a Creative Commons Attribution-Noncommercial 3.0 Unported License, which will allow me to annotate the text and adapt its source code and exercises to fit the Clojure language.

Structure and Interpretation of Computer Programs, or SICP, is widely considered one of the most influential texts in computer science education. If you believe Peter Norvig, it will change your life. MIT Scheme, a minimalist dialect of Lisp, is used for all code examples and exercises.

Clojure is a “modern” Lisp that runs on the Java Virtual Machine. Its speed, easy access to Java libraries, and focus on concurrency make it an appealing language for many applications.

This site exists to make it easier to use Clojure while working through SICP. The folks behind SICP were kind enough to release it under a Creative Commons Attribution-Noncommercial 3.0 Unported License, which will allow me to annotate the text and adapt its source code and exercises to fit the Clojure language.

All credit, of course, belongs to the authors: Harold Abelson and Gerald Jay Sussman, with Julie Sussman.

As you will find at the status page, there is much work left to be done on this remarkable project.

Any thoughts on how to move this project forward? Such as having the real maintainer stand up?

QuaaxTM 0.7.6

Filed under: QuaaxTM,Topic Map Software — Patrick Durusau @ 3:45 pm

QuaaxTM 0.7.6

From the webpage:

QuaaxTM is a PHP Topic Maps engine which supports ISO/IEC 13250-2 Topic Maps Data Model (TMDM). The TMDM is a subject centric data model.

QuaaxTM implements the PHPTMAPI core and index interfaces. PHPTMAPI is based on the TMAPI specification and provides a standardized API for PHP 5 to access and process data held in a topic map.

QuaaxTM persists Topic Maps data using MySQL with InnoDB as storage engine and therefore benefits from transaction support and referential integrity.

Now there’s a nice way to start the month! A new release of topic map software!

Review the change log or just download the latest release.

« Newer Posts

Powered by WordPress