Another Word For It Patrick Durusau on Topic Maps and Semantic Diversity

December 19, 2013

Military footprint

Filed under: Data,Maps — Patrick Durusau @ 7:50 pm

Military footprint by Nathan Yau.

Nathan has found a collection of aerial photographs of military bases around the world. Along with their locations.

Excellent information for repackaging with other information about military bases and their surroundings.

WARNING: Laws concerning the collection and/or sale of information about military bases varies from one jurisdiction to another.

Just so you know and can price your services appropriately.

Fascinating food networks, in neo4j

Filed under: Food,Graphs,Neo4j — Patrick Durusau @ 7:38 pm

Fascinating food networks, in neo4j by Rik Van Bruggen.

From the post:

When you’re passionate about graphs like I am, you start to see them everywhere. And as we are getting closer to the food-heavy season of the year, it’s perhaps no coincidence that this graph I will be introducing in this blogpost – is about food.

A couple of weeks ago, when I woke up early (!) Sunday morning to get “pistolets” and croissants for my family from our local bakery, I immediately took notice when I saw a graph behind the bakery counter. It was a “foodpairing” graph, sponsored by the people of Puratos – a wholesale provider of bakery products, grains, etc. So I get home and start googling, and before you know it I find some terribly interesting research by Yong-Yeol (YY) Ahn, featured in a Wired article, and in Scientific American, and in Nature. This researcher had done some fascinating work in understanding al 57k recipes from Epicurious, Allrecipes and Menupan, their composing ingredients and ingredient categories, their origin and – perhaps most fascinating of all – their chemical compounds.

Rik walks you through acquiring some of these datasets, cleaning them up and then loading the datasets into Neo4j.

My only suggestion is that before you start browsing the dataset that you have cookies and milk within easy reach. šŸ˜‰

UNESCO Open Access Publications [Update]

Filed under: Data,Government,Government Data,Open Data — Patrick Durusau @ 7:22 pm

UNESCO Open Access Publications

From the webpage:

Building peaceful, democratic and inclusive knowledge societies across the world is at the heart of UNESCOā€™s mandate. Universal access to information is one of the fundamental conditions to achieve global knowledge societies. This condition is not a reality in all regions of the world.

In order to help reduce the gap between industrialized countries and those in the emerging economy, UNESCO has decided to adopt an Open Access Policy for its publications by making use of a new dimension of knowledge sharing – Open Access.

Open Access means free access to scientific information and unrestricted use of electronic data for everyone. With Open Access, expensive prices and copyrights will no longer be obstacles to the dissemination of knowledge. Everyone is free to add information, modify contents, translate texts into other languages, and disseminate an entire electronic publication.

For UNESCO, adopting an Open Access Policy means to make thousands of its publications freely available to the public. Furthermore, Open Access is also a way to provide the public with an insight into the work of the Organization so that everyone is able to discover and share what UNESCO is doing.

You can access and use our resources for free by clicking here.

In May of 2013 UNESCO announced its Open Access policy.

Many organizations profess a belief in “Open Access.”

The real test is whether they practice “Open Access.”

indexing in Neo4j ā€“ an overview

Filed under: Graphs,Indexing,Neo4j — Patrick Durusau @ 7:13 pm

indexing in Neo4j ā€“ an overview by Stefan Armbruster.

From the post:

Neo4j as a graph database features indexing as the preferred way to find start points for graph traversals. Over the years multiple different indexing approach have been added. The goal of this article is to give an overview on this to avoid confusion esp. for those who just recently got started with Neo4j.

A graph database using a property graph model stores its data in nodes, relationships and properties. In Neo4j 2.0 this model was amended with labels.

A very nice summary of the indexing mechanisms in Neo4j.

After all, if you write something down and then can’t find it, what good is it?

Enjoy!

Pigs can build graphs too for graph analytics

Filed under: GraphBuilder,Graphs — Patrick Durusau @ 7:08 pm

Pigs can build graphs too for graph analytics by Ted Willke.

From the post:

Today, my team is announcing a major update to IntelĀ® Graph Builder for Apache Hadoop* software, our open source library that structures big data for graph-based machine learning and data mining. This update will help data scientists accelerate their time-to-insight by making graph analytics easier to work with on big data systems. We believe that graph analytics will be a key tool for realizing value from big data once a few key hurdles are cleared, and, in this blog, my engineers and I would like to share our perspective on why we decided to tackle graph construction first and what weā€™re doing to make it easier.

….

Additional resources:

IntelĀ® Graph Builder for Apache Hadoop* Software v2

GraphBuilder Community

Oddly enough, version 2.0 doesn’t show up on github.

Check back early next week.

I first saw this in a tweet by aurelius.

DataViva

Filed under: Government Data,Open Data — Patrick Durusau @ 4:00 pm

DataViva

I don’t know enough about the Brazilian economy to say if the visualizations are helpful or not.

What I can tell you is the visualizations are impressive!

Thoughts on the site as an interface to open data?

PS: This appears to be a government supported website so not all government sponsored websites are poor performers.

Have You Been Naughty Or Nice?

Filed under: Humor,Maps — Patrick Durusau @ 3:47 pm

Maps Of Seven Deadly Sins In America

From the post:

Geographers from Kansas State University have created a map of the spatial distribution of the Seven Deadly Sins across the United States. How? By mapping demographic data related to each of the Sins.

Below are screenshots of the maps in standard deviation units; red naturally is more sinful, blue less sinful.

I’m not vouching for the accuracy of these maps. šŸ˜‰

I could not find the original project, which was apparently a presentation at a geography conference in Las Vegas.

Has anyone mapped the levels in Dante’s Inferno to a U.S. map?

Based on crime and other socio-economic data?

That would be a real interesting map.

Although not the sort of thing you would find at the tourist bureau.

OrientDB. Thanks!!!

Filed under: Graphs,OrientDB — Patrick Durusau @ 10:47 am

OrientDB. Thanks!!! by Peter Graff.

From the post:

Every now and then you come across open source projects that just amazes you. OrientDB is one of these projects.

Iā€™ve always assumed that Iā€™d have to use a polyglot persistence model in complex applications. Iā€™d use a graph database if I want to traverse the information, Iā€™d use a document database when I want schema less complex structures, and the list goes on.

OrientDB seems to have it all though. It is kind of the Swiss army knife of databases, but unlike a Swiss army knife, each of the tools is best of bread.

Iā€™ve had a few experiences with applications built on OrientDB and also been spending some time testing and evaluating the database. I keep thinking back to projects that Iā€™ve implemented in the past and wishing I had OrientDB to my disposal. Asking questions such as:

Among several interesting observations about OrientDB Peter writes:

Now, imagine each document in the document database as a vertex? Is that possible? OrientDB has done exactly that. Instead of each node being a flat set of properties, it can be a complete document (with nested properties).

Sound tempting?

Read Peter’s post first and then grab a copy of OrientDB.

Tittel [Merry Christmas Marko!]

Filed under: GraphBuilder,Graphs,Titan — Patrick Durusau @ 10:31 am

Intel Goes Graph with Hadoop Distro by Alex Woodie.

From the post:

Intel will be targeting big retail operations with a new graph database that it unveiled today as part of its Intel Distribution for Apache Hadoop version 3 announcement. The graph engine will enable customers to make product or customer recommendations in real time, a la Netflix or Amazon, based on existing data. The chip giant also fleshed out its Hadoop distro with a 20x speedup in encryption functions, a data tokenization option, and a handful of new machine learning algorithms aimed at solving common problems.

Intel got its feet wet with graph analytics a year ago when it released into the open source arena Graph Builder, a set of libraries designed to help developers create graphs based on real world models. Since that first alpha release, Intel developers have streamlined the software and made it easier for users to import, clean, and transform large amounts of data sitting in the graph database. These enhancements will ship in early 2014 as Intel Graph Builder for Apache Hadoop software version 2.

Intel Graph Builder is based on the open source Titan distributed graph database, and uses Pig scripts to trigger queries on top of the graph, says Ritu Kama, director of product management in Intel’s Big Data group. The graph engine adds another analytical option for Intel Hadoop customers, in addition to MapReduce, HBase, Hive, and Mahout, which are all bundled with the distribution.

Yes, Titan, whose development has been lead by Marko A. Rodriguez.

I can’t think of a better Christmas present!

Will Tittel be the successor to Wintel?

When you tire of the shallow end of the graph pool, you can answer that question for yourself with Titan and/or the IntelĀ® Distribution.

PS: The download page says:

Download the IntelĀ® Distribution to experience the power of hardware assisted security & enterprise grade performance for Apache Hadoop* big data processing. This 100% Apache Hadoop* open source download delivers core project capabilities with value added IntelĀ® Manager: auto-tuning for hadoop clusters, role based access control for HBase, multi-site scalability and adaptive replication in HBase, and many other features to ease deployment of Hadoop in the enterprise. After registration you will be presented to download TAR or Virtual Machine versions, gain access to online help documentation, and receive a link to Community Forums.

It’s 90 day unrestricted evaluation software.

I’m going to wait until after the holidays to grab a copy.

December 18, 2013

d3.js breakout clone

Filed under: D3,Graphics,Visualization — Patrick Durusau @ 7:28 pm

Data Visualization and D3.js Newsletter, Issue 57 has this description:

D3.js Breakout Clone
People always ask “Can I do ____ in d3?” The answer is generally always, yes. To prove that, I made a very simple clone of the classic arcade game breakout. If you die, click to restart the game.

I’m just glad it wasn’t Missile Command.

I might have missed the holidays. šŸ˜‰

Building Hadoop-based Apps on YARN

Filed under: Hadoop YARN,MapReduce — Patrick Durusau @ 5:36 pm

Building Hadoop-based Apps on YARN

Hortonworks has put together resources that may ease your way to your first Hadoop-base app on YARN.

The resources are organized in steps:

  • STEP 1. Understand the motivations and architecture for YARN.
  • STEP 2. Explore example applications on YARN.
  • STEP 3. Examine real world applications YARN.

Further examples and real work applications would be welcomed by anyone studying YARN.

Liberty And Security In A Changing World

Filed under: Cybersecurity,NSA,Security — Patrick Durusau @ 5:16 pm

Liberty And Security In A Changing World: Report and Recommendations of The Presidentā€™s Review Group on Intelligence and Communications Technologies

At just a shade over 300 pages (303 to be exact), I’m not going to attempt to give you an instance analysis of what took months to write.

My suggestion is that you ignore reports, summaries, analysis of this report until you have read the report for yourself.

As I read the report, I am going to annotate it with comments about where topic maps might or might not be useful.

Along with comments as to why topic maps would be useful.

Looking forward to posting the annotated version and getting your feedback on it.

NSA & Connecting the Dots

Filed under: Cybersecurity,NSA,Privacy — Patrick Durusau @ 4:51 pm

A release of an review panel study of Surveillance U.S.A. (SUSA, aka, U.S. intelligence activities) has been rumored on the Net most of the day.

While we wait for a copy of the alleged study, consider this report by the Guardian:

On Wednesday, NSA director Keith Alexander, the army general who will retire in the spring after leading the agency for eight years, strongly defended the bulk collection of phone data as necessary to detect future domestic terrorist attacks. ā€œThere is no other way we know of to connect the dots,ā€ Alexander told the Senate judiciary committee.

Mass telephone data collection because:

There is no other way we know of to connect the dots

If the General wasn’t just playing to the press, that is one key to why U.S. intelligence services are functioning so poorly.

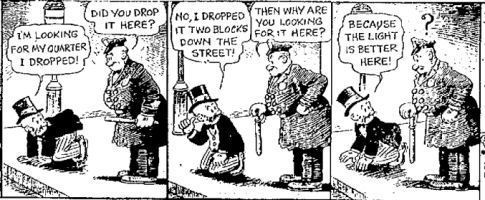
streetlamp

The light is better for connecting telephone dots together.

Connecting other dots, non-telephone dots, the ones that might effectively prevent terrorism, that might be hard.

Or in this case, none of the General’s contract buddies have a clue about connecting non-telephone dots.

Arguments to keep massive telephone surveillance:

  • Telephone dots are easy to connect (even if ineffectual).
  • Usual suspects profit from connecting telephone dots.
  • Usual suspects don’t know how to connect non-telephone dots.

From the General’s perspective, that’s a home run argument.

To me, that’s a three strikes and you are out argument.

There are lots of ways to connect non-telephone dots, effectively and in a timely manner.

It would not be as easy as telephone data but then it would be more effective as well.

You would have to know what sort of non-telephone information the NSA has in order to fashion a connect the non-telephone dot proposal.

Easy information (telephone call records) don’t equal useful information (dot connecting information).

If your cause, organization, agency, department, government, government in waiting, is interested in non-telephone dot connecting advice, you know how to reach me.

PS: BTW, I work on a first come, first served basis.

Character(s) in Unicode 6.3.0

Filed under: Typography,Unicode — Patrick Durusau @ 2:04 pm

Search for character(s) in Unicode 6.3.0 by Tomas Schild.

A site that allows you to search the latest Unicode character set by:

  • Word or phrase from the official Unicode character name
  • Word or phrase from the old, deprecated Unicode 1.0 character name
  • A single character
  • The hexadecimal value of the Unicode postion
  • Search for numerical value

When you need just one or two characters to encode for HTML, this could be very handy.

Be aware that the search engine does not compensate from spelling differences in the Unicode character list.

Thus, a search for “aleph” returns:

Unicode
code point
UTF-8
encoding
(hex.)
Unicode character name
U+10840 f0 90 a1 80 IMPERIAL ARAMAIC LETTER ALEPH
U+10B40 f0 90 ad 80 INSCRIPTIONAL PARTHIAN LETTER ALEPH
U+10B60 f0 90 ad a0 INSCRIPTIONAL PAHLAVI LETTER ALEPH
U+1202A f0 92 80 aa CUNEIFORM SIGN ALEPH

Whereas a search for “alef” returns:

128 characters found

Unicode
code point
UTF-8
encoding
(hex.)
Unicode character name
U+05D0 d7 90 HEBREW LETTER ALEF
U+0616 d8 96 ARABIC SMALL HIGH LIGATURE ALEF WITH LAM WITH YEH
U+0622 d8 a2 ARABIC LETTER ALEF WITH MADDA ABOVE
U+0623 d8 a3 ARABIC LETTER ALEF WITH HAMZA ABOVE
U+0625 d8 a5 ARABIC LETTER ALEF WITH HAMZA BELOW
U+0627 d8 a7 ARABIC LETTER ALEF
U+0649 d9 89 ARABIC LETTER ALEF MAKSURA
Remaining 121 characters omitted

Semitic alphabets all contain the alef/aleph character which represents a glottal stop.

I have no immediate explanation for why the Unicode standard chose different names for the same character in different languages.

But, be aware that it does happen.

BTW, I modified the tables to omit the character and other fields.

WordPress seems to have difficulty with Imperial Aramaic, Inscriptional Parthian, Inscriptional Pahlavi, and Cuneiform code points for aleph.

SCIgen – An Automatic CS Paper Generator

Filed under: Humor — Patrick Durusau @ 11:53 am

SCIgen – An Automatic CS Paper Generator by Jeremy Stribling, Max Krohn, and Dan Aguayo.

From the webpage:

SCIgen is a program that generates random Computer Science research papers, including graphs, figures, and citations. It uses a hand-written context-free grammar to form all elements of the papers. Our aim here is to maximize amusement, rather than coherence.

One useful purpose for such a program is to auto-generate submissions to conferences that you suspect might have very low submission standards. A prime example, which you may recognize from spam in your inbox, is SCI/IIIS and its dozens of co-located conferences (check out the very broad conference description on the WMSCI 2005 website). There’s also a list of known bogus conferences. Using SCIgen to generate submissions for conferences like this gives us pleasure to no end. In fact, one of our papers was accepted to SCI 2005! See Examples for more details.

We went to WMSCI 2005. Check out the talks and video. You can find more details in our blog.

WARNING: As per the honor code promise to do your own work, write your own CS paper generator for class submissions.

Curious if anyone has extended this code to allow for customization for specific subject areas?

Or updated the vocabulary?

BTW, the world record for fraudulent papers is held by Yoshitaka Fujii, at 172. (The Problem with Peer Review by Natalie Healey.)

How long would it take to break that record in conference versus journal submissions? Which one would top 172 first? Conferences or journals?

December 17, 2013

RDF Nostalgia for the Holidays

Filed under: RDF,W3C — Patrick Durusau @ 4:07 pm

Three RDF First Public Working Drafts Published

From the announcement:

  • RDF 1.1 Primer, which explains how to use this language for representing information about resources in the World Wide Web.
  • RDF 1.1: On Semantics of RDF Datasets, which presents some issues to be addressed when defining a formal semantics for datasets, as they have been discussed in the RDF Working Group, and specify several semantics in terms of model theory, each corresponding to a certain design choice for RDF datasets.
  • Whatā€™s New in RDF 1.1

The drafts, which may someday become W3C Notes, could be helpful.

There isn’t as much RDF loose in the world as COBOL but what RDF does exist will keep the need for RDF instructional materials alive.

Cross-categorization of legal concepts…

Filed under: Artificial Intelligence,Law,Legal Informatics,Ontology — Patrick Durusau @ 3:21 pm

Cross-categorization of legal concepts across boundaries of legal systems: in consideration of inferential links by Fumiko Kano GlĆ¼ckstad, Tue Herlau, Mikkel N. Schmidt, Morten MĆørup.

Abstract:

This work contrasts Giovanni Sartorā€™s view of inferential semantics of legal concepts (Sartor in Artif Intell Law 17:217ā€“251, 2009) with a probabilistic model of theory formation (Kemp et al. in Cognition 114:165ā€“196, 2010). The work further explores possibilities of implementing Kempā€™s probabilistic model of theory formation in the context of mapping legal concepts between two individual legal systems. For implementing the legal concept mapping, we propose a cross-categorization approach that combines three mathematical models: the Bayesian Model of Generalization (BMG; Tenenbaum and Griffiths in Behav Brain Sci 4:629ā€“640, 2001), the probabilistic model of theory formation, i.e., the Infinite Relational Model (IRM) first introduced by Kemp et al. (The twenty-first national conference on artificial intelligence, 2006, Cognition 114:165ā€“196, 2010) and its extended model, i.e., the normal-IRM (n-IRM) proposed by Herlau et al. (IEEE International Workshop on Machine Learning for Signal Processing, 2012). We apply our cross-categorization approach to datasets where legal concepts related to educational systems are respectively defined by the Japanese- and the Danish authorities according to the International Standard Classification of Education. The main contribution of this work is the proposal of a conceptual framework of the cross-categorization approach that, inspired by Sartor (Artif Intell Law 17:217ā€“251, 2009), attempts to explain reasonerā€™s inferential mechanisms.

From the introduction:

An ontology is traditionally considered as a means for standardizing knowledge represented by different parties involved in communications (Gruber 1992; Masolo et al. 2003; Declerck et al. 2010). Kemp et al. (2010) also points out that some scholars (Block 1986; Field 1977; Quilian 1968) have argued the importance of knowledge structuring, i.e., ontologies, where concepts are organized into systems of relations and the meaning of a concept partly depends on its relationships to other concepts. However, real human to human communication cannot be absolutely characterized by such standardized representations of knowledge. In Kemp et al. (2010), two challenging issues are raised against such idea of systems of concepts. First, as Fodor and Lepore (1992) originally pointed out, it is beyond comprehension that the meaning of any concept can be defined within a standardized single conceptual system. It is unrealistic that two individuals with different beliefs have common concepts. This issue has also been discussed in semiotics (Peirce 2010; Durst-Andersen 2011) and in cognitive pragmatics (Sperber and Wilson 1986). For example, Sperber and Wilson (1986) discuss how mental representations are constructed diversely under different environmental and cognitive conditions. A second point which Kemp et al. (2010) specifically address in their framework is the concept acquisition problem. According to Kemp et al. (2010; see also: Hempel (1985), Woodfield (1987)):

if the meaning of each concept depends on its role within a system of concepts, it is difficult to see how a learner might break into the system and acquire the concepts that it contains. (Kemp et al. 2010)

Interestingly, the similar issue is also discussed by legal information scientists. Sartor (2009) argues that:

legal concepts are typically encountered in the context of legal norms, and the issue of determining their content cannot be separated from the issue of identifying and interpreting the norms in which they occur, and of using such norms in legal inference. (Sartor 2009)

This argument implies that if two individuals who are respectively belonging to two different societies having different legal systems, they might interpret a legal term differently, since the norms in which the two individuals belong are not identical. The argument also implies that these two individuals must have difficulties in learning a concept contained in the other partyā€™s legal system without interpreting the norms in which the concept occurs.

These arguments motivate us to contrast the theoretical work presented by Sartor (2009) with the probabilistic model of theory formation by Kemp et al. (2010) in the context of mapping legal concepts between two individual legal systems. Although Sartorā€™s view addresses the inferential mechanisms within a single legal system, we argue that his view is applicable in a situation where a concept learner (reasoner) is, based on the norms belonging to his or her own legal system, going to interpret and adapt a new concept introduced from another legal system. In Sartor (2009), the meaning of a legal term results from the set of inferential links. The inferential links are defined based on the theory of Ross (1957) as:

  1. the links stating what conditions determine the qualification Q (Q-conditioning links), and
  2. the links connecting further properties to possession of the qualification Q (Q-conditioned links.) (Sartor 2009)

These definitions can be seen as causes and effects in Kemp et al. (2010). If a reasoner is learning a new legal concept in his or her own legal system, the reasoner is supposed to seek causes and effects identified in the new concept that are common to the concepts which the reasoner already knows. This way, common-causes and common-effects existing within a concept system, i.e., underlying relationships among domain concepts, are identified by a reasoner. The probabilistic model in Kemp et al. (2010) is supposed to learn these underlying relationships among domain concepts and identify a system of legal concepts from a view where a reasoner acquires new concepts in contrast to the concepts already known by the reasoner.

Pardon the long quote but the paper is pay-per-view.

I haven’t started to run down all the references but this is an interesting piece of work.

I was most impressed by the partial echoing of the topic map paradigm that: “meaning of each concept depends on its role within a system of concepts….

True, a topic map can capture only “surface” facts and relationships between those facts but that merits a comment on a topic map instance and not topic maps in general.

Noting that you also shouldn’t pay for more topic map than you need. If all you need is a flat mapping between DHS and say the CIA, then doing nor more than mapping terms is sufficient. If you need a maintainable and robust mapping, different techniques would be called for. Both results would be topic maps, but one of them would be far more useful.

One of the principal sources relied upon by the authors’ is: The Nature of Legal Concepts: Inferential Nodes or Ontological Categories? by Giovanni Sartor.

I don’t see any difficulty with Sartor’s rules of inference, any more than saying if a topic has X property (occurrence in TMDM speak), then of necessity it must have property E, F, and G.

Where I would urge caution is with the notion that properties of a legal concept spring from a legal text alone. Or even from a legal ontology. In part because two people in the same legal system can read the same legal text and/or use the same legal ontology and expect to see different properties for a legal concept.

Consider the text of Paradise Lost by John Milton. If Stanley Fish, a noted Milton scholar, were to assign properties to the concepts in Book 1, his list of properties would be quite different from my list of properties. Same words, same text, but very different property lists.

To refine what I said about the topic map paradigm a bit earlier, it should read: “meaning of each concept depends on its role within a system of concepts [and the view of its hearer/reader]….

The hearer/reader being the paramount consideration. Without a hearer/reader, there is no concept or system of concepts or properties of either one for comparison.

When topics are merged, there is a collecting of properties, some of which you may recognize and some of which I may recognize, as identifying some concept or subject.

No guarantees but better than repeating your term for a concept over and over again, each time in a louder voice. šŸ˜‰

Functional data structures in JavaScript with Mori

Filed under: Functional Programming,Javascript — Patrick Durusau @ 1:47 pm

Functional data structures in JavaScript with Mori by Jesse Hallett.

From the post:

I have a long-standing desire for a JavaScript library that provides good implementations of functional data structures. Recently I found Mori, and I think that it may be just the library that I have been looking for. Mori packages data structures from the Clojure standard library for use in JavaScript code.

Functional Data Structures

A functional data structure (also called a persistent data structure) has two important qualities: it is immutable and it can be updated by creating a copy with modifications (copy-on-write). Creating copies should be nearly as cheap as modifying a comparable mutable data structure in place. This is achieved with structural sharing: pointers to unchanged portions of a structure are shared between copies so that memory need only be allocated for changed portions of the data structure.

A simple example is a linked list. A linked list is an object, specifically a list node, with a value and a pointer to the next list node, which points to the next list node. (Eventually you get to the end of the list where there is a node that points to the empty list.) Prepending an element to the front of such a list is a constant-time operation: you just create a new list element with a pointer to the start of the existing list. When lists are immutable there is no need to actually copy the original list. Removing an element from the front of a list is also a constant-time operation: you just return a pointer to the second element of the list….

Just in case you want to start practicing your functional programming in JavaScript.

I first saw this in Christophe Lalanne’s Bag of Tweets for November 2013.

eDiscovery

Filed under: e-Discovery,Law,Law - Sources — Patrick Durusau @ 12:25 pm

2013 End-of Year List of People Who Make a Difference in eDiscovery by Gerard. J. Britton.

Gerald has created a list of six (6) people who made a difference in ediscovery in 2013.

If ediscovery is unfamiliar, you have all of the issues of data/big data with an additional layer of legal rules and requirements.

Typically seen in litigation with high stakes.

A fruitful area for the application of semantic integration technologies, topic maps in particular.

December 16, 2013

Mapping 400,000 Hours of U.S. TV News

Filed under: Graphics,News,Visualization — Patrick Durusau @ 8:26 pm

Mapping 400,000 Hours of U.S. TV News by Roger Macdonald.

From the post:

We are excited to unveil a couple experimental data-driven visualizations that literally map 400,000 hours of U.S. television news. One of our collaborating scholars, Kalev Leetaru, applied ā€œfulltext geocodingā€ software to our entire television news research service collection. These algorithms scan the closed captioning of each broadcast looking for any mention of a location anywhere in the world, disambiguate them using the surrounding discussion (Springfield, Illinois vs Springfield, Massachusetts), and ultimately map each location. The resulting CartoDB visualizations provide what we believe is one of the first large-scale glimpses of the geography of American television news, beginning to reveal which areas receive outsized attention and which are neglected.

Stunning even for someone who thinks U.S. television news is self-obsessive.

In the rough early stages, but you need to see this.

Not that I expect it to change the coverage of U.S. television news, any more than campaign finance disclosure has made elected officials any the less promiscuous.

I first saw this in a tweet by Hilary Mason.

Data and visualization year in review, 2013

Filed under: Graphics,Visualization — Patrick Durusau @ 8:02 pm

Data and visualization year in review, 2013 by Nathan Yau.

Nathan has collected the high points of data visualization for 2013 in a very readable post.

If you are not already interested in data visualization, Nathan’s review of 2013 is likely to awaken that interest in you.

Enjoy!

Judge Wacks the NSA

Filed under: NSA,Privacy — Patrick Durusau @ 5:03 pm

Judge calls for phone data to be destroyed, says NSA program too broad by Jeff John Roberts.

From the post:

In a major rebuke to the National Security Agencyā€™s mass collection of telephone data, a federal judge ruled that the agencyā€™s surveillance program likely violates the Constitution and also granted two Verizon subscribersā€™ request for an order to destroy so-called meta-data.

On Monday in Washington,D.C., U.S. District Judge Richard Leon issued a ruling that ā€œbars the Government from collecting ā€¦ any telephony dataā€ associated with the Verizon account of two citizens who filed the lawsuit, and ā€œrequires the Government to destroy any such metadata in its possession that was collected through the bulk collection program.ā€

….

The judge also rejected the argument that the existence of a secret NSA court, known as the FISA court, precluded him from reviewing the surveillance program for constitutional questions.

ā€œWhile Congress has great latitude to create statutory scheme like FISA, it may not hang a cloak of secrecy over the Constitution,ā€ he wrote as part of the 68 page ruling.

See the decision at: Klayman NSA Decision and more at: Politico.

Good news but note the judge only ordered the destruction of records for two subscribers. And even that is stayed on appeal. Like they would really destroy the data anyway. How would you know?

Take this as a temporary victory.

Celebrate, yes, but regroup tomorrow to continue the fight.

The Real Privacy Problem

Filed under: BigData,Privacy — Patrick Durusau @ 4:50 pm

The Real Privacy Problem by Evgeny Morozov.

A deeply provocative essay that has me re-considering my personal position on privacy.

Not about my personal privacy.

A more general concern that the loss of privacy will lead to less and less transparency and accountability of corporations and governments.

Consider this passage from the essay:

If you think Simitis was describing a future that never came to pass, consider a recent paper on the transparency of automated prediction systems by Tal Zarsky, one of the worldā€™s leading experts on the politics and ethics of data mining. He notes that ā€œdata mining might point to individuals and events, indicating elevated risk, without telling us why they were selected.ā€ As it happens, the degree of interpretability is one of the most consequential policy decisions to be made in designing data-mining systems. Zarsky sees vast implications for democracy here:

A non-interpretable process might follow from a data-mining analysis which is not explainable in human language. Here, the software makes its selection decisions based upon multiple variables (even thousands) ā€¦ It would be difficult for the government to provide a detailed response when asked why an individual was singled out to receive differentiated treatment by an automated recommendation system. The most the government could say is that this is what the algorithm found based on previous cases.

This is the future we are sleepwalking into. Everything seems to work, and things might even be getting betterā€”itā€™s just that we donā€™t know exactly why or how.

Doesn’t that sound like the circumstances we find with the NSA telephone surveillance? No one denies that they broke the law, lied to Congress about it, etc. but they claim to have protected the U.S. public.

Really? And where is that information? Oh, some of it was shown to a small group of selected Senators and they thought some unspecified part of it looked ok, maybe.

I don’t know about you but that doesn’t sound like accountability or transparency to me.

Moreover the debate doesn’t even start in the right place. Violation of our telephone privacy is already a crime.

The NSA leadership and staff should be in the criminal dock when the questioning starts, not a hearing room on Capital Hill.

Moreover, “good faith” is not a defense to criminal conduct in the law. It really doesn’t matter than you thought your dog was telling to you to protect us from terrorists by engaging in widespread criminal activity. Even if you thought your dog was speaking for the Deity.

If there is no accountability and/or transparency on the part of government/corporatons, there is a driving desire to make citizens completely transparent and accountable to both government and corporations:

Habits, activities, and preferences are compiled, registered, and retrieved to facilitate better adjustment, not to improve the individualā€™s capacity to act and to decide. Whatever the original incentive for computerization may have been, processing increasingly appears as the ideal means to adapt an individual to a predetermined, standardized behavior that aims at the highest possible degree of compliance with the model patient, consumer, taxpayer, employee, or citizen.

What Simitis is describing here is the construction of what I call ā€œinvisible barbed wireā€ around our intellectual and social lives. Big data, with its many interconnected databases that feed on information and algorithms of dubious provenance, imposes severe constraints on how we mature politically and socially. The German philosopher JĆ¼rgen Habermas was right to warnā€”in 1963ā€”that ā€œan exclusively technical civilization ā€¦ is threatened ā€¦ by the splitting of human beings into two classesā€”the social engineers and the inmates of closed social institutions.ā€

The more data both the government and corporations collect, the less accountability and transparency they have and the more accountability and transparency they want to impose on the average citizen.

A very good reason why putting users in control of their data is a non-answer to the privacy question. Enabling users to “sell” their data just gives them the illusion of a choice when their choices are in fact dwindling with each bit of data that is collected.

All hope is not lost, see Morozov’s essay for some imaginative thinking on how to deepen and broaden the debate over privacy.

Some of the questions I would urge people to raise are:

  • Should websites be allowed to collect tracking data at all?
  • Should domestic phone traffic be tracked other than for billing and then discarded (hourly)?
  • Should credit card companies be allowed to keep purchase histories more than 30 days old?

In terms of slogans, consider this one: Data = Less Freedom. (D=LF)

Neo4j – Labels and Regression

Filed under: Cypher,Graphs,Neo4j — Patrick Durusau @ 3:43 pm

Yes, I am using labels in Neo4j but only because I am the only user of this data set. If I paint myself into a semantic corner, it will be my fault and not poor design.

In any event, I ran into an odd limitation on labels that may be of general interest.

My script was dying because my label read: “expert-Validation.”

Thinking the Neo4j documentation should have the answer, I consulted:

3.4.1 Label names:

Any non-empty unicode string can be used as a label name. In Cypher, you may need to use the backtick (`) syntax to avoid clashes with Cypher identifier rules. By convention, labels are written with CamelCase notation, with the first letter in upper case. For instance, User or CarOwner.

OK, so that’s encouraging, maybe I have run afoul of mathematical syntax or something.

Welllll, not quite.

8.3 Identifiers (under Cypher):

Identifier names are case sensitive, and can contain underscores and alphanumeric characters (a-z, 0-9), but must start with a letter. If other characters are needed, you can quote the identifier using backquote (`) signs.

The same rules apply to property names.

Sherman, set the WayBack Machine for 1986, we want to watch Charles Goldfarb write the name character provisions of ISO 8879:1986:

4.173 lower-case letters: Charcter class composed of the 26 unaccented small letters from “a” through “z”.

4.326 upper-case letters: Character class composed of the 26 capital letters from “A” through “Z”.

4.175 lower-case name start characters: Character class consisting of each lower-case name start character assigned by the concrete reference syntax.

4.328 upper-case name start characters: Character class consisting of upper-case forms of the corresponding lower-case name start characters.

4.94 digits: Character class composed of the 10 Arabic numerals from “0” to “9”.

4.174 lower-case name characters: Character class consisting of each lower-case name character assigned by the concrete reference syntax.

4.327 upper-case name start characters: Character class consisting of upper-case forms of the corresponding lower-case name characters.

I had the honor of knowing many of the contributors to the SGML standard, including its author, Charles Goldfarb.

But that was 1986. The Unicode project formally started two years later.

Over twenty-eight years after the SGML standard we have returned to name start characters and name characters (those not escaped by a “backtick”).

Is Unicode support really that uncommon in graph databases?

December 15, 2013

What is xkcd all about?…

Filed under: News,Reporting,Topic Models (LDA) — Patrick Durusau @ 9:10 pm

What is xkcd all about? Text mining a web comic by Jonathan Stray.

From the post:

I recently ran into a very cute visualization of the topics of XKCD comics. Itā€™s made using a topic modeling algorithm where the computer automatically figures out what topics xkcd covers, and the relationships between them. I decided to compare this xkcd topic visualization to Overview, which does a similar sort of thing in a different way (hereā€™s how Overviewā€™s clustering works).

Stand back, Iā€™m going to try science!

I knew that topic modeling had to have some practical use. šŸ˜‰

Jonathan uses the wildly popular xkcd comic to illustrate some of the features of Overview.

Emphasis on “some.”

Something fun to start the week with!

Besides, you are comparing topic modeling algorithms on a known document base.

What could be more work related than that?

Aberdeen – 1398 to Present

Filed under: Archives,Government Data,History,Semantics — Patrick Durusau @ 8:58 pm

A Text Analytic Approach to Rural and Urban Legal Histories

From the post:

Aberdeen has the earliest and most complete body of surviving records of any Scottish town, running in near-unbroken sequence from 1398 to the present day. Our central focus is on the ā€˜provincial townā€™, especially its articulations and interactions with surrounding rural communities, infrastructure and natural resources. In this multi-disciplinary project, we apply text analytical tools to digitised Aberdeen Burgh Records, which are a UNESCO listed cultural artifact. The meaningful content of the Records is linguistically obscured, so must be interpreted. Moreover, to extract and reuse the content with Semantic Web and linked data technologies, it must be machine readable and richly annotated. To accomplish this, we develop a text analytic tool that specifically relates to the language, content, and structure of the Records. The result is an accessible, flexible, and essential precursor to the development of Semantic Web and linked data applications related to the Records. The applications will exploit the artifact to promote Aberdeen Burgh and Shire cultural tourism, curriculum development, and scholarship.

The scholarly objective of this project is to develop the analytic framework, methods, and resource materials to apply a text analytic tool to annotate and access the content of the Burgh records. Amongst the text analytic issues to address in historical perspective are: the identification and analysis of legal entities, events, and roles; and the analysis of legal argumentation and reasoning. Amongst the legal historical issues are: the political and legal culture and authority in the Burgh and Shire, particularly pertaining to the management and use of natural resources. Having an understanding of these issues and being able to access them using Semantic Web/linked data technologies will then facilitate exploitation in applications.

This project complements a distinct, existing collaboration between the Aberdeen City & Aberdeenshire Archives (ACAA) and the University (Connecting and Projecting Aberdeenā€™s Burgh Records, jointly led by Andrew Mackillop and Jackson Armstrong) (the RIISS Project), which will both make a contribution to the project (see details on application form). This multi-disciplinary application seeks funding from Dot.Rural chiefly for the time of two specialist researchers: a Research Fellow to interpret the multiple languages, handwriting scripts, archaic conventions, and conceptual categories emerging from these records; and subcontracting the A-I to carry out the text analytic and linked data tasks on a given corpus of previously transcribed council records, taking the RFā€™s interpretation as input.

Now there’s a project for tracking changing semantics over the hills and valleys of time!

Will be interesting to see how they capture semantics that are alien to our own.

Or how they preserve relationships between ancient semantic concepts.

Data Science

Filed under: CS Lectures,Programming,Python — Patrick Durusau @ 8:49 pm

Data Science

Lectures on data science from the Harvard Extension School.

Twenty-two (22) lectures and ten (10) labs.

The lab sessions are instructor lead coding exercises with good visibility of the terminal window.

Possibly a format to follow in preparing other CS instructional material.

Lecture following by typing exercise of entering and understanding the code (when typos result in it not working).

I was reminded recently that Hunter Thompson typed novels by Ernest Hemingway and F. Scott Fitzgerald in order to learn their writing styles.

Would the same work for learning programming style? That you would begin to recognize patterns and options?

If nothing else, it give you some quality time with a debugger. šŸ˜‰

Clojure from the ground up

Filed under: Clojure,Programming — Patrick Durusau @ 8:21 pm

Clojure from the ground up by Kyle Kingsbury.

From the post:

This guide aims to introduce newcomers and experienced programmers alike to the beauty of functional programming, starting with the simplest building blocks of software. Youā€™ll need a computer, basic proficiency in the command line, a text editor, and an internet connection. By the end of this series, youā€™ll have a thorough command of the Clojure programming language.

The current posts look good and I am looking forward to further posts in this series.

Cheat Sheet: Hive for SQL Users

Filed under: Hive,SQL — Patrick Durusau @ 4:04 pm

Cheat Sheet: Hive for SQL Users

What looks like a very useful quick reference to have on or near your desk.

I say “looks like” because so far I haven’t found a way to capture the file for printing.

On Hortonworks (link above), it displays in a slideshare-like window. You can scroll, mail to to others, etc., but no save-file.

I searched for the title and found another copy at Slideshare.

If you are guessing that means I can save it to my Slideshare folder, right in one. That still doesn’t get it to my local machine.

It does have all the major social networks listed for you to share/embed the slides.

But why would I want to propagate this sort of annoyance?

Better that I ask readers of this blog to ping Hortonworks and ask that the no-download approach in:

http://hortonworks.com/resources/lander/?ps_paper_name=sql-to-hive-cheat-sheet

not be repeated. (Politely. Hortonworks has done an enormous about of work on the Hadoop ecosystem, all on its own dime. This is probably just poor judgment on the part of a non-techie in a business office somewhere.)

December 14, 2013

Wine Descriptions and What They Mean

Filed under: Graphics,Uncategorized,Visualization — Patrick Durusau @ 8:20 pm

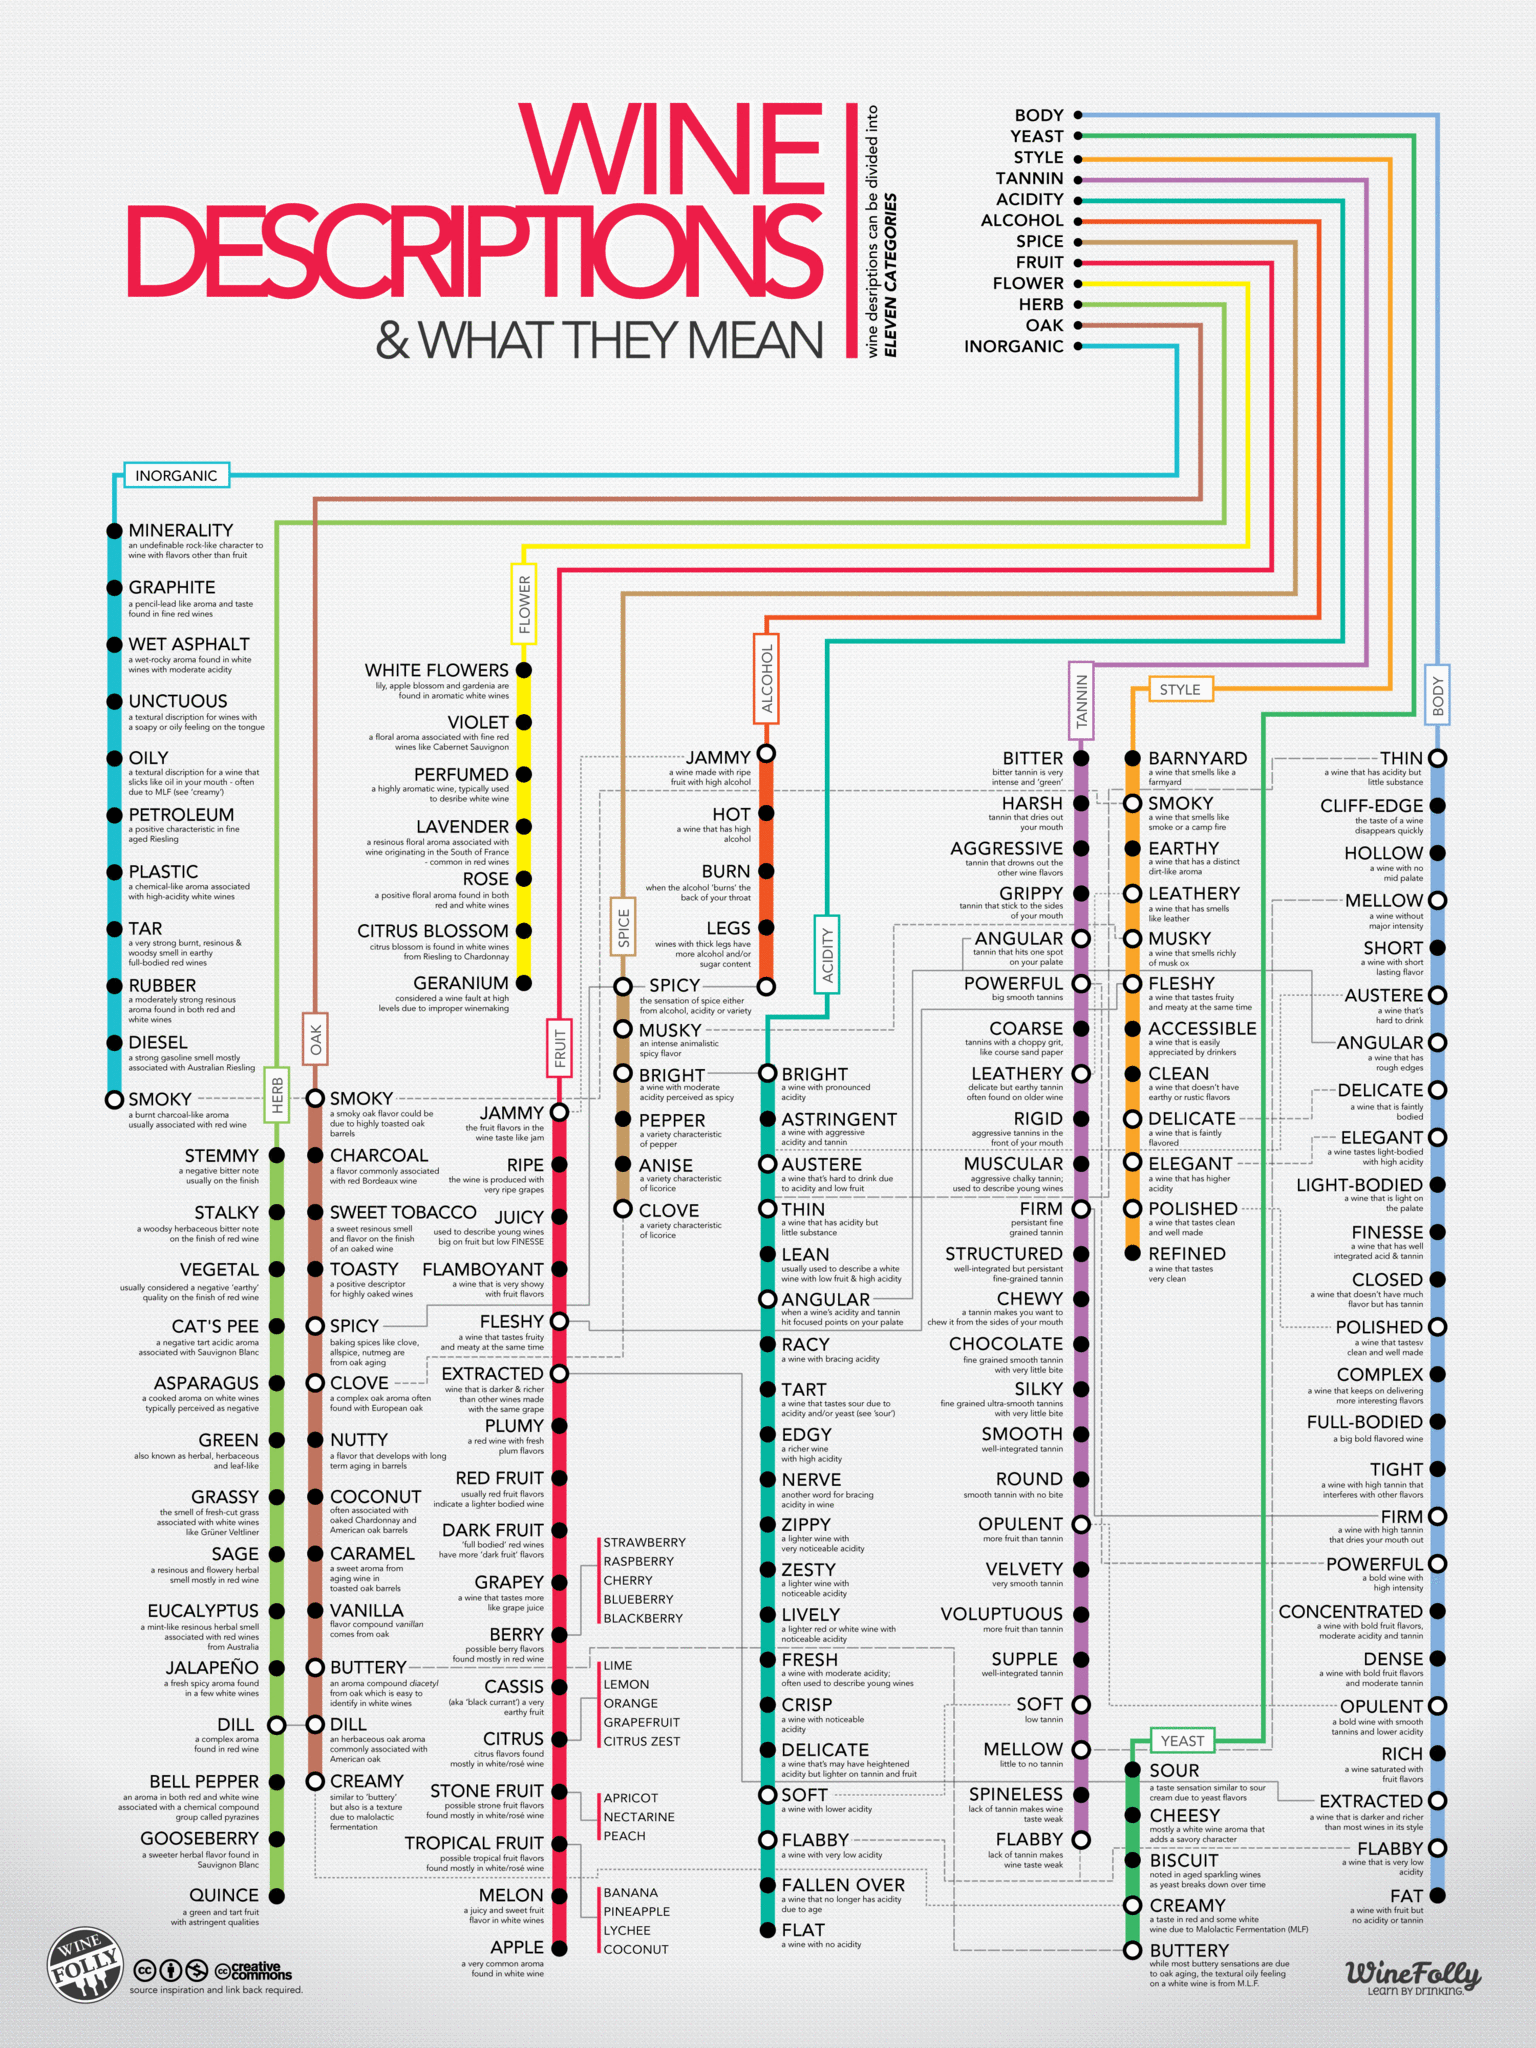
Wine Descriptions and What They Mean

wine chart

At $22.80 for two (2), you need one of these for your kitchen and another for the office.

Complex information doesn’t have to be displayed in a confusing manner.

This chart is evidence of that proposition.

BTW, the original site (see above) is interactive, zooms, etc.

« Newer PostsOlder Posts »

Powered by WordPress