Cassandra 2.0.0 (2nd beta) was released today.
See the release notes.
Sounds like a release of 2.0.0 is coming soon.
Make it a solid one with your participation in testing the current beta release.
Cassandra 2.0.0 (2nd beta) was released today.
See the release notes.
Sounds like a release of 2.0.0 is coming soon.
Make it a solid one with your participation in testing the current beta release.
LibraryThing has a new homepage!
I should have asked if you like to read books first. 😉
What is LibraryThing?
LibraryThing is a cataloging and social networking site for book lovers.
LibraryThing helps you create a library-quality catalog of books: books you own, books you’ve read, books you’d like to read, books you’ve lent out … whatever grouping you’d like.
Since everyone catalogs online, they also catalog together. You can contribute tags, ratings and reviews for a book, and Common Knowledge (facts about a book or author, like character names and awards), as well as participate in member forums or join the Early Reviewers program. Everyone gets the benefit of everyone else’s work. LibraryThing connects people based on the books they share.
New modules, new features and of course, books!
Social networking opportunity for book lovers.
You may find other people who own a copy of Sowa’s “Knowledge Representation,” Eco’s “A Theory of Semiotics,” and the “Anarchist Cookbook.” 😉
Building a Real-time, Big Data Analytics Platform with Solr by Trey Grainger.
Description:
Having “big data” is great, but turning that data into actionable intelligence is where the real value lies. This talk will demonstrate how you can use Solr to build a highly scalable data analytics engine to enable customers to engage in lightning fast, real-time knowledge discovery.
At CareerBuilder, we utilize these techniques to report the supply and demand of the labor force, compensation trends, customer performance metrics, and many live internal platform analytics. You will walk away from this talk with an advanced understanding of faceting, including pivot-faceting, geo/radius faceting, time-series faceting, function faceting, and multi-select faceting. You’ll also get a sneak peak at some new faceting capabilities just wrapping up development including distributed pivot facets and percentile/stats faceting, which will be open-sourced.
The presentation will be a technical tutorial, along with real-world use-cases and data visualizations. After this talk, you’ll never see Solr as just a text search engine again.
Trey proposes a paradigm shift from document retrieval with Solr and towards returning aggregated information as a result of Solr searches.
Brief overview of faceting with examples of different visual presentations of returned facet data.
Rocking demonstration of the power of facets to power analytics! (Caveat: Yes, facets can do that, but good graphics is another skill entirely.)
Every customer has their own Solr index. (That’s a good idea.)
Implemented A/B testing using Solr. (And shows how he created it.)
This is a great presentation!
BTW, Trey is co-authoring: Solr in Action.
Improve search relevancy by telling Solr exactly what you want by Doug Turnbull.
From the post:
To be successful, (e)dismax relies on avoiding a tricky problem with its scoring strategy. As we’ve discussed, dismax scores documents by taking the maximum score of all the fields that match a query. This is problematic as one field’s scores can’t easily be related to another’s. A good “text” match might have a score of 2, while a bad “title” score might be 10. Dismax doesn’t have a notion that “10” is bad for title, it only knows 10 > 2, so title matches dominate the final search results.
The best case for dismax is that there’s only one field that matches a query, so the resulting scoring reflects the consistency within that field. In short, dismax thrives with needle-in-a-haystack problems and does poorly with hay-in-a-haystack problems.
We need a different strategy for documents that have fields with a large amount of overlap. We’re trying to tell the difference between very similar pieces of hay. The task is similar to needing to find a good candidate for a job. If we wanted to query a search index of job candidates for “Solr Java Developer”, we’ll clearly match many different sections of our candidates’ resumes. Because of problems with dismax, we may end up with search results heavily sorted on the “objective” field.
(…)
Not unlike my comments yesterday about the similarity of searching and playing the lottery. The more you invest in the search, the more likely you are to get good results.
Doug analyzes what criteria should data meet in order to be a “good” result.
For a topic map, I would analyze what data does a subject need in order to be found by a typical request.
Both address the same problem, search, but from very different perspectives.
Lucene: http://lucene.apache.org/core/mirrors-core-latest-redir.html
Solr: http://lucene.apache.org/solr/mirrors-solr-latest-redir.html
If you follow Lucene/Solr you have probably already heard the news.
There are nineteen (19) new features in Lucene and twenty (20) in Solr so don’t neglect the release notes.
Spend some time with both releases. I don’t think you will be disappointed.
Exploring ElasticSearch: A human-friendly tutorial for ElasticSearch. by Andrew Cholakian.
An incomplete tutorial on ElasticSearch.
However, unlike printed (dead tree) and pdf (dead electrons), you can suggest additional topics and I suspect that useful comments would be appreciated as well.
A “live” tutorial on popular software like ElasticSearch, that follows the software as it develops, could prove to be almost as popular as the software itself.
Astronomer uses Kepler telescope’s data in hunt for spacecraft from other worlds by Peter Brannen.
From the post:
In the field of planet hunting, Geoff Marcy is a star. After all, the astronomer at the University of California at Berkeley found nearly three-quarters of the first 100 planets discovered outside our solar system. But with the hobbled planet-hunting Kepler telescope having just about reached the end of its useful life and reams of data from the mission still left uninvestigated, Marcy began looking in June for more than just new planets. He’s sifting through the data to find alien spacecraft passing in front of distant stars.
He’s not kidding — and now he has the funding to do it.
Great read!
BTW, if you want to search older data (older than Kepler) for alien spacecraft, consider the digitized Harvard College Observatory Astronomical Plate Stacks. The collection runs from 1885-1993. Less than ten (10%) of it has been digitized and released.
GraphChi-cpp/java have reached 0.2 and are now hosted at Github!
From the release notes:
!GraphChi version 0.2 is the first major update to the !GraphChi software for disk-based computation on massive graphs. This upgrade brings two major changes: compressed data storage (shards) and support for dynamically sized edges.
We also thank for your interest on GraphChi so far: since the release in July 9th 2012, there has been over 8,000 unique visitors to the Google Code project page, at least 2,000 downloads of the source package, several blog posts and hundreds of tweets. GraphChi is a research project, and your feedback has helped us tremendously in our work.
Enjoy!
…Sentry: Fine-Grained Authorization for Impala and Apache Hive
From the post:
Cloudera, the leader in enterprise analytic data management powered by Apache Hadoop™, today unveiled the next step in the evolution of enterprise-class big data security, introducing Sentry: a new Apache licensed open source project that delivers the industry’s first fine-grained authorization framework for Hadoop. An independent security module that integrates with open source SQL query engines Apache Hive and Cloudera Impala, Sentry delivers advanced authorization controls to enable multi-user applications and cross-functional processes for enterprise datasets. This level of granular control, available for the first time in Hadoop, is imperative to meet enterprise Role Based Access Control (RBAC) requirements of highly regulated industries, like healthcare, financial services and government. Sentry alleviates the security concerns that have prevented some organizations from opening Hadoop data systems to a more diverse set of users, extending the power of Hadoop and making it suitable for new industries, organizations and enterprise use cases. Concurrently, the company confirmed it plans to submit the Sentry security module to the Apache Incubator at the Apache Software Foundation later this year.
Welcome news but I could not bring myself to include all the noise words in the press release title. 😉
For technical details, see: http://cloudera.com/content/cloudera/en/Campaign/introducing-sentry.html.
Just a word of advice: This doesn’t “solve” big data security issues. It is one aspect of big data security.
Another aspect of big data security is not allowing people to bring in and leave your facility with magnetic media. Ever.
Not to mention using glue to permanently close all USB ports and CD/DVD drives.
There is always tension between how much security do you need versus the cost and inconvenience.
Another form of security: Have your supervisor’s approval in writing for deviations from known “good” security practices.
Integrating Linked Data into Discovery by Götz Hatop.
Abstract:
Although the Linked Data paradigm has evolved from a research idea to a practical approach for publishing structured data on the web, the performance gap between currently available RDF data stores and the somewhat older search technologies could not be closed. The combination of Linked Data with a search engine can help to improve ad-hoc retrieval. This article presents and documents the process of building a search index for the Solr search engine from bibliographic records published as linked open data.
Götz makes an interesting contrast between the Semantic Web and Solr:
In terms of the fast evolving technologies in the web age, the Semantic Web can already be called an old stack. For example, RDF was originally recommended by the W3C on the February 22, 1999. Greenberg [8] points out many similarities between libraries and the Semantic Web: Both have been invented as a response to information abundance, their mission is grounded in service and information access, and libraries and the Semantic Web both benefit from national and international standards. Nevertheless, the technologies defined within the Semantic Web stack are not well established in libraries today, and the Semantic Web community is not fully aware of the skills, talent, and knowledge that catalogers have and which may be of help to advance the Semantic Web.
On the other hand, the Apache Solr [9] search system has taken the library world by storm. From Hathi Trust to small collections, Solr has become the search engine of choice for libraries. It is therefore not surprising, that the VuFind discovery system uses Solr for its purpose, and is not built upon a RDF triple store. Fortunately, the software does not make strong assumptions about the underlying index structure and can coexist with non-MARC data as soon as these data are indexed conforming to the scheme provided by VuFind.
The lack of “…strong assumptions about the underlying index structure…” enables users to choose their own indexing strategies.
That is an indexing strategy is not forced on all users.
You could just as easily say that no built-in semantics are forced on users by Solr.
Want Solr success for topic maps?
Free users from built-in semantics. Enable them to use topic maps to map their models, their way.
Or do we fear the semantics of others?
Crafting Linked Open Data for Cultural Heritage: Mapping and Curation Tools for the Linked Jazz Project by M. Cristina Pattuelli, Matt Miller, Leanora Lange, Sean Fitzell, and Carolyn Li-Madeo.
Abstract:
This paper describes tools and methods developed as part of Linked Jazz, a project that uses Linked Open Data (LOD) to reveal personal and professional relationships among jazz musicians based on interviews from jazz archives. The overarching aim of Linked Jazz is to explore the possibilities offered by LOD to enhance the visibility of cultural heritage materials and enrich the semantics that describe them. While the full Linked Jazz dataset is still under development, this paper presents two applications that have laid the foundation for the creation of this dataset: the Mapping and Curator Tool, and the Transcript Analyzer. These applications have served primarily for data preparation, analysis, and curation and are representative of the types of tools and methods needed to craft linked data from digital content available on the web. This paper discusses these two domain-agnostic tools developed to create LOD from digital textual documents and offers insight into the process behind the creation of LOD in general.
The Linked Data Jazz Name Directory:
consists of 8,725 unique names of jazz musicians as N-Triples.
It’s a starting place if you want to create a topic map about Jazz.
Although, do be aware the Center for Arts and Cultural Policy Studies at Princeton University reports:
Although national estimates of the number of jazz musicians are unavailable, the Study of Jazz Artists 2001 estimated the number of jazz musicians in three metropolitan jazz hubs — New York, San Francisco, and New Orleans — at 33,003, 18,733, and 1,723, respectively. [A total of 53,459. How Many Jazz Musicians Are There?]
And that is only for one point in time. It does not include jazz musicians who perished before the estimate was made.
Much work remains to be done.
If you like the videos and slides from GraphLab 2013, follow the authors for their latest research!
I created a listing of DBLP links (Linkedin links where I could not find a DBLP author listing) for the participants at GraphLab 2013.
Thought you might find it useful:
Presentations:
Posters:
Demos:
You have to feel lucky to use an Internet search engine or play the lottery.
Similar activities.
With the lottery, you and the lottery invest very little effort in the result, but you are hopeful of a high payoff.
With an Internet search, you and the search provider invest very little in semantics, but you hope for a “smoking gun” result for your search.
“Something for nothing” is a popular wish but it is just that, a wish.
Not to say some searches do turn up “the” best answer. But then some people do win the lottery.
Not to mention it is hard to not “win” with a search. Even an obscure one will (reported to the user) result in several hundred thousand search “hits.”
See how good you are! How much information there is on your subject! But nobody ever looks at the 100,000th “hit” to see.
If you do “win” a search, by finding the perfect answer/data/document, do you keep it where others can find it?
Or do you toss it back into the sea of data for someone else to be lucky enough to find?
Is your retirement plan based on playing the lottery?
If not, why is your business plan based on Internet searches?
From the webpage:
The Microbial Life Database (MLD) is a project under continuos development to visualize the ecological, physiological and morphological diversity of microbial life. A database is being constructed including data for nearly 600 well-known prokaryote genera mostly described in Bergey’s Manual of Determinative Bacteriology and published by the Bergey’s Trust. Correction and additions come from many other sources. The database is divided by genera but we are working on a version by species. This is the current database v02 in Google Spreadsheets format. Below is a bubble chart of the number of species included in each of the microbial groups. You can click the graph to go to an interactive version with more details. If you want to contribute to this database please send an email to Prof. Abel Mendez.
I don’t have any immediate need for this data set but it is the sort of project where semantic reefs are found. 😉
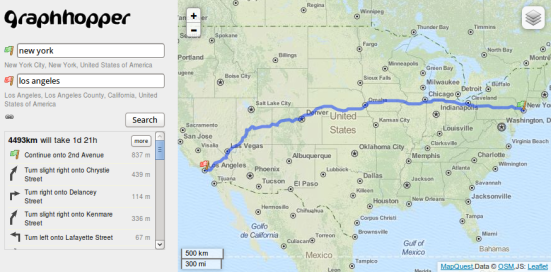
GraphHopper Maps – High Performance and Customizable Routing in Java by Peter Karich.
From the post:
Today we’re proud to announce the first stable release of GraphHopper! After over a year of busy development we finally reached version 0.1!
GraphHopper is a fast and Open Source road routing engine written in Java based on OpenStreetMap data. It handles the full planet on a 15GB server but is also scales down and can be embedded into your application! This means you’re able to run Germany-wide queries on Android with only 32MB in a few seconds. You can download the Android offline routing demo or have a look at our web instance which has world wide coverage for car, bike and pedestrian:
The trip to the current state of GraphHopper was rather stony as we had to start from scratch as there is currently no fast Java-based routing engine. What we’ve built is quite interesting as it shows that a Java application can be as fast as Bing or Google Maps (in 2011) and beats YOURS, MapQuest and Cloudmade according to the results outlined in a Blog post from Pascal and with tests against GraphHopper – although OSRM is still ahead. But how can a Java application be so fast? One important side is the used algorithm: Contraction Hierarchies – a ‘simple’ shortcutting technique to speed up especially lengthy queries. But even without this algorithm GraphHopper is fast which is a result of weeks of tuning for less memory consumption (yes, memory has something to do with speed), profiling and tweaking. But not only the routing is fast and memory efficient also the import process. And it should be easy to get started and modify GraphHopper to your needs.
Contraction hierarchies are a very active area of graph research.
Contraction Hierarchies at Wikipedia has a nice coverage with a pointer to Robert Geisberger’s thesis, Contraction Hierarchies: Faster and Simpler
Hierarchical Routing in Road Networks.
You may also be interested in:
Efficient Route Planning by Prof. Dr. Hannah Bast. A wiki for a 2012 summer course on route planning. Includes videos, slides, exercises, etc.
I have posted about FreeLing before but this web-based demo merits separate mention.
If you are not familiar with natural language processing (NLP), visit the FreeLing 3.0 demo and type in some sample text.
Not suitable for making judgements on proposed NLP solutions but it will give you a rough idea of what is or is not possible.
Sites and Services for Accessing Data by Andy Kirk.
From the site:
This collection presents the key sites that provide data, whether through curated collections, offering access under the Open Data movement or through Software/Data-as-a-Service platforms. Please note, I may not have personally used all the services, sites or tools presented but have seen sufficient evidence of their value from other sources. Also, to avoid re-inventing the wheel, descriptive text may have been reproduced from the native websites for many resources.
You will see there is clearly a certain bias towards US and UK based sites and services. This is simply because they are the most visible, most talked about, most shared and/or useful resources on my radar. I will keep updating this site to include as many other finds and suggestions as possible, extending (ideally) around the world.
I count ninety-nine (99) resources.
A well organized listing but like many other listings, you have to explore each resource to discover its contents.
A mapping of resources across collections would be far more useful.
From the webpage:
XML Calabash is an implementation of XProc: An XML Pipeline Language.
See the XML Calabash project status page for more details.
You can download Calabash and/or read the (very little bit of) documentation. Calabash also ships with the
xml editor (as does Saxon-EE which includes support for validation with W3C XML Schema).
A new release of Calabash reminded me that I needed to update some of my XML tooling.
If you are looking for an opportunity to write documentation, this could be your lucky day! 😉
imMens: Real-Time Interactive Visual Exploration of Big Data by Zhicheng Liu.
From the post:
Interactive visualization of large datasets is key in making big data technologies accessible to a wide range of data users. However, as datasets expand in size, they challenge traditional methods of interactive visual analysis, forcing data analysts and enthusiasts to spend more time on “data munging” and less time on analysis. Or to abandon certain analyses altogether.
At the Stanford Visualization Group, as part of the Intel Science and Technology Center for Big Data, we are developing imMens, a system that enables real-time interaction of billion+ element databases by using scalable visual summaries. The scalable visual representations are based on binned aggregation and support a variety of data types: ordinal, numeric, temporal and geographic. To achieve interactive brushing & linking between the visualizations, imMens precomputes multivariate data projections and stores these as data tiles. The browser-based front-end dynamically loads appropriate data tiles and uses WebGL to perform data processing and rendering on the GPU.
The first challenge we faced in designing imMens was how to make visualizations with a huge number of data points interpretable. Over-plotting is a typical problem even with thousands of data points. We considered various data reduction techniques. Sampling, for example, picks a subset of the data, but is still prone to visual cluttering. More importantly, sampling can miss interesting patterns and outliers. Another idea is binned aggregation: we define bins over each dimension, count the number of data points falling within each bin, and then visualize the density of data distribution using histograms or heatmaps. Binned aggregation can give a complete overview of the data without omitting local features such as outliers.
(…)
If you want to know more about imMens, we encourage you to visit the project website, which showcases our EuroVis ’13 paper, video and online demos.
imMens will be released on Github soon. Stay tuned!
Bearing in mind these are pre-computed data tiles along only a few projections, the video is still a rocking demonstration of interactivity.
Or to put it another way, the interactivity is “real-time” but the data processing to support the interactivity is not.
Not a criticism but an observation. An observation that should make you ask which data projections have been computed and which one have not been computed.
The answers you get and their reliability will depend upon choices that were made and data that was omitted and so not displayed by the interface.
Still, the video makes me wonder about interactive merging would be like, along a similar number of axes?
Are pre-computed data projections in your topic map future?
fastcluster: Fast Hierarchical, Agglomerative Clustering Routines for R and Python by Daniel Müllner.
Abstract:
The fastcluster package is a C++ library for hierarchical, agglomerative clustering. It provides a fast implementation of the most efficient, current algorithms when the input is a dissimilarity index. Moreover, it features memory-saving routines for hierarchical clustering of vector data. It improves both asymptotic time complexity (in most cases) and practical performance (in all cases) compared to the existing implementations in standard software: several R packages, MATLAB, Mathematica, Python with SciPy.
Builds upon the author’s prior work: Modern hierarchical, agglomerative clustering algorithms.
Both papers are worth your time or you can cut to the chase with the packages you will find here.
When you stop to think about it, merging (as in topic maps) is just clustering followed by processing of members of the cluster.
Which should open merging up to the use of any number of clustering algorithms, depending upon what subjects you want to talk about.
Apache OpenOffice 4.0 Released!
From the release notes:
Apache OpenOffice 4.0 is now available for download from our official download page. Building upon the great success of the OpenOffice 3.4 release, which has seen over 57 million downloads, this major update brings exciting new features, enhancements and bug fixes. OpenOffice 4.0 features an innovative new Sidebar user interface, additional language support for 22 languages (including 3 new languages), 500 bug fixes, improvements in Microsoft Office interoperability, enhancements to drawing/graphics, performance improvements, etc. You can read the details of these later in these Release Notes.
One other thing that you will notice immediately, on this page, our website and in other places, is our new logo. The new logo is the result of many design iterations, collaboration among talented designers and a contest where 40 logos were rated by over 50,000 users.
We wish to give a special “hello” to our upgrading users. We hope you like the new features, especially the Sidebar UI. This feature was based on code contributed by IBM, from their Lotus Symphony product. We adapted that code, and based on several rounds of feedback from users like you, improved it and integrated it into OpenOffice.
And for new users, welcome to the community! We hope you enjoy using Apache OpenOffice, the leading free and open office productivity suite.
As the OpenDocument Format (ODF) editor, I must confess a bias in favor of applications that use ODF. 😉
I am downloading a copy of Apache OpenOffice 4.0 in the background as I write this post.
You should too!
BTW, OpenDocument Format 1.3 (draft) is underway. If you have specific features or needs, contributing expertise (not just your request) to the ODF Technical Committee at OASIS will move applications such as Apache OpenOffice towards meeting your needs.
GraphLab Workshop 2013 – Videos!
Simply awesome!
Here you will find videos and slides for:
Now you are sorry you did not attend GraphLab Workshop 2013. I tried to warn you. 😉
Best remedy is to start planning your rationale to attend next year.
Oh, and do watch the videos. What I have seen so far is great!
From the webpage:
Welcome to the community-driven documentation site for the Clojure programming language.
Read, use, contribute. What more could you want?
PPDB: The Paraphrase Database by Juri Ganitkevitch, Benjamin Van Durme and Chris Callison-Burch.
Abstract:
We present the 1.0 release of our paraphrase database, PPDB. Its English portion, PPDB:Eng, contains over 220 million paraphrase pairs, consisting of 73 million phrasal and 8 million lexical paraphrases, as well as 140 million paraphrase patterns, which capture many meaning-preserving syntactic transformations. The paraphrases are extracted from bilingual parallel corpora totaling over 100 million sentence pairs and over 2 billion English words. We also release PPDB:Spa, a collection of 196 million Spanish paraphrases. Each paraphrase pair in PPDB contains a set of associated scores, including paraphrase probabilities derived from the bitext data and a variety of monolingual distributional similarity scores computed from the Google n-grams and the Annotated Gigaword corpus. Our release includes pruning tools that allow users to determine their own precision/recall tradeoff.
A resource that should improve your subject identification!
PPDB data sets range from 424MB 6.8M rules to 5.7 GB, 86.4 rules. Download PPDB data sets.
Videos of the presentations at the 2013 Conference of the North American Chapter of the Association for Computational Linguistics.
Along with the papers, you should not lack for something to do over the summer!
Named Entities in Law & Order Episodes by Yhat.
A worked example of using natural language processing on a corpus of viewer summaries of episodes of Law & Order and Law & Order: Special Victims Unit.
The data is here.
Makes me wonder if there is a archive of the soap operas that have been on for decades?
They survived because they have supporting audiences. Suspect a resource about the same would as well.
Dashboard Requirement Gathering Satire by Nick Barclay.
From the post:
A colleague of mine put together a hilarious PeepzMovie that was inspired by some frustrating projects we’re working on currently.
If you’re a BI pro, do yourself a favor and take a few mins to watch it.
Watch the video at Nick’s post.
Show of hands: Who has not had this experience when developing requirements?
😉
Big Data on the Big Data Conversation: Tracking the NSA Story by Nicholas Hartman.
From the post:
Recent revelations regarding the National Security Agency’s (NSA) extensive data interception and monitoring practices (aka PRISM) have brought a branch of “Big Data’s” research into the broader public light. The basic premise of such work is that computer algorithms can study vast quantities of digitized communication interactions to identify potential activities and persons of interest for national security purposes.
A few days ago we wondered what could be found by applying such Big Data monitoring of communications to track the conversational impact of the NSA story on broader discussions about Big Data. This brief technical note highlights some of our most basic findings.
Our communication analytics work is usually directed at process optimization and risk management. However, in this case we applied some of the most basic components of our analytics tools towards public social media conversations—specifically tweets collected via Twitter’s streaming API. Starting last summer, we devoted a small portion of our overall analytical compute resources towards monitoring news and social media sites for evolving trends within various sectors including technology. A subset of this data containing tweets on topics related to Big Data is analyzed below.
Interesting analysis of big data (communications) relative to the NSA’s PRISM project.
While spotting trends in data is important, have you noticed that leaks are acts by single individuals?
If there is a pattern in mass data that precedes leaking, it hasn’t been very effective at stopping leaks.
Rather than crunching mass data, shouldn’t pattern matching be applied to the 1,409,969 Americans who hold top secret security clearance? (Link is to the 2012 Report on Security Clearance Determinations.)
Targeted data crunching as opposed to random data crunching.
In Praise of the Silo by Neil Ward-Dutton
From the post:
Every organisational feature – including silos – is an outcome of some kind of optimisation. By talking about trying to destroy silos, we’re denying the sometimes very rational reasons behind their creation.
I’ve been travelling to conferences throughout North America and Europe a fair bit over the past quarter, and I’ve seen a lot of people present about business transformation, business architecture and BPM initiatives. One thing I’ve heard presenters talk about in a reasonable number of sessions (I estimate somewhere around 30%) is the need to ‘destroy silos’.
I have a background in architecture and integration, and for a long time I used to think the same. Silos are bad. Silos beget duplication; wheel-reinvention; contradiction; waste. Silos are really bad.
Except…
It turns out that ‘bad’ here really depends on your point of view. Silos aren’t actually ‘bad’, or ‘good’ for that matter. They’re optimisations – just as everything that every organisational, social or technical feature is an optimisation that serves one purpose or other. Silos are what happens when you optimise part of a business for expediency.
(…)
Another aspect of silos that should be mentioned is compartmentalizing information. Avoids the unlikely scenario where some sysadmin can copy masses of data that should not be commonly available.
Silos were reduced following 9/11 in the mania to “connect the dots.”
“Connecting more dots” isn’t a bad information strategy, as least as far as sound-bite strategies go.
The critical question of “who” was responsible for connecting “what” dots was left unanswered.
For example, the treasure trove of diplomatic cables leaked by Private Bradley Manning was just a data dump from the State Department.
Not really suitable for anything other than being a leak.
How do you connects “dots” with cables that run from catty remarks about personal appearance to reports about low level activities in Afghanistan?
Assuming meaningful access was solved, who is responsible for looking at the material to make the connections?
Having a large store of data you could look at but don’t, doesn’t solve the “connect the dots” problem.
Rather than reducing silos because it is another popular sound-bite information strategy, why not ask who needs access to the silo and for what?
What is the business case for creating mappings into and out of the silo?
And who will use the results of those mappings?
If you can’t answer those last two questions, you need to reconsider breaking silos that are otherwise serving some purpose unknown to you.
11 Billion Clues in 800 Million Documents: A Web Research Corpus Annotated with Freebase Concepts by Dave Orr, Amar Subramanya, Evgeniy Gabrilovich, and Michael Ringgaard.
From the post:
When you type in a search query — perhaps Plato — are you interested in the string of letters you typed? Or the concept or entity represented by that string? But knowing that the string represents something real and meaningful only gets you so far in computational linguistics or information retrieval — you have to know what the string actually refers to. The Knowledge Graph and Freebase are databases of things, not strings, and references to them let you operate in the realm of concepts and entities rather than strings and n-grams.
We’ve previously released data to help with disambiguation and recently awarded $1.2M in research grants to work on related problems. Today we’re taking another step: releasing data consisting of nearly 800 million documents automatically annotated with over 11 billion references to Freebase entities.
These Freebase Annotations of the ClueWeb Corpora (FACC) consist of ClueWeb09 FACC and ClueWeb12 FACC. 11 billion phrases that refer to concepts and entities in Freebase were automatically labeled with their unique identifiers (Freebase MID’s). …
(…)
Based on review of a sample of documents, we believe the precision is about 80-85%, and recall, which is inherently difficult to measure in situations like this, is in the range of 70-85%….
(…)
Evaluate precision and recall by asking:
Your GPS gives you relevant directions on an average eight (8) times out of ten and it finds relevant locations on average of seven (7) times out of ten (10). (Wikipedia on Precision and Recall)
Is that a good GPS?
A useful data set but still a continuation of the approach of guessing what authors meant when they authored documents.
What if by some yet unknown technique, precision goes to nine (9) out of ten (10) and recall goes to nine (9) out of ten (10) as well?
The GPS question becomes:
Your GPS gives you relevant directions on an average nine (9) times out of ten and it finds relevant locations on average of nine (9) times out of ten (10).
Is that a good GPS?
Not that any automated technique has shown that level of performance.
Rather than focusing on data post-authoring, why not enable authors to declare their semantics?
Author declared semantics would reduce the cost and uncertainty of post-authoring semantic solutions.
I first saw this in a tweet by Nicolas Torzec.
Powered by WordPress