Another Word For It Patrick Durusau on Topic Maps and Semantic Diversity

March 25, 2013

Under the Hood: Building out the infrastructure for Graph Search

Filed under: Facebook,Graphs,Networks — Patrick Durusau @ 10:32 am

Under the Hood: Building out the infrastructure for Graph Search by Sriram Sankar, Soren Lassen, and Mike Curtiss.

From the post:

In the early days, Facebook was as much about meeting new people as keeping in touch with people you already knew at your college. Over time, Facebook became more about maintaining connections. Graph Search takes us back to our roots and helps people make new connections–this time with people, places, and interests.

With this history comes several old search systems that we had to unify in order to build Graph Search. At first, the old search on Facebook (called PPS) was keyword based–the searcher entered keywords and the search engine produced a results page that was personalized and could be filtered to focus on specific kinds of entities such as people, pages, places, groups, etc.

Entertaining overview of the development of the graph solution for Facebook.

Moreover, reassurance if you are worried about “scaling” for your graph application. 😉

I first saw this at: This Week’s Links by Trevor Landau.

Introduction to C and C++

Filed under: C/C++,CS Lectures,Programming — Patrick Durusau @ 10:19 am

Introduction to C and C++

Description:

This course provides a fast-paced introduction to the C and C++ programming languages. You will learn the required background knowledge, including memory management, pointers, preprocessor macros, object-oriented programming, and how to find bugs when you inevitably use any of those incorrectly. There will be daily assignments and a small-scale individual project.

This course is offered during the Independent Activities Period (IAP), which is a special 4-week term at MIT that runs from the first week of January until the end of the month.

Just in case you want a deeper understanding of bugs that enable hacking or how to avoid creating such bugs in the first place.

…Cloud Computing is Changing Data Integration

Filed under: Cloud Computing,Data Integration,Topic Maps — Patrick Durusau @ 4:51 am

More Evidence that Cloud Computing is Changing Data Integration by David Linthicum.

From the post:

In a recent Sand Hill article, Jeff Kaplan, the managing director of THINKstrategies, reports on the recent and changing state of data integration with the addition of cloud computing. “One of the ongoing challenges that continues to frustrate businesses of all sizes is data integration, and that issue has only become more complicated with the advent of the cloud. And, in the brave new world of the cloud, data integration must morph into a broader set of data management capabilities to satisfy the escalating needs of today’s business.”

In the article, Jeff reviews a recent survey conducted with several software vendors, concluding:

  • Approximately 90 percent of survey respondents said integration is important in their ability to win new customers.
  • Eighty-four percent of the survey respondents reported that integration has become a difficult task that is getting in the way of business.
  • A quarter of the respondents said they’ve still lost customers because of integration issues.

It’s interesting to note that these issues affect legacy software vendors, as well as Software-as-a-Service (SaaS) vendors. No matter if you sell software in the cloud or deliver it on-demand, the data integration issues are becoming a hindrance.

If cloud computing and/or big data are bringing data integration into the limelight, that sounds like good news for topic maps.

Particularly topic maps of data sources that enable quick and reliable data integration without a round of exploration and testing first.

One Definition of “Threat”

Filed under: Government — Patrick Durusau @ 4:39 am

If you are using a topic map to track terrorism, here is another definition of “threat” for your map.

The city of Casper, Wyoming, population of about 55,000, was threatened on www.4chan.org with a threat summarized as:

The post threatened to employ kitchen knives, an aluminum baseball bat, and a hammer and wooden stake — in addition to handguns — to prove that a “high score” could be achieved without assault rifles.

According to Government Security News:

As a result of the threat, officials immediately took precautions that included placing 40 schools on lockdown, notifying hospitals and nursing homes, and placing police officers at potential locations of an attack.

Threat: Web posting that contains plans to harm others by absurd means, such as a hammer and wooden stake.

I rest easier knowing the FBI is ready to spring into action to prevent hate crimes against fictional populations (vampires).

Don’t you?

CSA: Upgrade Immediately to MongoDB 2.4.1

Filed under: MongoDB — Patrick Durusau @ 4:08 am

CSA: Upgrade Immediately to MongoDB 2.4.1

Alex Popescu advises:

If you are running MongoDB 2.4, upgrade immediately to 2.4.1. Details here.

HOWTO use Hive to SQLize your own Tweets…

Filed under: Hive,SQL,Tweets — Patrick Durusau @ 2:59 am

HOWTO use Hive to SQLize your own Tweets – Part One: ETL and Schema Discovery by Russell Jurney.

HOWTO use Hive to SQLize your own Tweets – Part Two: Loading Hive, SQL Queries

Russell walks you through extracting your tweets, discovering their schema, loading them into Hive and querying the result.

I just requested my tweets on Friday so expect to see them tomorrow or Tuesday.

Will be a bit more complicated than Russell’s example because I re-post tweets about older posts on my blog.

I will have to delete those, although I may want to know when a particular tweet appeared, which means I will need to capture the date(s) when a particular tweet appeared.

BTW, if you do obtain your tweet archive, consider donating it to #Tweets4Science.

March 24, 2013

PyCon US 2013

Filed under: Python — Patrick Durusau @ 6:38 pm

PyCon US 2013

In case you missed it, videos from PyCon US 2013 are online!

I am just beginning to scroll through the presentations and will be pulling out some favorites.

What are yours?

Expectation and Data Quality

Filed under: Marketing,Topic Maps — Patrick Durusau @ 6:35 pm

Expectation and Data Quality by Jim Harris.

From the post:

One of my favorite recently read books is You Are Not So Smart by David McRaney. Earlier this week, the book’s chapter about expectation was excerpted as an online article on Why We Can’t Tell Good Wine From Bad, which also provided additional examples about how we can be fooled by altering our expectations.

“In one Dutch study,” McRaney explained, “participants were put in a room with posters proclaiming the awesomeness of high-definition, and were told they would be watching a new high-definition program. Afterward, the subjects said they found the sharper, more colorful television to be a superior experience to standard programming.”

No surprise there, right? After all, a high-definition television is expected to produce a high-quality image.

“What they didn’t know,” McRaney continued, “was they were actually watching a standard-definition image. The expectation of seeing a better quality image led them to believe they had. Recent research shows about 18 percent of people who own high-definition televisions are still watching standard-definition programming on the set, but think they are getting a better picture.”

I couldn’t help but wonder if establishing an expectation of delivering high-quality data could lead business users to believe that, for example, the data quality of the data warehouse met or exceeded their expectations. Could business users actually be fooled by altering their expectations about data quality? Wouldn’t their experience of using the data eventually reveal the truth?

See Jim’s post for the answer on the quality of data warehouses.

Rather than arguing the “facts” of one methodology over another, what if an opponent were using a different technique and kept winning?

Would that influence an enterprise, agency or government view of a technology?

Genuine question because a large percentage of enterprises don’t believe in routine computer security if the statistics are to be credited.

That despite being victimized by script kiddies on a regular basis.

Of course, if the opponent were a paying customer, would it really matter?

Improved Part-of-Speech Tagging… [Boiling the Ocean?]

Filed under: Cybersecurity,Security — Patrick Durusau @ 4:18 pm

Improved Part-of-Speech Tagging for Online Conversational Text with Word Clusters by Olutobi Owoputi, Brendan O’Connor, Chris Dyer, Kevin Gimpely, Nathan Schneider and Noah A. Smith.

Abstract:

We consider the problem of part-of-speech tagging for informal, online conversational text. We systematically evaluate the use of large-scale unsupervised word clustering and new lexical features to improve tagging accuracy. With these features, our system achieves state-of-the-art tagging results on both Twitter and IRC POS tagging tasks; Twitter tagging is improved from 90% to 93% accuracy (more than 3% absolute). Qualitative analysis of these word clusters yields insights about NLP and linguistic phenomena in this genre. Additionally, we contribute the first POS annotation guidelines for such text and release a new dataset of English language tweets annotated using these guidelines. Tagging software, annotation guidelines, and large-scale word clusters are available at: http://www.ark.cs.cmu.edu/TweetNLP This paper describes release 0.3 of the “CMU Twitter Part-of-Speech Tagger” and annotated data.

This is great work but if I am interested in tweets from a particular set of users who share a common vocabulary, isn’t this like boiling the ocean?

That is if I have a defined source of data, I no longer have to guess or model what might have been meant.

TweetNLP would be very useful in such a case but not as a direct means of analysis.

TweetNLP could derive the norms or patterns found in tweets so that a constructed language for communicating via tweets would fit within those norms.

Another aspect of hiding in a data stream.

Remains a “boiling the ocean” exercise, but for those who want to distinguish ordinary tweets from those that only look like ordinary tweets.

I first saw this in a tweet by Brendan O’Connor.

Top Ten Web Hacking Techniques of 2012

Filed under: Cybersecurity,Security — Patrick Durusau @ 3:47 pm

Top Ten Web Hacking Techniques of 2012 by Jeremiah Grossman.

From the post:

Every year the security community produces a stunning amount of new Web hacking techniques that are published in various white papers, blog posts, magazine articles, mailing list emails, conference presentations, etc. Within the thousands of pages are the latest ways to attack websites, Web browsers, Web proxies, and their mobile platform equivilents. Beyond individual vulnerabilities with CVE numbers or system compromises, here we are solely focused on new and creative methods of Web-based attack. Now it its seventh year, The Top Ten Web Hacking Techniques list encourages information sharing, provides a centralized knowledge-base, and recognizes researchers who contribute excellent work. Past Top Tens and the number of new attack techniques discovered in each year: 2006 (65), 2007 (83), 2008 (70), 2009 (82), 2010 (69), 2011 (51)

The comments have useful material as well.

I first saw this in a post by Ajay Ohri, Hacking for Beginners- Top Website Hacks. Ajay points to a favorite hacking presentation from 2002: Top Ten Web Attacks.

I haven’t looked but suspect a majority of the 2002 top ten still work.

Or at least still work on some sites.

That’s where a topic map of vulnerabilities to sites would come in handy. Either to make the case to plug the holes or other uses.

Cypher in Neo4j 2.0

Filed under: Cypher,Neo4j — Patrick Durusau @ 3:28 pm

Cypher in Neo4j 2.0

Previews new features in Neo4j.

Labels & Indexing

Labels group nodes into sets. Nodes can have multiple labels.

Can use labels to create indexes on subsets of nodes.

Labels will support schema constraints (future feature).

I first saw this in a tweet by Michael Lappe.

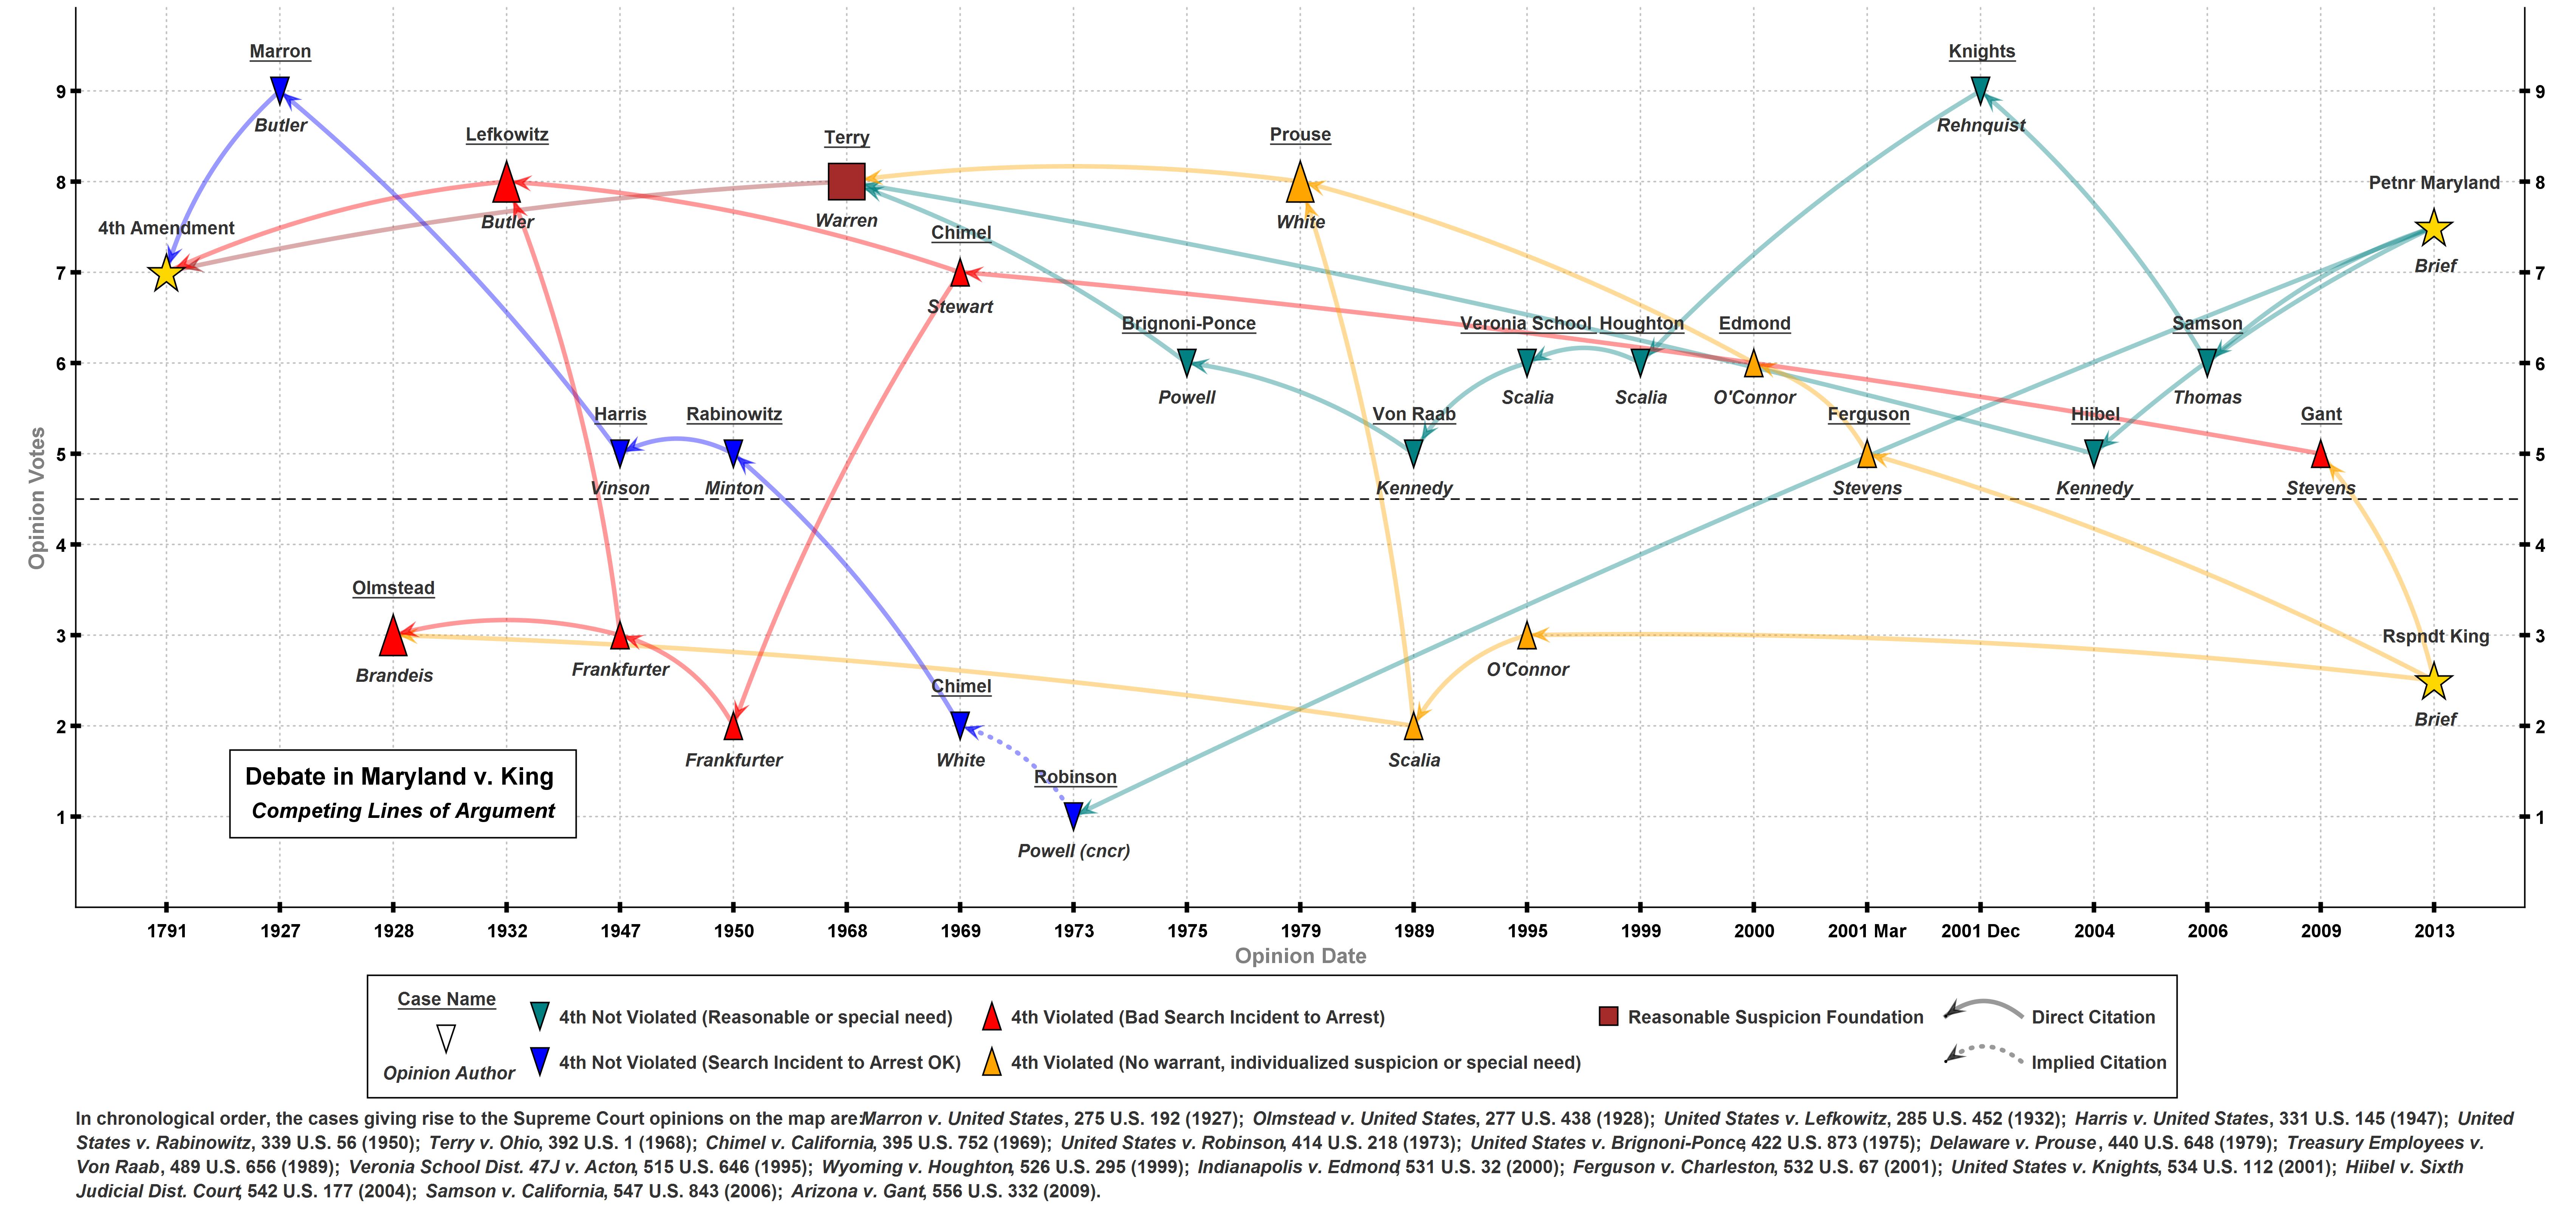
Mapping the Supreme Court

Filed under: Law,Legal Informatics — Patrick Durusau @ 3:05 pm

Mapping the Supreme Court

From the webpage:

The Supreme Court Mapping Project is an original software-driven initiative currently in Beta development. The project, under the direction of University of Baltimore School of Law Assistant Professor Colin Starger, seeks to use information design and software technology to enhance teaching, learning, and scholarship focused on Supreme Court precedent.

The SCOTUS Mapping Project has two distinct components:

Enhanced development of the Mapper software. This software enables users to create sophisticated interactive maps of Supreme Court doctrine by plotting relationships between majority, concurring and dissenting opinions. With the software, users can both visualize how different “lines” of Supreme Court opinions have evolved, and employ animation to make interactive presentations for audiences.

Building an extensive library of Supreme Court doctrinal maps. By highlighting the relationships between essential and influential Court opinions, these maps promote efficient learning and understanding of key doctrinal debates and can assist students, scholars, and practitioners alike. The library already includes maps of key regions of doctrine surrounding the Due Process Clause, the Commerce Clause, and the Fourth Amendment.

The SCOTUS Mapping Project is in Beta-phase development and is currently seeking Beta participants. If you are interested in participating in the Beta phase of the project, contact Prof. Starger.

For identifying and learning lines of Supreme Court decisions, an excellent tool.

I thought the combined mapping in Maryland v. King (warrantless suspicionless search of DNA violated the Fourth Amendment?):

MD v. King

is particularly useful. (Image is a link to the original image.)

It illustrates that Supreme Court decisions on the Fourth Amendment are more mixed than is represented in the popular press.

Using prior decisions as topics, it would be interesting to see a topic map of the social context of those prior decisions.

No Supreme Court decision occurs in a vacuum.

Uncertainty Principle for Data

Filed under: BigData,Uncertainty — Patrick Durusau @ 1:48 pm

Rich Sherman writes in Big Data & The Wizard of Oz Syndrome:

An excellent article in the Wall Street Journal, “Big Data, Big Blunders,” discussed five mistakes commonly made by enterprises when initiating their first Big Data projects. The technology hype cycle, which reminds me a lot of The Wizard of Oz, is a contributing factor in these blunders. I’ll briefly summarize the WSJ’s points, and will suggest, based on my experience helping clients, why enterprises make these blunders.

Rick summarizes these points from the WSJ story:

  • Data for Data’s Sake
  • Talent Gap
  • Data, Data Everywhere
  • Infighting
  • Aiming Too High

Rick says that advocates of new technologies promise to solve problems with prior technology advances, leading to unrealistic expectations.

I agree but there is a persistent failure to recognize the uncertainty principle for data.

How would you know if data is clean and uniform?

By your use case for the data. Yes?

That would explain why data scientists estimate they spend 60-80% of their time munging data (cleaning, transforming, etc.).

They are making data clean and uniform for their individual use cases.

And they do that task over and over again.

The definition of clean and uniform data is like the uncertainty principle in physics.

You can have clean and uniform data for one purpose, but making it so makes it dirty and non-uniform for another purpose.

Unless a technology outlines how it obtains clean and uniform data, from its perspective, it has told you only part of the cost of its use.

Lobbyists 2012: Out of the Game or Under the Radar?

Filed under: Government,Government Data,Transparency — Patrick Durusau @ 10:35 am

Lobbyists 2012: Out of the Game or Under the Radar?

Executive Summary:

Over the past several years, both spending on lobbying and the number of active lobbyists has declined. A number of factors may be responsible, including the lackluster economy, a gridlocked Congress and changes in lobbying rules.

CRP finds that the biggest players in the influence game — lobbying clients across nearly all sectors — increased spending over the last five years. The top 100 lobbying firms income declined only 6 percent between 2007 and 2012 but the number of registered lobbyists dropped by 25 percent.

The more precipitous drop in the number of lobbyists is likely due to changes in the rules. More than 46 percent of lobbyists who were active in 2011 but not in 2012 continue to work for the same employers, suggesting that many have simply avoided the reporting limits while still contributing to lobbying efforts.

Whatever the cause, it is important to understand whether the same activity continues apace with less disclosure and to strengthen the disclosure regimen to ensure that it is clear, enforceable — and enforced. If there is a general sense that the rules don’t matter, there could be erosion to disclosure and a sense that this is an “honor system” that isn’t being honored any longer. This is important because, if people who are in fact lobbying do not register, citizens will be unable to understand the forces at work in shaping federal policy, and therefore can’t effectively participate in policy debates and counter proposals that are not in their interest. At a minimum, the Center for Responsive Politics will continue to aggregate, publish and scrutinize the data that is being reported, in order to explain trends in disclosure — or its omission.

A caution on relying on public records/disclosure for topic maps of political influence.

You can see the full report here.

My surprise was the discovery that:

[the] “honor system” that isn’t being honored any longer.

Lobbying for private advantage at public expense is contrary to any notion of “honor.”

Why the surprise that lobbyists are dishonorable? (However faithful they may be to their employers. Once bought, they stay bought.)

I first saw this at Full Text Reports.

Introducing tags to Journal of Cheminformatics

Filed under: Cheminformatics,Tagging — Patrick Durusau @ 4:33 am

Introducing tags to Journal of Cheminformatics by Bailey Fallon.

From the post:

Journal of Cheminformatics will now be “tagging” its publications, allowing articles related by common themes to be linked together.

Where an article has been tagged, readers will be able access all other articles that share the same tag via a link at the right hand side of the HTML, making it easier to find related content within the journal.

This functionality has been launched for three resources that appear frequently in Journal of Cheminformatics and we will continue to add tags when relevant.

  • Open Babel: Open Babel is an open source chemical toolbox that interconverts over 110 chemical data formats. The first paper describing the features and implementation of open Babel appeared in Journal of Cheminformatics in 2011, and this tag links it with a number of other papers that use the toolkit
  • PubChem: PubChem is an open archive for the biological activities of small molecules, which provides search and analysis tools to assist users in locating desired information. This tag amalgamates the papers published in the PubChem3D thematic series with other papers reporting applications and developments of PubChem
  • InChI: The InChI is as a textual identifier for chemical substances, which provides a standard way of representing chemical information. It is machine readable, making it a valuable tool for cheminformaticians, and this tag links a number of papers in Journal of Cheminformatics that rely on its use

It’s not sophisticated authoring of associations but carefully done, tagging can collate information resources for users.

On export to a topic map application, implied roles could be made explicit, assuming the original tagging was consistent.

March 23, 2013

Topic Maps as Overkill for Cybersecurity?

Filed under: Cybersecurity,Security — Patrick Durusau @ 7:16 pm

I don’t know about for hackers but for defenders, topic maps may be overkill for cybersecurity.

I say “overkill” because the average victim isn’t facing a highly skilled and dedicated opponent.

They are facing script kiddies and are vulnerable because of their own ineptitude.

If you are already inept, topic maps aren’t going to help you. Not with cybersecurity or any other mission critical issue.

Doubtful?

Read James A. Lewis, Raising the Bar for Cybersecurity in full but consider these four facts:

  • More than 90% of the successful breaches required on the most basic techniques.
  • 85% of breaches took months to be discovered; the average time is five months.
  • 96% of successful breaches could have been avoided if the victim had put in simple or intermediate controls.
  • 75% of attacks use publicly known vulnerabilities in commercial software that could be prevented by regular patching.

The only commercial opportunity I see for topic maps, other than for A game players to keep their competitive edge, would be mapping the vulnerabilities of commercial software by versions/patches.

Just to save hackers from exposing themselves on the web searching for appropriate hacks.

Duplicate Detection on GPUs

Filed under: Duplicates,GPU,Record Linkage — Patrick Durusau @ 7:01 pm

Duplicate Detection on GPUs by Benedikt Forchhammer, Thorsten Papenbrock, Thomas Stening, Sven Viehmeier, Uwe Draisbach, Felix Naumann.

Abstract:

With the ever increasing volume of data and the ability to integrate different data sources, data quality problems abound. Duplicate detection, as an integral part of data cleansing, is essential in modern information systems. We present a complete duplicate detection workflow that utilizes the capabilities of modern graphics processing units (GPUs) to increase the efficiency of finding duplicates in very large datasets. Our solution covers several well-known algorithms for pair selection, attribute-wise similarity comparison, record-wise similarity aggregation, and clustering. We redesigned these algorithms to run memory-efficiently and in parallel on the GPU. Our experiments demonstrate that the GPU-based workflow is able to outperform a CPU-based implementation on large, real-world datasets. For instance, the GPU-based algorithm deduplicates a dataset with 1.8m entities 10 times faster than a common CPU-based algorithm using comparably priced hardware.

Synonyms: Duplicate detection = entity matching = record linkage (and all the other alternatives for those terms).

This looks wicked cool!

I first saw this in a tweet by Stefano Bertolo.

Tensors and Their Applications…

Filed under: Linked Data,Machine Learning,Mathematics,RDF,Tensors — Patrick Durusau @ 6:36 pm

Tensors and Their Applications in Graph-Structured Domains by Maximilian Nickel and Volker Tresp. (Slides.)

Along with the slides, you will like abstract and bibliography found at: Machine Learning on Linked Data: Tensors and their Applications in Graph-Structured Domains.

Abstract:

Machine learning has become increasingly important in the context of Linked Data as it is an enabling technology for many important tasks such as link prediction, information retrieval or group detection. The fundamental data structure of Linked Data is a graph. Graphs are also ubiquitous in many other fields of application, such as social networks, bioinformatics or the World Wide Web. Recently, tensor factorizations have emerged as a highly promising approach to machine learning on graph-structured data, showing both scalability and excellent results on benchmark data sets, while matching perfectly to the triple structure of RDF. This tutorial will provide an introduction to tensor factorizations and their applications for machine learning on graphs. By the means of concrete tasks such as link prediction we will discuss several factorization methods in-depth and also provide necessary theoretical background on tensors in general. Emphasis is put on tensor models that are of interest to Linked Data, which will include models that are able to factorize large-scale graphs with millions of entities and known facts or models that can handle the open-world assumption of Linked Data. Furthermore, we will discuss tensor models for temporal and sequential graph data, e.g. to analyze social networks over time.

Devising a system to deal with the heterogeneous nature of linked data.

Just skimming the slides I could see, this looks very promising.

I first saw this in a tweet by Stefano Bertolo.


Update: I just got an email from Maximilian Nickel and he has altered the transition between slides. Working now!

From slide 53 forward is pure gold for topic map purposes.

Heavy sledding but let me give you one statement from the slides that should capture your interest:

Instance matching: Ranking of entities by their similarity in the entity-latent-component space.

Although written about linked data, not limited to linked data.

What is more, Maximilian offers proof that the technique scales!

Complex, configurable, scalable determination of subject identity!

[Update: deleted note about issues with slides, which read: (Slides for ISWC 2012 tutorial, Chrome is your best bet. Even better bet, Chrome on Windows. Chrome on Ubuntu crashed every time I tried to go to slide #15. Windows gets to slide #46 before failing to respond. I have written to inquire about the slides.)]

Making the Most of Big Data

Filed under: BigData,Funding,Government — Patrick Durusau @ 3:50 pm

Making the Most of Big Data

NSF: Summary Submission Deadline – April 22, 2013.

Aiming to make the most of the explosion of Big Data and the tools needed to analyze it, the Obama Administration announced a "National Big Data Research and Development Initiative" on March 29, 2012. To launch the initiative, six Federal departments and agencies announced more than $200 million in new commitments that, together, promise to greatly improve and develop the tools, techniques, and human capital needed to move from data to knowledge to action. The Administration is also working to "liberate" government data and voluntarily-contributed corporate data to fuel entrepreneurship, create jobs, and improve the lives of Americans in tangible ways.

As we enter the second year of the Big Data Initiative, the Administration is encouraging multiple stakeholders including federal agencies, private industry, academia, state and local government, non-profits, and foundations, to develop and participate in Big Data innovation projects across the country. Later this year, the Office of Science and Technology Policy (OSTP), NSF, and other agencies in the Networking and Information Technology R&D (NITRD) program plan to convene an event that highlights high-impact collaborations and identifies areas for expanded collaboration between the public and private sectors. The Administration is particularly interested in projects and initiatives that:

  • Advance technologies that support Big Data and data analytics;
  • Educate and expand the Big Data workforce;
  • Develop, demonstrate and evaluate applications of Big Data that improve key outcomes in economic growth, job creation, education, health, energy, sustainability, public safety, advanced manufacturing, science and engineering, and global development;
  • Demonstrate the role that prizes and challenges can play in deriving new insights from Big Data; and
  • Foster regional innovation.

Please submit a two-page summary of projects to BIGDATA@nsf.gov. The summary should identify:

  1. The goal of the project, with metrics for evaluating the success or failure of the project;
  2. The multiple stakeholders that will participate in the project and their respective roles and responsibilities;
  3. Initial financial and in-kind resources that the stakeholders are prepared to commit to this project; and
  4. A principal point of contact for the partnership.

The submission should also indicate whether the NSF can post the project description to a public website. This announcement is posted solely for information and planning purposes; it does not constitute a formal solicitation for grants, contracts, or cooperative agreements.

Doesn’t look like individuals are included, “…federal agencies, private industry, academia, state and local government, non-profits, and foundations….”

Does anyone have a government or non-profit I could borrow to propose a topic map-based Big Data innovation project?

Thanks!


Phrased humorously but that’s a serious request.

I have a deep interest in the promotion of topic maps and funded projects are a good type of promotion.

Other people see a topic map-based project getting funded and they think having a topic map was part of being funded. Creating more topic map-based applications and hence a chance at more topic map-based projects being funded.

I first saw this in a tweet by Tim O’Reilly.
Using Bayesian networks to discover relations…

Filed under: Bayesian Data Analysis,Bayesian Models,Bioinformatics,Medical Informatics — Patrick Durusau @ 3:33 pm

Using Bayesian networks to discover relations between genes, environment, and disease by Chengwei Su, Angeline Andrew, Margaret R Karagas and Mark E Borsuk. (BioData Mining 2013, 6:6 doi:10.1186/1756-0381-6-6)

Abstract:

We review the applicability of Bayesian networks (BNs) for discovering relations between genes, environment, and disease. By translating probabilistic dependencies among variables into graphical models and vice versa, BNs provide a comprehensible and modular framework for representing complex systems. We first describe the Bayesian network approach and its applicability to understanding the genetic and environmental basis of disease. We then describe a variety of algorithms for learning the structure of a network from observational data. Because of their relevance to real-world applications, the topics of missing data and causal interpretation are emphasized. The BN approach is then exemplified through application to data from a population-based study of bladder cancer in New Hampshire, USA. For didactical purposes, we intentionally keep this example simple. When applied to complete data records, we find only minor differences in the performance and results of different algorithms. Subsequent incorporation of partial records through application of the EM algorithm gives us greater power to detect relations. Allowing for network structures that depart from a strict causal interpretation also enhances our ability to discover complex associations including gene-gene (epistasis) and gene-environment interactions. While BNs are already powerful tools for the genetic dissection of disease and generation of prognostic models, there remain some conceptual and computational challenges. These include the proper handling of continuous variables and unmeasured factors, the explicit incorporation of prior knowledge, and the evaluation and communication of the robustness of substantive conclusions to alternative assumptions and data manifestations.

From the introduction:

BNs have been applied in a variety of settings for the purposes of causal study and probabilistic prediction, including medical diagnosis, crime and terrorism risk, forensic science, and ecological conservation (see [7]). In bioinformatics, they have been used to analyze gene expression data [8,9], derive protein signaling networks [10-12], predict protein-protein interactions [13], perform pedigree analysis [14], conduct genetic epidemiological studies [5], and assess the performance of microsatellite markers on cancer recurrence [15].

Not to mention criminal investigations: Bayesian Network – [Crime Investigation] (Youtube). 😉

Once relations are discovered, you are free to decorate them with roles, properties, etc., in other words, associations.

Increasing Interoperability of Data for Social Good [$100K]

Filed under: Challenges,Contest,Integration,Interoperability,Topic Maps — Patrick Durusau @ 2:23 pm

Increasing Interoperability of Data for Social Good

March 4, 2013 through May 7, 2013 11:30 AM PST

Each Winner to Receive $100,000 Grant

Got your attention? Good!

From the notice:

The social sector is full of passion, intuition, deep experience, and unwavering commitment. Increasingly, social change agents from funders to activists, are adding data and information as yet one more tool for decision-making and increasing impact.

But data sets are often isolated, fragmented and hard to use. Many organizations manage data with multiple systems, often due to various requirements from government agencies and private funders. The lack of interoperability between systems leads to wasted time and frustration. Even those who are motivated to use data end up spending more time and effort on gathering, combining, and analyzing data, and less time on applying it to ongoing learning, performance improvement, and smarter decision-making.

It is the combining, linking, and connecting of different “data islands” that turns data into knowledge – knowledge that can ultimately help create positive change in our world. Interoperability is the key to making the whole greater than the sum of its parts. The Bill & Melinda Gates Foundation, in partnership with Liquidnet for Good, is looking for groundbreaking ideas to address this significant, but solvable, problem. See the website for more detail on the challenge and application instructions. Each challenge winner will receive a grant of $100,000.

From the details website:

Through this challenge, we’re looking for game-changing ideas we might never imagine on our own and that could revolutionize the field. In particular, we are looking for ideas that might provide new and innovative ways to address the following:

  • Improving the availability and use of program impact data by bringing together data from multiple organizations operating in the same field and geographical area;
  • Enabling combinations of data through application programming interface (APIs), taxonomy crosswalks, classification systems, middleware, natural language processing, and/or data sharing agreements;
  • Reducing inefficiency for users entering similar information into multiple systems through common web forms, profiles, apps, interfaces, etc.;
  • Creating new value for users trying to pull data from multiple sources;
  • Providing new ways to access and understand more than one data set, for example, through new data visualizations, including mashing up government and other data;
  • Identifying needs and barriers by experimenting with increased interoperability of multiple data sets;
  • Providing ways for people to access information that isn’t normally accessible (for using natural language processing to pull and process stories from numerous sources) and combing that information with open data sets.

Successful Proposals Will Include:

  • Identification of specific data sets to be used;
  • Clear, compelling explanation of how the solution increases interoperability;
  • Use case;
  • Description of partnership or collaboration, where applicable;
  • Overview of how solution can be scaled and/or adapted, if it is not already cross-sector in nature;
  • Explanation of why the organization or group submitting the proposal has the capacity to achieve success;
  • A general approach to ongoing sustainability of the effort.

I could not have written a more topic map oriented challenge. You?

They suggest the usual social data sites:

Methods of Proof — Induction

Filed under: Mathematical Reasoning,Mathematics,Programming — Patrick Durusau @ 1:20 pm

Methods of Proof — Induction by Jeremy Kun.

Jeremy covers proof by induction in the final post for his “proof” series.

Induction is used to prove statements about natural numbers (positive integers).

Lars Marius Garshol recently concluded slides on big data with:

  • Vast potential
    • to both big data and machine learning
  • Very difficult to realize that potential
    • requires mathematics, which nobody knows
  • We need to wake up!

Big Data 101 by Lars Marius Garshol.

If you want to step up your game with big data, you will need to master mathematics.

Excel and other software can do mathematics but can’t choose the mathematics to apply.

That requires you.

Graph Processing DevRoom 2013 edition

Filed under: Graphs,Networks — Patrick Durusau @ 12:56 pm

Graph Processing DevRoom 2013 edition

Twelve slide decks from the Graph Processing workshop within FOSDEM.

Enjoy!

Data Mining and Visualization: Bed Bug Edition

Filed under: Data Mining,Graphics,Visualization — Patrick Durusau @ 12:49 pm

Data Mining and Visualization: Bed Bug Edition by Brooke Borel.

A very good example of data mining and visualization making a compelling case for conventional wisdom being wrong!

What I wonder about and what isn’t shown by the graphics, is what relationships, if any, existed between the authors of papers on bed bugs?

Were there communities, so to speak, of bed bug authors who cited each other? But not authors from parallel bed bug communities?

Not to mention the usual semantic gaps between authors from different traditions.

It sounds like Brooke is going to make a compelling read about all things, bed bugs!

The power of data mining!

Seeing the Future, 1/10 second at a time

Filed under: Image Understanding,Interface Research/Design,Usability,Users — Patrick Durusau @ 11:16 am

Ever caught a basketball? (Lot of basketball noise in the US right now.)

Or a baseball?

Played any other sport with a moving ball?

Your brain takes about 1/10 of a second to construct a perception of reality.

At 10 MPH, a ball moves 14.67 feet, while your brain creates a perception of its original location.

How did you catch the ball with your hands and not your face?

Mark Changizi has an answer to that question in: Why do we see illusions?.

The question Mark does not address: How does that relate to topic maps?

I can answer that with another question:

Does your topic map application communicate via telepathy or does it have an interface?

If you said it has an interface, understanding/experimenting with human perception is an avenue to create a useful and popular topic map interface.

You can also use the “works for our developers” approach but I wouldn’t recommend it.


About Mark Changizi:

Mark Changizi is a theoretical neurobiologist aiming to grasp the ultimate foundations underlying why we think, feel, and see as we do. His research focuses on “why” questions, and he has made important discoveries such as why we see in color, why we see illusions, why we have forward-facing eyes, why the brain is structured as it is, why animals have as many limbs and fingers as they do, why the dictionary is organized as it is, why fingers get pruney when wet, and how we acquired writing, language, and music.

March 22, 2013

The Shape of Data

Filed under: Data,Mathematics,Topology — Patrick Durusau @ 1:17 pm

The Shape of Data by Jesse Johnson.

From the “about” page:

Whether your goal is to write data intensive software, use existing software to analyze large, high dimensional data sets, or to better understand and interact with the experts who do these things, you will need a strong understanding of the structure of data and how one can try to understand it. On this blog, I plan to explore and explain the basic ideas that underlie modern data analysis from a very intuitive and minimally technical perspective: by thinking of data sets as geometric objects.

When I began learning about machine learning and data mining, I found that the intuition I had formed while studying geometry was extremely valuable in understanding the basic concepts and algorithms. My main obstacle has been to figure out what types of problems others are interested in solving, and what types of solutions would make the most difference. I hope that by sharing what I know (and what I continue to learn) from my own perspective, others will help me to figure out what are the major questions that drive this field.

A new blog that addresses the topology of data, in an accessible manner.

How Sharehoods Created Neomodel Along The Way [London]

Filed under: Django,Graphs,Neo4j,Python — Patrick Durusau @ 12:53 pm

How Sharehoods Created Neomodel Along The Way

EVENT DETAILS

What: Neo4J User Group:CASE STUDY: How Sharehoods Created Neomodel Along The Way
Where: The Skills Matter eXchange, London
When: 27 Mar 2013 Starts at 18:30

From the description:

Sharehoods is a global online portal for foreigners. and the first place where new-comers to a city can build their social relationships and network – online or from a mobile phone.

In this talk, Sharehoods Head of Technology Robin Edwards will explain why and how Neo4j is used at this exciting tech startup. Robin will also give a whirlwind tour of neomodel, a new Python framework for neo4j and its integration with the Django stack.

Join this talk if you’d like to learn how to get productive with Neo4j, Python and Django.

Entity disambiguation:

I don’t think they mean:

Jamie Foxx

I think they mean:

django software The Web framework for perfectionists with deadlines.

If you attend, drop me a note to confirm my suspicions. 😉

Apache Crunch (Top-Level)

Filed under: Apache Crunch,Hadoop,MapReduce — Patrick Durusau @ 12:34 pm

Apache Crunch (Top Level)

While reading Josh Wills post, Cloudera ML: New Open Source Libraries and Tools for Data Scientists, I saw that Apache Crunch became a top-level project at the Apache Software Foundation last month.

Congratulations to Josh and all the members of the Crunch community!

From the Apache Crunch homepage:

The Apache Crunch Java library provides a framework for writing, testing, and running MapReduce pipelines, and is based on Google’s FlumeJava library. Its goal is to make pipelines that are composed of many user-defined functions simple to write, easy to test, and efficient to run.

Running on top of Hadoop MapReduce, the Apache Crunch™ library is a simple Java API for tasks like joining and data aggregation that are tedious to implement on plain MapReduce. The APIs are especially useful when processing data that does not fit naturally into relational model, such as time series, serialized object formats like protocol buffers or Avro records, and HBase rows and columns. For Scala users, there is the Scrunch API, which is built on top of the Java APIs and includes a REPL (read-eval-print loop) for creating MapReduce pipelines.

You may be interested in: Crunch-133 Add Aggregator support for combineValues ops on secondary keys via maps and collections. It is an “open” issue.

Cloudera ML:…

Filed under: Cloudera,Clustering,Machine Learning — Patrick Durusau @ 10:57 am

Cloudera ML: New Open Source Libraries and Tools for Data Scientists by Josh Wills.

From the post:

Today, I’m pleased to introduce Cloudera ML, an Apache licensed collection of Java libraries and command line tools to aid data scientists in performing common data preparation and model evaluation tasks. Cloudera ML is intended to be an educational resource and reference implementation for new data scientists that want to understand the most effective techniques for building robust and scalable machine learning models on top of Hadoop.

…[details about clustering omitted]

If you were paying at least somewhat close attention, you may have noticed that the algorithms I’m describing above are essentially clever sampling techniques. With all of the hype surrounding big data, sampling has gotten a bit of a bad rap, which is unfortunate, since most of the work of a data scientist involves finding just the right way to turn a large data set into a small one. Of course, it usually takes a few hundred tries to find that right way, and Hadoop is a powerful tool for exploring the space of possible features and how they should be weighted in order to achieve our objectives.

Wherever possible, we want to minimize the amount of parameter tuning required for any model we create. At the very least, we should try to provide feedback on the quality of the model that is created by different parameter settings. For k-means, we want to help data scientists choose a good value of K, the number of clusters to create. In Cloudera ML, we integrate the process of selecting a value of K into the data sampling and cluster fitting process by allowing data scientists to evaluate multiple values of K during a single run of the tool and reporting statistics about the stability of the clusters, such as the prediction strength.

Finally, we want to investigate the anomalous events in our clustering- those points that don’t fit well into any of the larger clusters. Cloudera ML includes a tool for using the clusters that were identified by the scalable k-means algorithm to compute an assignment of every point in our large data set to a particular cluster center, including the distance from that point to its assigned center. This information is created via a MapReduce job that outputs a CSV file that can be analyzed interactively using Cloudera Impala or your preferred analytical application for processing data stored in Hadoop.

Cloudera ML is under active development, and we are planning to add support for pivot tables, Hive integration via HCatalog, and tools for building ensemble classifers over the next few weeks. We’re eager to get feedback on bug fixes and things that you would like to see in the tool, either by opening an issue or a pull request on our github repository. We’re also having a conversation about training a new generation of data scientists next Tuesday, March 26th, at 2pm ET/11am PT, and I hope that you will be able to join us.

Another great project by Cloudera!

Lucene/Solr 4 – A Revolution in Enterprise Search Technology (Webinar)

Filed under: Indexing,Lucene,Solr — Patrick Durusau @ 10:34 am

Lucene/Solr 4 – A Revolution in Enterprise Search Technology (Webinar). Presenter: Erik Hatcher, Lucene/Solr Committer and PMC member.

Date: Wednesday, March 27, 2013
Time: 10:00am Pacific Time

From the signup page:

Lucene/Solr 4 is a ground breaking shift from previous releases. Solr 4.0 dramatically improves scalability, performance, reliability, and flexibility. Lucene 4 has been extensively upgraded. It now supports near real-time (NRT) capabilities that allow indexed documents to be rapidly visible and searchable. Additional Lucene improvements include pluggable scoring, much faster fuzzy and wildcard querying, and vastly improved memory usage.

The improvements in Lucene have automatically made Solr 4 substantially better. But Solr has also been considerably improved and magnifies these advances with a suite of new “SolrCloud” features that radically improve scalability and reliability.

In this Webinar, you will learn:

  • What are the Key Feature Enhancements of Lucene/Solr 4, including the new distributed capabilities of SolrCloud
  • How to Use the Improved Administrative User Interface
  • How Sharding has been improved
  • What are the improvements to GeoSpatial Searches, Highlighting, Advanced Query Parsers, Distributed search support, Dynamic core management, Performance statistics, and searches for rare values, such as Primary Key

Great way to get up to speed on the latest release of Lucene/Solr!

« Newer PostsOlder Posts »

Powered by WordPress