Another Word For It Patrick Durusau on Topic Maps and Semantic Diversity

January 25, 2013

Make your Filters Match: Faceting in Solr [Surveillance By and For The Public?]

Filed under: Facets,Lucene,Solr — Patrick Durusau @ 8:17 pm

Make your Filters Match: Faceting in Solr Florian Hopf.

From the post:

Facets are a great search feature that let users easily navigate to the documents they are looking for. Solr makes it really easy to use them though when naively querying for facet values you might see some unexpected behaviour. Read on to learn the basics of what is happening when you are passing in filter queries for faceting. Also, I’ll show how you can leverage local params to choose a different query parser when selecting facet values.

Introduction

Facets are a way to display categories next to a users search results, often with a count of how many results are in this category. The user can then select one of those facet values to retrieve only those results that are assigned to this category. This way he doesn’t have to know what category he is looking for when entering the search term as all the available categories are delivered with the search results. This approach is really popular on sites like Amazon and eBay and is a great way to guide the user.

Solr brought faceting to the Lucene world and arguably the feature was an important driving factor for its success (Lucene 3.4 introduced faceting as well). Facets can be build from terms in the index, custom queries and ranges though in this post we will only look at field facets.

Excellent introduction to facets in Solr.

The amount of enterprise quality indexing and search software that is freely available, makes me wonder why the average citizen worries about privacy?

There are far more average citizens than denizens of c-suites, government offices, and the like.

Shouldn’t they be the ones worrying about what the rest of us are compiling together?

Instead of secret, Stasi-like archives, a public archive, with the observations of ordinary citizens.
VoltDB 3.0

Filed under: VoltDB — Patrick Durusau @ 8:17 pm

VoltDB 3.0 (press release)

From the press release:

BILLERICA, Mass., January 22, 2013VoltDB, the world’s fastest high-velocity database, today announced the immediate availability of the newest version of its flagship offering, VoltDB 3.0.

VoltDB is an in-memory relational database designed specifically to solve the big data velocity problem. Despite the deafening hype around big data, most enterprises have not been able to build applications that can ingest, analyze and act on massive volumes of data fast enough to deliver business value. VoltDB solves this problem by narrowing the “ingestion-to-decision” gap from minutes, or even hours, to milliseconds.

“With every passing second, time saps the value of data. This is why so many big data applications have not delivered business value – it simply takes too long to analyze and identify actionable information in the morass of data,” said Ryan Hubbard, CTO of Yellowhammer. “VoltDB has solved this problem for Yellowhammer. For the first time, we can ingest, analyze and decision on data in real time. This capability opens a new world of possibilities for applications that truly deliver competitive advantage.”

Purpose built for high velocity big data applications, VoltDB enables real-time visibility into the data that drives business value. With these industry first capabilities, VoltDB is making it possible for developers to create an entirely new generation of big data applications, with application functionality that could not be realized with traditional database offerings.

The Planning Guide for VoltDB is refreshing, albeit a bit brief.

VoltDB is fast, etc., but the Planning Guide makes it clear usefulness is not a given. VoltDB provides a robust foundation but you have to take advantage of it.

VoltDB community. Downloads, documentation, community, etc.

Billionaires of the world ranked and charted [Distraction?]

Filed under: Graphics,Social Networks,Visualization — Patrick Durusau @ 8:16 pm

Billionaires of the world ranked and charted by Nathan Yau.

Nathan reviews an interactive tool by Bloomberg that plots the wealth of the richest people in the world, compares them to each other and charts how their net worth changes.

Question: Would charting Taylor Swift’s relationships would be more or less useful?

Or like tracking the world’s richest, is it just a distraction?

Who are you more likely to encounter?

  • One of the world’s richest people, or
  • Tayor Swift, or
  • A local judge, prosecutor, elected official or bank officer?

Social graphs of which one is most relevant for you?

Don’t be distracted by “infotainment” than has no relevance for your daily life.

What if you had a social graph of those with the most impact on your life? And other people had similar graphs with that they know about some of the same people.

If enough small social graphs are put together, the authors of those graphs, not the infotainment industry or elected officials, are empowered.

Question: Who do you want to start tracking with a social graph?

.Astronomy

Filed under: Astroinformatics,Graphics,Visualization — Patrick Durusau @ 8:16 pm

.Astronomy

From the “about” page:

The Internet provides an incredible platform for astronomers and astrophysical research. .Astronomy (pronounced ‘dot-astronomy’) aims to bring together an international community of astronomy researchers, developers, educators and communicators to showcase and build upon these many web-based projects, from outreach and education to research tools and data analysis.

.Astronomy events are held (almost) once a year. The most recent was in Heidelberg in July 2012. These meetings bring people together to talk, make and do cool stuff for just a few days. The events are focused, but informal, and encourage collaboration on new ideas that can benefit astronomy in a variety of ways.

Presentations from .Astronomy 4 and other resources.

For example: Julie Steele and Noah Iliinsky: How to be a Data Visualisation Star

Has a pointer to: Properties and Best Uses of Visual Encodings by Noah Iliinsky.

Be sure to grab Noah’s chart (PDF) and print it out (on a color printer)

Julie and Noah are the authors of:

Beautiful Visualizations: [looking at data through the eyes of experts]

Designing Data Visualizations

Highly recommended, along with the other presentations you will find here.

.Astronomy 5

Filed under: Astroinformatics,Conferences — Patrick Durusau @ 8:16 pm

Come to Cambridge For .Astronomy 5

From the post:

We’re happy to announce that you can now sign up for .Astronomy 5! Our fifth event will be hosted by Harvard’s Seamless Astronomy group at Microsoft’s NERD Center in Cambridge, MA, USA. Mark your diary, iCal, Google Calendar (or whatever system you’ve rigged up to wrangle Twitter into being your PA) for the date: September 16-18, 2013. We’ll be collecting together 50 attendees for a three-day conference, unconference and hack day: all about astronomy online!

Sign up will be slightly different this year, mainly to avoid a race to fill up limited spaces. We limit .Astronomy to roughly 50 people: a number that we find is large enough to inspire productive group work, and that everyone can contribute, but not so large that participants can hide in anonymity. So this year we’re opening up this sign up form today, and will keep it open until February. At that point we’ll pick 50 people based on the information on the forms received, to try and produce the most varied and awesome event yet. We want to ensure a good mix of new people and old hands – as well as good representation of all the different skills participants bring with them.

We’ll post further information about the event as we have it, such as the estimated registration fee (we aim to keep this low) and keynote speakers. If you have any questions about the signup process, then drop us a line. For updates, follow this site or keep an eye on the .Astronomy 5 information page at http://dotastronomy.com/events/five.

Jim Gray (MS) was reported to like astronomy data sets because they were big and free.

Are you interested in really “big data?”

This may be the conference for you.

Neo4j Milestone 1.9.M04 released

Filed under: Graphs,Neo4j,Networks — Patrick Durusau @ 8:15 pm

Neo4j Milestone 1.9.M04 released by Michael Hunger.

From the post:

Today we’re happy to announce Neo4j 1.9.M04, the next milestone on our way to the Neo4j 1.9 release.

For this milestone we have worked on further improvements in Cypher, resolving several issues and continued to improve performance.

Something many users has asked for is Scala 2.10 support which we are providing now that a stable Scala 2.10 release is available.

There were some binary changes in the Scala runtime so by adopting to these, Cypher became incompatible to Scala 2.9. Please ping us if that is an issue for you.

In the Kernel we finally resolved a recovery problem that caused the recovery process to fail under certain conditions.

Due to a report from Jérémie Grodziski we identified a performance issue with REST-batch-operations which caused a massive slowdown on large requests (more than thousand commands).

Solving this we got a 30 times performance increase for these kinds of operations. So if you are inserting large amounts of data into Neo4j using the REST-batch-API then please try 1.9.M04 if that improves things for you.

If you are tracking development of Neo4j, a good time to update your installation.

Hadoop – “State of the Union” – Notes

Filed under: Hadoop,Hortonworks — Patrick Durusau @ 8:15 pm

I took notes on Shaun Connolly’s “Hortonworks State of the Union and Vision for Apache Hadoop in 2013.”

Unless you are an open source/Hadoop innocent, you aren’t going to gain much new information from the webinar.

But there is another reason for watching the webinar.

That is the strategy Hortonworks is pursuing in developing the Hadoop ecosystem.

Shaun refers to it in various ways (warning, some paraphrasing): “Investing in making Hadoop work with existing infrastructure,” add Hadoop to (not replace) traditional data architectures, “customers don’t want more data silos.”

Rather than a rip-and-replace technology, Hortonworks is building a Hadoop ecosystem that interacts with and compliments existing data architectures.

Think about that for a moment.

Works with existing data architectures.

Which means everyone from ordinary users to power users and sysadmins, can work from what they know and gain the benefits of a Hadoop ecosystem.

True enough, over time some (all?) of their traditional data architectures may become more Hadoop based but that will be a gradual process.

In the meantime, the benefits of Hadoop will be made manifest in the context of familiar tooling.

When a familiar tool runs faster, acquires new capabilities, user’s notice the change along with the lack of a learning curve.

Watch the webinar for the strategy and think about how to apply it to your favorite semantic technology.

January 24, 2013

11 Interesting Releases From the First Weeks of January

Filed under: NoSQL,Software — Patrick Durusau @ 8:10 pm

11 Interesting Releases From the First Weeks of January by Alex Popescu.

Alex has collected links for eleven (11) interesting NoSQL releases in January 2013!

Visit Alex’s post. You won’t be disappointed.

Apache Lucene 4.1 and Apache SolrTM 4.1 available

Filed under: Indexing,Lucene,Searching,Solr — Patrick Durusau @ 8:10 pm

Lucene 4.1 can be downloaded from: http://lucene.apache.org/core/mirrors-core-latest-redir.html

Lucene CHANGES.text

Solr 4.1 can be downloaded from: http://lucene.apache.org/solr/mirrors-solr-latest-redir.html

Solr CHANGES.txt

That’s getting the new year off to a great start!

Designing Search (part 6): Manipulating results

Filed under: Design,Interface Research/Design,Searching — Patrick Durusau @ 8:09 pm

Designing Search (part 6): Manipulating results by Tony Russell-Rose.

From the post:

One of the key insights to emerge from research into human information seeking is that search is more than just finding: in fact, search tasks of any complexity involve iteration across a number of levels of task context. From information retrieval at the lowest level to work task at the highest, searchers engage in a whole host of activities or search modes in the pursuit of their goals.

Of course, locating (known) items may be the stereotypical search task with which we are all familiar – but it is far from being the only one. Instead, for many search tasks we need to analyse, compare, verify, evaluate, synthesize… in short, we need to manipulate and interact with the results. While the previous post focused on informational features, our concern here is with interactivity. In this post, we consider techniques for managing and manipulating search results.

Not only does Tony have advice on “best practices,” but it is illustrated with real world examples.

Data Points: First look

Filed under: Graphics,Visualization — Patrick Durusau @ 8:09 pm

Data Points: First look by Nathan Yau.

From the post:

For the past year, I’ve been working on Data Points: Visualization that Means Something, and you can pre-order it now.

Visualization has grown a lot in the 5-something years I’ve written for FlowingData. It’s not just a tool for analysis anymore. Visualization is a way to express data, and it comes in the form of information graphics, entertainment, everyday interfaces, data art, and yeah, tools, too. Your approach to data and visualization changes based on application.

But even with all these (awesome) new applications, there’s a constant across all of them: the data.

Data Points starts here, and takes you through the process of understanding data, representing it, exploring it, and designing for different applications. Whereas Visualize This was about getting your feet wet with lots of code examples, Data Points is code-independent and is a perfect complement that helps you understand and allow others to understand data better, which is sorta the whole point.

Nathan’s posts on visualizations, by himself and others, have been a source of high quality content that I cite often.

Take the time to pre-order a copy of Data Points.

Time will go slowly between now and the ship date for Data Points but that’s will be true if you wait for the release or pre-order.

Depth- and Breadth-First Search

Filed under: Graphs,Networks,Searching — Patrick Durusau @ 8:08 pm

Depth- and Breadth-First Search by Jeremy Kun.

From the post:

The graph is among the most common data structures in computer science, and it’s unsurprising that a staggeringly large amount of time has been dedicated to developing algorithms on graphs. Indeed, many problems in areas ranging from sociology, linguistics, to chemistry and artificial intelligence can be translated into questions about graphs. It’s no stretch to say that graphs are truly ubiquitous. Even more, common problems often concern the existence and optimality of paths from one vertex to another with certain properties.

Of course, in order to find paths with certain properties one must first be able to search through graphs in a structured way. And so we will start our investigation of graph search algorithms with the most basic kind of graph search algorithms: the depth-first and breadth-first search. These kinds of algorithms existed in mathematics long before computers were around. The former was ostensibly invented by a man named Pierre Tremaux, who lived around the same time as the world’s first formal algorithm designer Ada Lovelace. The latter was formally discovered much later by Edward F. Moore in the 50′s. Both were discovered in the context of solving mazes.

These two algorithms nudge gently into the realm of artificial intelligence, because at any given step they will decide which path to inspect next, and with minor modifications we can “intelligently” decide which to inspect next.

Of course, this primer will expect the reader is familiar with the basic definitions of graph theory, but as usual we provide introductory primers on this blog. In addition, the content of this post will be very similar to our primer on trees, so the familiar reader may benefit from reading that post as well.

As always, an excellent “primer,” this time on searching graphs.

Solr vs. ElasticSearch: Part 6 – User & Dev Communities

Filed under: ElasticSearch,Searching,Solr — Patrick Durusau @ 8:08 pm

Solr vs. ElasticSearch: Part 6 – User & Dev Communities by Rafał Kuć.

From the post:

One of the questions after my talk during the recent ApacheCon EU was what I thought about the communities of the two search engines I was comparing. Not surprisingly, this is also a question we often address in our consulting engagements. As a part of our Apache Solr vs ElasticSearch post series we decided to step away from the technical aspects of SolrCloud vs. ElasticSearch and look at the communities gathered around thesee two projects. If you haven’t read the previous posts about Apache Solr vs. ElasticSearch here are pointers to all of them:

Rafał compares user activity (discussion lists), resources available, search trends, code statistics.

My take away is that both projects have very vibrant and responsive user and development communities.

You?

Scikit-Learn 0.13 released!

Filed under: Machine Learning,Scikit-Learn — Patrick Durusau @ 8:07 pm

Scikit-Learn 0.13 released! We want your feedback. by Andreas Mueller

From the post:

After a little delay, the team finished work on the 0.13 release of scikit-learn.

There is also a user survey that we launched in parallel with the release, to get some feedback from our users.

There is a list of changes and new features on the website.

Feedback (useful feedback) is a small price to pay for such a large amount of effort!

Download the new release and submit feedback.

On the next release you will be glad you did!

What tools do you use for information gathering and publishing?

Filed under: Data Mining,Publishing,Text Mining — Patrick Durusau @ 8:07 pm

What tools do you use for information gathering and publishing? by Mac Slocum.

From the post:

Many apps claim to be the pinnacle of content consumption and distribution. Most are a tangle of silly names and bad interfaces, but some of these tools are useful. A few are downright empowering.

Finding those good ones is the tricky part. I queried O’Reilly colleagues to find out what they use and why, and that process offered a decent starting point. We put all our notes together into this public Hackpad — feel free to add to it. I also went through and plucked out some of the top choices. Those are posted below.

Information gathering, however humble it may be, is the start of any topic map authoring project.

Mac asks for the tools you use every week.

Let’s not disappoint him!

GraphChi version 0.2 released!

Filed under: GraphChi,Graphs,Networks — Patrick Durusau @ 8:07 pm

GraphChi version 0.2 released! by Danny Bickson.

From the post:

GraphChi version 0.2 is the first major update to the GraphChi software for disk-based computation on massive graphs. This upgrade brings two major changes: compressed data storage (shards) and support for dynamically sized edges.

We also thank for your interest on GraphChi so far: since the release in July 9th 2012, there has been over 8,000 unique visitors to the Google Code project page, at least 2,000 downloads of the source package, several blog posts and hundreds of tweets. GraphChi is a research project, and your feedback has helped us tremendously in our work.

Excellent news!

A link for the Dynamic Edge Data tutorial was omitted from the original post.

January 23, 2013

Confluently Persistent Sets and Maps

Filed under: Functional Programming,Maps,Python,Sets — Patrick Durusau @ 7:42 pm

Confluently Persistent Sets and Maps by Olle Liljenzin.

Abstract:

Ordered sets and maps play important roles as index structures in relational data models. When a shared index in a multi-user system is modified concurrently, the current state of the index will diverge into multiple versions containing the local modifications performed in each work flow. The confluent persistence problem arises when versions should be melded in commit and refresh operations so that modifications performed by different users become merged.

Confluently Persistent Sets and Maps are functional binary search trees that support efficient set operations both when operands are disjoint and when they are overlapping. Treap properties with hash values as priorities are maintained and with hash-consing of nodes a unique representation is provided. Non-destructive set merge algorithms that skip inspection of equal subtrees and a conflict detecting meld algorithm based on set merges are presented. The meld algorithm is used in commit and refresh operations. With m modifications in one flow and n items in total, the expected cost of the operations is O(m log(n/m)).

Is this an avenue for coordination between distinct topic maps?

Or is consistency of distinct topic maps an application-based requirement?

Complex Adaptive Systems Modeling

Filed under: Adaptive Networks,Networks,Social Networks — Patrick Durusau @ 7:42 pm

Complex Adaptive Systems Modeling, Editor-in-Chief: Muaz A. Niazi, ISSN: 2194-3206 (electronic version)

From the webpage:

Complex Adaptive Systems Modeling is a peer-reviewed open access journal published under the brand SpringerOpen.

Complex Adaptive Systems Modeling (CASM) is a highly multidisciplinary modeling and simulation journal that serves as a unique forum for original, high-quality peer-reviewed papers with a specific interest and scope limited to agent-based and complex network-based modeling paradigms for Complex Adaptive Systems (CAS). The highly multidisciplinary scope of CASM spans any domain of CAS. Possible areas of interest range from the Life Sciences (E.g. Biological Networks and agent-based models), Ecology (E.g. Agent-based/Individual-based models), Social Sciences (Agent-based simulation, Social Network Analysis), Scientometrics (E.g. Citation Networks) to large-scale Complex Adaptive COmmunicatiOn Networks and environmentS (CACOONS) such as Wireless Sensor Networks (WSN), Body Sensor Networks, Peer-to-Peer (P2P) networks, pervasive mobile networks, service oriented architecture, smart grid and the Internet of Things.

In general, submitted papers should have the following key elements:

  • A clear focus on a specific area of CAS E.g. ecology, social sciences, large scale communication networks, biological sciences etc.)
  • Either focus on an agent-based simulation model or else a complex network model based on data from CAS (e.g. Citation networks, Gene regulatory Networks, Social networks, Ecological Networks etc.).

A new open access journal from Springer with a focus on complex adaptive systems.

Adaptive-network simulation library

Filed under: Adaptive Networks,Complex Networks,Networks,Simulations — Patrick Durusau @ 7:42 pm

Adaptive-network simulation library by Gerd Zschaler.

From the webpage:

The largenet2 library is a collection of C++ classes providing a framework for the simulation of large discrete adaptive networks. It provides data structures for an in-memory representation of directed or undirected networks, in which every node and link can have an integer-valued state.

Efficient access to (random) nodes and links as well as (random) nodes and links with a given state value is provided. A limited number of graph-theoretical measures is implemented, such as the (state-resolved) in- and out-degree distributions and the degree correlations (same-node and nearest-neighbor).

Read the tutorial here. Source code is available here.

A static topic map would not qualify as an adaptive network, but a dynamic, real time topic map system might have the characteristics of complex adaptive systems:

  • The number of elements is sufficiently large that conventional descriptions (e.g. a system of differential equations) are not only impractical, but cease to assist in understanding the system, the elements also have to interact and the interaction must be dynamic. Interactions can be physical or involve the exchange of information.
  • Such interactions are rich, i.e. any element in the system is affected by and affects several other systems.
  • The interactions are non-linear which means that small causes can have large results.
  • Interactions are primarily but not exclusively with immediate neighbours and the nature of the influence is modulated.
  • Any interaction can feed back onto itself directly or after a number of intervening stages, such feedback can vary in quality. This is known as recurrency.
  • Such systems are open and it may be difficult or impossible to define system boundaries
  • Complex systems operate under far from equilibrium conditions, there has to be a constant flow of energy to maintain the organization of the system
  • All complex systems have a history, they evolve and their past is co-responsible for their present behaviour
  • Elements in the system are ignorant of the behaviour of the system as a whole, responding only to what is available to it locally

The more dynamic the connections between networks, the closer we will move towards networks with the potential for adaptation.

That isn’t to say all networks will adapt at all or that those that do, will do it well.

Suspect adaption, like integration, is going to depend upon the amount of semantic information on hand.

You may also want to review: Largenet2: an object-oriented programming library for simulating large adaptive networks by Gerd Zschaler, and Thilo Gross. Bioinformatics (2013) 29 (2): 277-278. doi: 10.1093/bioinformatics/bts663

Testling-CI

Filed under: Interface Research/Design,Software,Web Applications,Web Browser — Patrick Durusau @ 7:41 pm

Announcing Testling-CI by Peteris Krumins.

From the post:

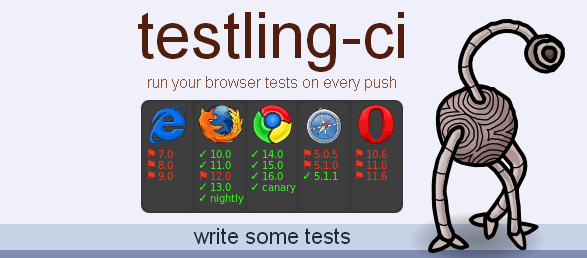
We at Browserling are proud to announce Testling-CI! Testling-CI lets you write continuous integration cross-browser tests that run on every git push!

testling-ci

There are a ton of modules on npm and github that aren’t just for node.js but for browsers, too. However, figuring out which browsers these modules work with can be tricky. It’s often that case that some module used to work in browsers but has accidentally stopped working because the developer hadn’t checked that their code still worked recently enough. If you use npm for frontend and backend modules, this can be particularly frustrating.

You will probably also be interested in: How to write Testling-CI tests.

A bit practical for me but with HTML5, browser-based interfaces are likely to become the default.

Useful to point out resources that will make it easier to cross-browser test topic map, browser-based interfaces.

Top 10 Formulas for Aspiring Analysts

Filed under: Data Mining,Excel — Patrick Durusau @ 7:41 pm

Top 10 Formulas for Aspiring Analysts by Purna “Chandoo” Duggirala.

From the post:

Few weeks ago, someone asked me “What are the top 10 formulas?” That got me thinking.

While each of us have our own list of favorite, most frequently used formulas, there is no standard list of top 10 formulas for everyone. So, today let me attempt that.

If you want to become a data or business analyst then you must develop good understanding of Excel formulas & become fluent in them.

A good analyst should be familiar with below 10 formulas to begin with.

A reminder that not all data analysis starts with the most complex chain of transformations you can imagine.

Sometimes you need to explore and then roll out the heavy weapons.

Data Warfare: Big Data As Another Battlefield

Filed under: Data,Marketing,Topic Maps — Patrick Durusau @ 7:40 pm

Stacks get hacked: The inevitable rise of data warfare by Alistair Croll.

A snippet from Alistair’s post:

First, technology is good. Then it gets bad. Then it gets stable.

Geeks often talk about “layer 8.” When an IT operator sighs resignedly that it’s a layer 8 problem, she means it’s a human’s fault. It’s where humanity’s rubber meets technology’s road. And big data is interesting precisely because it’s the layer 8 protocol. It’s got great power, demands great responsibility, and portends great risk unless we do it right. And just like the layers beneath it, it’s going to get good, then bad, then stable.

Other layers of the protocol stack have come under assault by spammers, hackers, and activists. There’s no reason to think layer 8 won’t as well. And just as hackers find a clever exploit to intercept and spike an SSL session, or trick an app server into running arbitrary code, so they’ll find an exploit for big data.

The term “data warfare” might seem a bit hyperbolic, so I’ll try to provide a few concrete examples. I’m hoping for plenty more in the Strata Online Conference we’re running next week, which has a stellar lineup of people who have spent time thinking about how to do naughty things with information at scale.

Alistair has interesting example cases but layer 8 warfare has been the norm for years.

Big data is just another battlefield.

Consider the lack of sharing within governmental agencies.

How else would you explain: U.S. Government’s Fiscal Years 2012 and 2011 Consolidated Financial Statements, a two hundred and seventy page report from the Government Accounting Office (GAO), detailing why it can’t audit the government due to problems at the Pentagon and elsewhere?

It isn’t like double entry accounting was invented last year and accounting software is all that buggy.

Forcing the Pentagon and others to disgorge accounting data would be a fire step.

The second step would be to map the data with its original identifiers. So it would be possible to return to that same location as last year and if the data is missing, to ask where is it now? With enough specifics to have teeth.

Let the Pentagon keep it self-licking ice cream cone accounting systems.

But attack it with mapping of data and semantics to create audit trails into that wasteland.

Data warfare is a given. The question is whether you intend to win or lose?

Ugly [And Mis-leading on Gun Control]

Filed under: Government,Graphics,Visualization — Patrick Durusau @ 7:40 pm

Ugly ugly ugly by Andrew Gelman.

I agree with Andrew’s Gelman’s comments on:

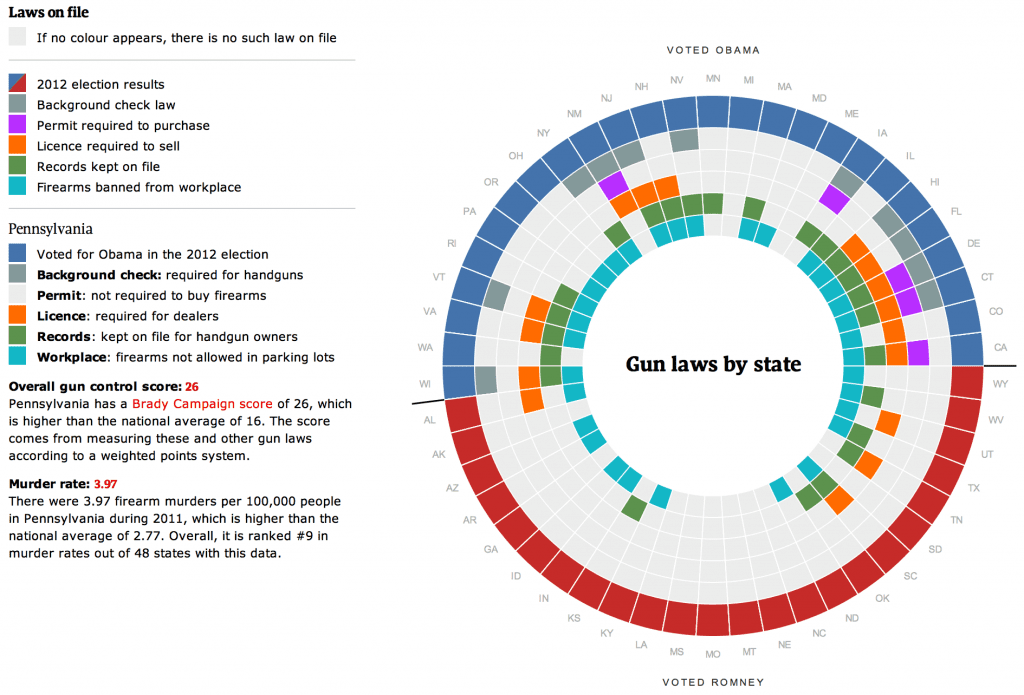
Gun laws graphic

Well, except for his criticism of the author’s spelling. 😉

The chart is also seriously misleading.

Does no color other than presidential vote = no gun control?

A likely conclusion, but the wrong conclusion.

States with only “Voted for Romney in the 2012 election” block colored are:

  1. Arizona
  2. Kentucky
  3. Louisiana
  4. Montana
  5. North Dakota
  6. Oklahoma
  7. Texas
  8. Utah

How many of those prohibit gun possession by convicted felons? (A form of gun control.)

Would you believe 100%?

  1. Arizona – ARS 13-3101
  2. Kentucky – KRS 527.040
  3. Louisiana – La. R.S. 14:95.1
  4. Montana – Montana Code Annotated, 45-8-313
  5. North Dakota – 62.1-02-01, et seq.
  6. Oklahoma – OUJI-CR 6-39
  7. Texas – Texas Penal Code, Title 10, Chapter 46, Section 46.04. Unlawful Possession of Firearm
  8. Utah – Title 76 Chapter 10 Section 503

For fairness sake:

States with only “Voted for Obama in the 2012 election” block colored are:

  1. Idaho – Title 18, 18-3316
  2. Minnesota – 2012 Statutes, 624.713

Obama and Romney states support gun control.

They prohibit felons (without pardons) from possessing/owning firearms (often other restrictions as well).

The question of “gun control” has been answered with a resounding yes!

The question is: Whose guns will be controlled and to what extent?

Don’t go into a gun control debate unarmed!

Strata 2013

Filed under: BigData,Conferences,Information Science — Patrick Durusau @ 7:40 pm

Strata 2013

Feb. 26-28, 2013
Santa Clara, CA

From the website:

The breadth and depth of expertise at Strata is unsurpassed—with over 120 speakers and 100 presentations and events, you’ll find solutions to your most pressing data issues. The conference program covers strategy, technology, and policy:

  • Data-driven Business: Solve some of today’s thorniest business problems with big data, new interfaces, and the advent of ubiquitous computing.
  • Big Data for Enterprise IT: Create big data strategy, manage your first project, demystify vendor solutions, and understand how big data differs from BI.
  • Beyond Hadoop: Dive deep into Cassandra, Storm, Drill, and other emerging technologies.
  • Connected World: Explore the implications—and opportunities—as low-cost networks and sensors create an ever-connected world.
  • Data Science: Immerse yourself inside the world of data practictioners—from the hard science of new algorithms to cultural change and teambuilding.
  • Design: Make data matter with highly effective user experiences, using new interfaces, interactivity, and visualization.
  • Hadoop in Practice: Get practical lessons, integration tricks, and a glimpse of the road ahead.
  • Law, Ethics, and Open Data: Tackle the biggest issues in compliance, governance, and ethics in the era of open data and heightened privacy concerns.

OK, it’s not Balisage (Markup Olympics (Balisage) [No Drug Testing])) but it isn’t in August/Montreal either. 😉

Still, a great gathering of data/information folk, if more general than Balisage.

Assembling a Python Machine Learning Toolkit

Filed under: Machine Learning,Python — Patrick Durusau @ 7:40 pm

Assembling a Python Machine Learning Toolkit by Sujit Pal.

From the post:

I had been meaning to read Peter Harrington’s book Machine Learning In Action (MLIA) for a while now, and I finally finished reading it earlier this week (my review on Amazon is here). The book provides Python implementations of 8 of the 10 Top Algorithms in Data Mining listed in this paper (PDF). The math package used in the examples is Numpy, and the charts are built using Matplotlib.

In the past, the little ML work I have done has been in Java, because that was the language and ecosystem I knew best. However, given the experimental, iterative nature of ML work, its probably not the most ideal language to use. However, there are lots of options when it comes to languages for ML – over the last year, I have learned Octave (open-source version of MATLAB) for the Coursera Machine Learning class and R for the Coursera Statistics One and Computing for Data Analysis classes (still doing the second one). But because I know Python already, Python/Numpy looks easier to use than Octave, and Python/Matplotlib looks as simple as using R graphics. There is also the pandas package which provides R-like features, although I haven’t used it yet.

Looking around on the net, I find that many other people have reached similar conclusions – ie, that Python seems to be the way to go for initial prototyping work in ML. I wanted to set up a small toolbox of Python libraries that will allow me to do this also. I settled on an initial list of packages based on the Scipy Superpack, but since I am still on Mac OS (Snow Leopard) I could not use the script from there. There were some issues I had to work through to make this to work, so I document this here, so if you are in the same situation this may help you.

Unlike the Scipy Superpack, which seems to prefer versions that are often the bleeding edge development versions, I decided to stick to the latest stable release versions for each of the libraries. Here they are:

Sujit’s post will save you a few steps in assembling your Python machine learning toolkit.

Pass it on.

January 22, 2013

Hortonworks Sandbox — the Fastest On Ramp to Apache Hadoop

Filed under: Hadoop,Hortonworks — Patrick Durusau @ 2:42 pm

Hortonworks Sandbox — the Fastest On Ramp to Apache Hadoop by Cheryle Custer.

From the post:

Today Hortonworks announced the availability of the Hortonworks Sandbox, an easy-to-use, flexible and comprehensive learning environment that will provide you with fastest on-ramp to learning and exploring enterprise Apache Hadoop.

The Hortonworks Sandbox is:

  • A free download
  • A complete, self contained virtual machine with Apache Hadoop pre-configured
  • A personal, portable and standalone Hadoop environment
  • A set of hands-on, step-by-step tutorials that allow you to learn and explore Hadoop on your own

The Hortonworks Sandbox is designed to help close the gap between people wanting to learn and evaluate Hadoop, and the complexities of spinning up an evaluation cluster of Hadoop. The Hortonworks Sandbox provides a powerful combination of hands-on, step-by-step tutorials paired with an easy to use Web interface designed to lower the learning curve for people who just want to explore and evaluate Hadoop, as quickly as possible.

BTW, the tutorials can be refreshed to load new tutorials as they are released.

A marketing/teaching strategy that merits imitation by others.

BioNLP-ST 2013

Filed under: Bioinformatics,Biomedical,Medical Informatics — Patrick Durusau @ 2:42 pm

BioNLP-ST 2013

Dates:

Training Data Release 12:00 IDLW, 17 Jan. 2013
Test Data Release 22 Mar. 2013
Result Submission 29 Mar. 2013
BioNLP’11 Workshop 8-9 Aug. 2013

From the website:

The BioNLP Shared Task (BioNLP-ST) series represents a community-wide trend in text-mining for biology toward fine-grained information extraction (IE). The two previous events, BioNLP-ST 2009 and 2011, attracted wide attention, with over 30 teams submitting final results. The tasks and their data have since served as the basis of numerous studies, released event extraction systems, and published datasets. The upcoming BioNLP-ST 2013 follows the general outline and goals of the previous tasks. It identifies biologically relevant extraction targets and proposes a linguistically motivated approach to event representation. The tasks in BioNLP-ST 2013 cover many new hot topics in biology that are close to biologists’ needs. BioNLP-ST 2013 broadens the scope of the text-mining application domains in biology by introducing new issues on cancer genetics and pathway curation. It also builds on the well-known previous datasets GENIA, LLL/BI and BB to propose more realistic tasks that considered previously, closer to the actual needs of biological data integration.

The first event in 2009 triggered active research in the community on a specific fine-grained IE task. Expanding on this, the second BioNLP-ST was organized under the theme “Generalization”, which was well received by participants, who introduced numerous systems that could be straightforwardly applied to multiple tasks. This time, the BioNLP-ST takes a step further and pursues the grand theme of “Knowledge base construction”, which is addressed in various ways: semantic web (GE, GRO), pathways (PC), molecular mechanisms of cancer (CG), regulation networks (GRN) and ontology population (GRO, BB).

As in previous events, manually annotated data will be provided for training, development and evaluation of information extraction methods. According to their relevance for biological studies, the annotations are either bound to specific expressions in the text or represented as structured knowledge. Many tools for the detailed evaluation and graphical visualization of annotations and system outputs will be available for participants. Support in performing linguistic processing will be provided to the participants in the form of analyses created by various state-of-the art tools on the dataset texts.

Participation to the task will be open to the academia, industry, and all other interested parties.

Tasks:

Quick question: Do you think there is semantically diverse data available for each of these tasks?

I first saw this at: BioNLP Shared Task: Text Mining for Biology Competition.

Mahout on Windows Azure…

Filed under: Azure Marketplace,Hadoop,Hortonworks,Machine Learning,Mahout — Patrick Durusau @ 2:42 pm

Mahout on Windows Azure – Machine Learning Using Microsoft HDInsight by Istvan Szegedi.

From the post:

Our last post was about Microsoft and Hortonworks joint effort to deliver Hadoop on Microsoft Windows Azure dubbed HDInsight. One of the key Microsoft HDInsight components is Mahout, a scalable machine learning library that provides a number of algorithms relying on the Hadoop platform. Machine learning supports a wide range of use cases from email spam filtering to fraud detection to recommending books or movies, similar to Amazon.com features.These algorithms can be divided into three main categories: recommenders/collaborative filtering, categorization and clustering. More details about these algorithms can be read on Apache Mahout wiki.

Are you hearing Hadoop, Mahout, HBase, Hive, etc., as often as I am?

Does it make you wonder about Apache becoming the locus of transferable IT skills?

Something to think about as you are developing topic map ecosystems.

You can hand roll your own solutions.

Or build upon solutions that have widespread vendor support.

PS: Another great post from Istvan.

Prediction API – Machine Learning from Google

Filed under: Google Prediction,Machine Learning,Prediction,Topic Maps — Patrick Durusau @ 2:42 pm

Prediction API – Machine Learning from Google by Istvan Szegedi.

From the post:

One of the exciting APIs among the 50+ APIs offered by Google is the Prediction API. It provides pattern matching and machine learning capabilities like recommendations or categorization. The notion is similar to the machine learning capabilities that we can see in other solutions (e.g. in Apache Mahout): we can train the system with a set of training data and then the applications based on Prediction API can recommend (“predict”) what products the user might like or they can categories spams, etc.

In this post we go through an example how to categorize SMS messages – whether they are spams or valuable texts (“hams”).

Nice introduction to Google’s Prediction API.

A use case for topic map authoring would be to route content to appropriate experts for further evaluation.

Click Dataset [HTTP requests]

Filed under: Dataset,Graphs,Networks,WWW — Patrick Durusau @ 2:41 pm

Click Dataset

From the webpage:

To foster the study of the structure and dynamics of Web traffic networks, we make available a large dataset (‘Click Dataset’) of HTTP requests made by users at Indiana University. Gathering anonymized requests directly from the network rather than relying on server logs and browser instrumentation allows one to examine large volumes of traffic data while minimizing biases associated with other data sources. It also provides one with valuable referrer information to reconstruct the subset of the Web graph actually traversed by users. The goal is to develop a better understanding of user behavior online and create more realistic models of Web traffic. The potential applications of this data include improved designs for networks, sites, and server software; more accurate forecasting of traffic trends; classification of sites based on the patterns of activity they inspire; and improved ranking algorithms for search results.

The data was generated by applying a Berkeley Packet Filter to a mirror of the traffic passing through the border router of Indiana University. This filter matched all traffic destined for TCP port 80. A long-running collection process used the pcap library to gather these packets, then applied a small set of regular expressions to their payloads to determine whether they contained HTTP GET requests.

Data available under terms and restrictions, including transfer by physical hard drive (~ 2.5 TB of data).

Intrigued by the notion of a “subset of the Web graph actually traversed by users.”

Does that mean that semantic annotation should occur on the portion of the “…Web graph actually traversed by users” before reaching other parts?

If the language of 4,148,237 English Wikipedia pages is never in doubt for any user, do we really need triples to record that for every page?

« Newer PostsOlder Posts »

Powered by WordPress