Another Word For It Patrick Durusau on Topic Maps and Semantic Diversity

September 10, 2012

Reveal—visual eQTL analytics [Statistics of Identity/Association]

Filed under: Bioinformatics,Biomedical,Genome — Patrick Durusau @ 1:36 pm

Reveal—visual eQTL analytics by Günter Jäger, Florian Battke and Kay Nieselt. (Bioinformatics (2012) 28 (18): i542-i548. doi: 10.1093/bioinformatics/bts382)

Abstract

Motivation: The analysis of expression quantitative trait locus (eQTL) data is a challenging scientific endeavor, involving the processing of very large, heterogeneous and complex data. Typical eQTL analyses involve three types of data: sequence-based data reflecting the genotypic variations, gene expression data and meta-data describing the phenotype. Based on these, certain genotypes can be connected with specific phenotypic outcomes to infer causal associations of genetic variation, expression and disease.

To this end, statistical methods are used to find significant associations between single nucleotide polymorphisms (SNPs) or pairs of SNPs and gene expression. A major challenge lies in summarizing the large amount of data as well as statistical results and to generate informative, interactive visualizations.

Results: We present Reveal, our visual analytics approach to this challenge. We introduce a graph-based visualization of associations between SNPs and gene expression and a detailed genotype view relating summarized patient cohort genotypes with data from individual patients and statistical analyses.

Availability: Reveal is included in Mayday, our framework for visual exploration and analysis. It is available at http://it.inf.uni-tuebingen.de/software/reveal/.

Contact: guenter.jaeger@uni-tuebingen.de

Interesting work on a number of fronts, not the least of it being “…analysis of expression quantitative trait locus (eQTL) data.”

Its use of statistical methods to discover “significant associations,” interactive visualizations and processing of “large, heterogeneous and complex data” are of more immediate interest to me.

Wikipedia is evidence for subjects (including relationships) that can be usefully identified using URLs. But that is only a fraction of all the subjects and relationships we may want to include in our topic maps.

An area I need to work up for my next topic map course is probabilistic identification of subjects and their relationships. What statistical techniques are useful for what fields? Or even what subjects within what fields? What are the processing tradeoffs versus certainty of identification?

Suggestions/comments?
Graphlet-based edge clustering reveals pathogen-interacting proteins

Filed under: Clustering,Graphs,Networks,Similarity,Topology — Patrick Durusau @ 1:06 pm

Graphlet-based edge clustering reveals pathogen-interacting proteins by R. W. Solava, R. P. Michaels and T. Milenković. (Bioinformatics (2012) 28 (18): i480-i486. doi: 10.1093/bioinformatics/bts376)

Abstract:

Motivation: Prediction of protein function from protein interaction networks has received attention in the post-genomic era. A popular strategy has been to cluster the network into functionally coherent groups of proteins and assign the entire cluster with a function based on functions of its annotated members. Traditionally, network research has focused on clustering of nodes. However, clustering of edges may be preferred: nodes belong to multiple functional groups, but clustering of nodes typically cannot capture the group overlap, while clustering of edges can. Clustering of adjacent edges that share many neighbors was proposed recently, outperforming different node clustering methods. However, since some biological processes can have characteristic ‘signatures’ throughout the network, not just locally, it may be of interest to consider edges that are not necessarily adjacent.

Results: We design a sensitive measure of the ‘topological similarity’ of edges that can deal with edges that are not necessarily adjacent. We cluster edges that are similar according to our measure in different baker’s yeast protein interaction networks, outperforming existing node and edge clustering approaches. We apply our approach to the human network to predict new pathogen-interacting proteins. This is important, since these proteins represent drug target candidates.

Availability: Software executables are freely available upon request.

Contact: tmilenko@nd.edu

Of interest for bioinformatics but more broadly for its insights into topological similarity and edge clustering by topological similarity.

Being mindful that an “edge” is for all intents and purposes a “node” that records a connection between two (non-hyperedge and non-looping edge) other nodes. Nodes could, but don’t generally record their connection to other nodes, that connection being represented by an edge.

Author Identifiers (arXiv.org) [> one (1) identifier per subject]

Filed under: Identification,Identifiers,Subject Identifiers — Patrick Durusau @ 10:25 am

I happened upon an author who used an arXiv.org author identifier at their webpage.

From the arXiv.org page:

It is a long-term goal of arXiv to accurately identify and disambiguate all authors of all articles in arXiv. Such identification would provide accurate results for queries such as "show me all the other papers by the particular John Smith that wrote this paper", something that can be done only approximately with text-based searches. It would also permit construction of an author-article graph which is useful for relevance
assessment and bibliometric analysis.

Since 2005 arXiv has used authority records that associate user accounts with articles authored by that user. These records support the endorsement system. The use of public author identifiers as a way to build services upon this data is new in 2009. Initially, users must opt-in to have a public author identifier and to expose the record of their articles on arXiv for use in other services. At some later date we hope to be able to improve our authority records to the point where we can create public author identifiers for all authors of arXiv articles without needing to enlist the help of each author to check their record before opting in.

The services we offer based on author identifiers are:

Significant enough in its own right but note the plans for the future:

The following enhancements and interoperability features are planned:

  • arXiv will permit authors to record other identifiers they have in other schemes and include these in the data feeds. This will allow agents and systems to link together the same author in different databases.
  • arXiv will support mechanisms for handling name changes, combination of accidentally created duplicates and separation of accidentally combined identifiers.

Recoding other identifiers? What? Acknowledge that there can be more than one identifier (yours) per subject? Blasphemy! 😉

Go arXiv.org!

I am sure suggestions, support, contributions, etc., would be most welcome.

Learning Mahout : Classification

Filed under: Classification,Machine Learning,Mahout — Patrick Durusau @ 10:01 am

Learning Mahout : Classification by Sujit Pal.

From the post:

The final part covered in the MIA book is Classification. The popular algorithms available are Stochastic Gradient Descent (SGD), Naive Bayes and Complementary Naive Bayes, Random Forests and Online Passive Aggressive. There are other algorithms in the pipeline, as seen from the Classification section of the Mahout wiki page.

The MIA book has generic classification information and advice that will be useful for any algorithm, but it specifically covers SGD, Bayes and Naive Bayes (the last two via Mahout scripts). Of these SGD and Random Forest are good for classification problems involving continuous variables and small to medium datasets, and the Naive Bayes family is good for problems involving text like variables and medium to large datasets.

In general, a solution to a classification problem involves choosing the appropriate features for classification, choosing the algorithm, generating the feature vectors (vectorization), training the model and evaluating the results in a loop. You continue to tweak stuff in each of these steps until you get the results with the desired accuracy.

Sujit notes that classification is under rapid development. The classification material is likely to become dated.

Some additional resources to consider:

Mahout User List (subscribe)

Mahout Developer List (subscribe)

IRC: Mahout’s IRC channel is #mahout.

Mahout QuickStart

Heroku and Cassandra – Cassandra.io RESTful APIs

Filed under: Cassandra,Heroku — Patrick Durusau @ 6:47 am

Heroku and Cassandra – Cassandra.io RESTful APIs by Istvan Szegedi.

From the post:

Introduction

Last time I wrote about Hadoop on Heroku which is on add-on from Treasure Data – this time I am going to cover NoSQL on Heroku.

There are various datastore services – add-ons in Heroku terms – available from MongoDB (MongoHQ) to CouchDB (Cloudant) to Cassandra (Cassandra.io). This post is devoted to Cassandra.io.

Cassandra.io

Cassandra.io is a hosted and managed Cassandra ring based on Apache Cassandra and makes it accessible via RESTful API. As of writing this article, the Cassandra.io client helper libraries are available in Java, Ruby and PHP, and there is also a Objective-C version in private beta. The libraries can be downloaded from github. I use the Java library in my tests.

Heroku – and Cassandra.io add-on, too – is built on Amazon Elastic Compute Cloud (EC2) and it is supported in all Amazon’s locations. Note: Cassandra.io add-on is in public beta now that means you have only one option called Test available – this is free.

Another opportunity to explore your NoSQL options.

September 9, 2012

Wandora – Release – 2012-08-31

Filed under: Topic Map Software,Topic Maps,Wandora — Patrick Durusau @ 5:52 pm

Wandora has a new release as of 2012-08-31.

Overview of the new features reports:

New Wandora application release (2012-08-31) is available. New features include a Guardian open platform extractor, a Freebase extractor, a DOT graph format export and a topic map layer visualization based on D3. Moreover, graph panel views now occurrences and graph panel filter management is easier. Release contains fixes on LTM import and disables some deprecated extractors.

Changelog.

Downloads.

Your experiences with the extractor modules in Wandora appreciated.

Apache Hadoop YARN – Concepts and Applications

Filed under: Hadoop,Hadoop YARN — Patrick Durusau @ 4:29 pm

Apache Hadoop YARN – Concepts and Applications by Jim Walker.

From the post:

In our previous post we provided an overview and an outline of the motivation behind Apache Hadoop YARN, the latest Apache Hadoop subproject. In this post we cover the key YARN concepts and walk through how diverse user applications work within this new system.

I thought I had missed a post in this series and I had! 😉

Enjoy!

Reverse engineering of gene regulatory networks from biological data [self-conscious?]

Filed under: Bioinformatics,Biomedical,Networks — Patrick Durusau @ 4:25 pm

Reverse engineering of gene regulatory networks from biological data by Li-Zhi Liu, Fang-Xiang Wu, Wen-Jun Zhang. (Wiley Interdisciplinary Reviews: Data Mining and Knowledge Discovery, Volume 2, Issue 5, pages 365–385, September/October 2012)

Abstract:

Reverse engineering of gene regulatory networks (GRNs) is one of the most challenging tasks in systems biology and bioinformatics. It aims at revealing network topologies and regulation relationships between components from biological data. Owing to the development of biotechnologies, various types of biological data are collected from experiments. With the availability of these data, many methods have been developed to infer GRNs. This paper firstly provides an introduction to the basic biological background and the general idea of GRN inferences. Then, different methods are surveyed from two aspects: models that those methods are based on and inference algorithms that those methods use. The advantages and disadvantages of these models and algorithms are discussed.

As you might expect, heterogeneous data is one topic of interest in this paper:

Models Based on Heterogeneous Data

Besides the dimensionality problem, the data from microarray experiments always contain many noises and measurement errors. Therefore, an accurate network can hardly be obtained due to the limited information in microarray data. With the development of technologies, a large amount of other diverse types of genomic data are collected. Many researchers are motivated to study GRNs by combining these data with microarray data. Because different types of the genomic data reflect different aspects of underlying networks, the inferences of GRNs based on the integration of different types of data are expected to provide more accurate and reliable results than based on microarray data alone. However, effectively integrating heterogeneous data is currently a hot research topic and a nontrivial task because they are generally collected along with much noise and related to each other in a complex way. (emphasis added)

Truth be known, high dimensionality and heterogeneous data are more accurate reflections of the objects of our study.

Conversely, the lower the dimensions of a model or the greater the homogeneity of the data, the less accurate they become.

Are we creating less accurate reflections to allow for the inabilities of our machines?

Will that make our machines less self-conscious about their limitations?

Or will that make us less self-conscious about our machines’ limitations?

Mining Chemical Libraries with “Screening Assistant 2”

Filed under: Cheminformatics,Searching,Visualization — Patrick Durusau @ 3:54 pm

Mining Chemical Libraries with “Screening Assistant 2” by Vincent Le Guilloux, Alban Arrault, Lionel Colliandre, Stéphane Bourg, Philippe Vayer and Luc Morin-Allory (Journal of Cheminformatics 2012, 4:20 doi:10.1186/1758-2946-4-20)

Abstract:

Background

High-throughput screening assays have become the starting point of many drug discovery programs for large pharmaceutical companies as well as academic organisations. Despite the increasing throughput of screening technologies, the almost in nite chemical space remains out of reach, calling for tools dedicated to the analysis and selection of the compound collections intended to be screened.

Results

We present Screening Assistant 2 (SA2), an open-source JAVA software dedicated to the storage and analysis of small to very large chemical libraries. SA2 stores unique molecules in a MySQL database, and encapsulates several chemoinformatics methods, among which: providers management, interactive visualisation, sca old analysis, diverse subset creation, descriptors calculation, sub-structure / SMART search, similarity search and filtering. We illustrate the use of SA2 by analysing the composition of a database of 15 million compounds collected from 73 providers, in terms of scaffolds, frameworks, and undesired properties as defined by recently proposed HTS SMARTS filters. We also show how the software can be used to create diverse libraries based on existing ones.

Conclusions

Screening Assistant 2 is a user-friendly, open-source software that can be used to manage collections of compounds and perform simple to advanced chemoinformatics analyses. Its modular design and growing documentation facilitate the addition of new functionalities, calling for contributions from the community. The software can be downloaded at http://sa2.sourceforge.net/.

And you thought you had “big data:”

Exploring biology through the activity of small molecules is an established paradigm used in drug research for several decades now [1, 2]. Today, a state of the art drug discovery program often begins with screening campaigns aiming at the identification of novel biologically active molecules. In the recent years, the rise of High Throughput Screening (HTS), combinatorial chemistry and the availability of large compound collections has led to a dramatic increase in the size of screening libraries, for both private companies and public organisations [3, 4]. Yet, despite these constantly increasing capabilities, various authors have stressed the need to design better instead of larger screening libraries [5–9]. Chemical space is indeed known to be almost infinite, and selecting the appropriate regions to explore for the problem at hand remains a challenging task. (emphasis added)

I would paraphrase the highlighted part to read:

Semantic space is known to be infinite, and selecting appropriate regions for the problem at hand remains a challenging task.

Or to put it differently, if I have a mapping strategy that works for clinical information systems or (U.S.) DoD contracting records or some other domain, that’s great!

I don’t need to look for a universal mapping solution.

Not to mention that I can produce results (and get paid) more quickly than waiting for a universal mapping solution.

Functional Programming From First Principles

Filed under: Functional Programming — Patrick Durusau @ 3:45 pm

Erik Meijer – Functional Programming From First Principles

From the description:

Our favorite iconoclast, Erik Meijer, presented a very interesting talk at a recent GOTO Chicago event, Functional Programming Night. He originally planned on doing his popular “Fundamentalist Functional Programming” talk, but instead decided to address FP from a slightly different angle – “Functional Programming from First Principles”. (Speaking of FP first principles, if you haven’t seen Erik’s FP lecture series, well, you really should!).

Has Erik changed his mind about rampant side effects and imperative programming? What’s going to happen to the poor monkey Rich Hickey made reference to several times in his excellent talk The Database as a Value (which he presented after Erik’s talk)? Is Erik still a functional programming fundamentalist? Watch and decide. As you’d expect, it’s high energy, brilliant Erik all the way.

From near the end:

Functional “Programming” is a tool for thought.

Imperative “Programming” is a tool for hacking.

Deeply entertaining.

Has been posted for 1 day with a reported > 20,986 views. (You can take that as a recommendation.)

Best Open Source[?]

Filed under: Open Source,Software — Patrick Durusau @ 3:16 pm

Best Open Source

Are you familiar with this open source project listing site?

I ask because I encountered it today and while it looks interesting, I have the following concerns:

  • Entries are not dated (at least that I can find). Undated entries are not quite useless but nearly so.
  • Entries are not credited (no authors cited). Another strike against the entries.
  • Rating (basis for) isn’t clear.

It looks suspicious but it could be poor design.

Comments/suggestions?

Books as Islands/Silos – e-book formats

Filed under: eBooks,Publishing — Patrick Durusau @ 3:03 pm

After posting about the panel discussion on the future of the book, I looked up the listing of e-book formats at Wikipedia and found:

  1. Archos Diffusion
  2. Broadband eBooks (BBeB)
  3. Comic Book Archive file
  4. Compiled HTML
  5. DAISY – ANSI/NISO Z39.86
  6. Desktop Author
  7. DjVu
  8. EPUB
  9. eReader
  10. FictionBook (Fb2)
  11. Founder Electronics
  12. Hypertext Markup Language
  13. iBook (Apple)
  14. IEC 62448
  15. KF8 (Amazon Kindle)
  16. Microsoft LIT
  17. Mobipocket
  18. Multimedia eBooks
  19. Newton eBook
  20. Open Electronic Package
  21. Portable Document Format
  22. Plain text files
  23. Plucker
  24. PostScript
  25. SSReader
  26. TealDoc
  27. TEBR
  28. Text Encoding Initiative
  29. TomeRaider

Beyond different formats, the additional issue being that each book stands on its own.

Imagine a “hover” over a section of interest in a book and relevant other “sections” from other books are also displayed.

Is anyone working on a mapping across these various formats? (Not conversion, “mapping across” language chosen deliberately. Conversion might violate a EULA. Navigation with due regard to the EULA would be difficult to prohibit.)

I realize some of them are too seldom used for commercially viable material to be of interest. Or may be of interest only in certain markets (SSReader for instance).

Not the classic topic map case of identifying duplicate content in different guises but producing navigation across different formats to distinct material.

Books, Bookstores, Catalogs [30% Digital by end of 2012, Books as Islands/Silos]

Filed under: Books,Publishing — Patrick Durusau @ 2:12 pm

Books, Bookstores, Catalogs by Kevin Hillstrom.

From the post:

The parallels between books, bookstores, and catalogs are significant.

So take fifty minutes this weekend, and watch this session that was recently broadcast on BookTV, titled “The Future of the Book and Bookstore“.

This is fifty minutes of absolutely riveting television, seriously! Boring setting, riveting topic.

Jim Milliot (Publishers Weekly) tossed out an early tidbit: 30% of book sales will be digital by the end of 2012.

LIssa Muscatine, Politics & Prose bootstore owner: When books are a smaller part of the revenue stream, have to diversify the revenue stream. Including print on demand from a catalog of 7 million books.

Sam Dorrance Potomac Books (publisher): Hard copy sales will likely decrease by ten percent (10%) per year for the next several years.

Recurrent theme: Independent booksellers can provide guidance to readers. Not the same thing as “recommendation” because it is more nuanced.

Rafe Sagalyn Sagalyn Literary Agency: Now a buyers market. Almost parity between hard copy and ebook sales.

Great panel but misses the point that books, hard copy or digital, remain isolated islands/silos.

Want to have a value-add that is revolutionary?

Create links across Kindle and other electronic formats, so that licensed users are not isolated within single works.

Did I hear someone say topic maps?

ContextNote [Topic Map-based, semantic note taking]

Filed under: Topic Map Software,Topic Maps — Patrick Durusau @ 1:26 pm

ContextNote

From the website:

Note taking and Personal Knowledge Management (PKM)

ContextNote is a multi-platform (Web, Android, and iOS), topic map-based, semantic note taking application. Click the following link to see to see screen shots of ContextNote for Web in action.

Objective

To make the management of personal knowledge both simple and intuitive while at the same time being able to take full advantage of the expressive modelling capabilities of topic maps.

Well, that’s the trick isn’t it?

To make “…management of personal knowledge both simple and intuitive…” with “…full advantage of the expressive modelling capabilities of topic maps.”

Looking forward to more news about how ContextNote balances those goals.

Seven reasons why I like Spark

Filed under: BigData,Spark — Patrick Durusau @ 12:57 pm

Seven reasons why I like Spark by Ben Lorica.

From the post:

A large portion of this week’s Amp Camp at UC Berkeley, is devoted to an introduction to Spark – an open source, in-memory, cluster computing framework. After playing with Spark over the last month, I’ve come to consider it a key part of my big data toolkit. Here’s why:

Hadoop integration: Spark can work with files stored in HDFS, an important feature given the amount of investment in the Hadoop Ecosystem. Getting Spark to work with MapR is straightforward.

The Spark interactive Shell: Spark is written in Scala, and has it’s own version of the Scala interpreter. I find this extremely convenient for testing short snippets of code.

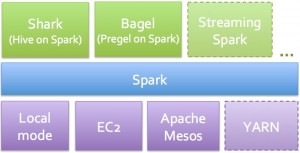
The Spark Analytic Suite:


(Figure courtesy of Matei Zaharia)

Spark comes with tools for interactive query analysis (Shark), large-scale graph processing and analysis (Bagel), and real-time analysis (Spark Streaming). Rather than having to mix and match a set of tools (e.g., Hive, Hadoop, Mahout, S4/Storm), you only have to learn one programming paradigm. For SQL enthusiasts, the added bonus is that Shark tends to run faster than Hive. If you want to run Spark in the cloud, there are a set of EC2 scripts available.

Resilient Distributed Data sets (RDD’s):
RDD’s are distributed objects that can be cached in-memory, across a cluster of compute nodes. They are the fundamental data objects used in Spark. The crucial thing is that fault-tolerance is built-in: RDD’s are automatically rebuilt if something goes wrong. If you need to test something out, RDD’s can even be used interactively from the Spark interactive shell.

Be sure to follow the link to the AMP workshop (August 21-22, 2012) for videos on the Spark framework.

September 8, 2012

QRU-1: A Public Dataset…

Filed under: Query Expansion,Query Rewriting,Search Behavior,Search Data,Search Engines — Patrick Durusau @ 4:58 pm

QRU-1: A Public Dataset for Promoting Query Representation and Understanding Research by Hang Li, Gu Xu, W. Bruce Croft, Michael Bendersky, Ziqi Wang and Evelyne Viegas.

ABSTRACT

A new public dataset for promoting query representation and understanding research, referred to as QRU-1, was recently released by Microsoft Research. The QRU-1 dataset contains reformulations of Web TREC topics that are automatically generated using a large-scale proprietary web search log, without compromising user privacy. In this paper, we describe the content of this dataset and the process of its creation. We also discuss the potential uses of the dataset, including a detailed description of a query reformulation experiment.

And the data set:

Query Representation and Understanding Set

The Query Representation and Understanding (QRU) data set contains a set of similar queries that can be used in web research such as query transformation and relevance ranking. QRU contains similar queries that are related to existing benchmark data sets, such as TREC query sets. The QRU data set was created by extracting 100 TREC queries, training a query-generation model and a commercial search engine, generating similar queries from TREC queries with the model, and removal of mistakenly generated queries.

Are query reformulations in essence different identifications of the subject of a search?

But the issue isn’t “more” search results but rather higher quality search results.

Why search engines bother (other than bragging rights) to report “hits” beyond the ones displayed isn’t clear. Just have a “next N hits” button.

You could consider the number of “hits” you don’t look at as a measure of your search engine’s quality. The higher the number…., well, you know. Could be gold in those “hits” but you will never know. And your current search engine will never say.

Customizing the java classes for the NCBI generated by XJC

Filed under: Bioinformatics,Java — Patrick Durusau @ 4:28 pm

Customizing the java classes for the NCBI generated by XJC by Pierre Lindenbaum.

From the post:

Reminder: XJC is the Java XML Binding Compiler. It automates the mapping between XML documents and Java objects:

(mapping graphic omitted)

The code generated by XJC allows to :

  • Unmarshal XML content into a Java representation
  • Access and update the Java representation
  • Marshal the Java representation of the XML content into XML content

This post caught my eye because Pierre is adding an “equals” method.

It is a string equivalence test and for data in question that makes sense.

Your “equivalence” test might be more challenging.

Bioinformatics Tools in Haskell

Filed under: Bioinformatics,Haskell — Patrick Durusau @ 3:46 pm

Bioinformatics Tools in Haskell by Udo Stenzel.

From the post:

This is a collection of miscellaneous stuff that deals mostly with high-throughput sequencing data. I took some of my throw-away scripts that had developed a life of their own, separated out a library, and cleaned up the rest. Everything is licensed under the GPL and naturally comes without any warranty.

Most of the stuff here is written in Haskell. The natural way to run these programs is to install the Haskell Platform, which may be as easy as running ‘apt-get install haskell-platform‘, e.g. on Debian Testing aka “Squeeze”. Instead, you can install\ the Glasgow Haskell Compiler and Cabal individually. After that, download, unpack and ‘cabal install‘ Biohazard first, then install whatever else you need.

If you don’t want to become a Haskell programmer (you really should), you can still download the binary packages (for Linux on ix86_64) and hope that they work. You’ll probably need to install Gnu MP (‘apt-get install libgmp-dev‘ might do it). If the binaries don’t work for you, I don’t care; use the source instead.

Good for bioinformatics and I suspect for learning Haskell in high-throughput situations.

Speculation: How will processing change when there is only “high-throughput data streams?”

That is there isn’t any “going back” to find legacy data, you just wait for it to reappear in the stream?

Or if there were streams of “basic” data that doesn’t change much along with other data streams that are “new” or rapidly changing data.

If that sounds wasteful of bandwidth, imagine if bandwidth were to increase at the same rate as local storage? So that your incoming data connection is 1 TB or higher at your home computer.

Would you really need local storage at all?

Web-Scraper for Google Scholar Updated!

Filed under: R,Web Scrapers — Patrick Durusau @ 3:22 pm

Web-Scraper for Google Scholar Updated! by Kay Cichini.

From the post:

I have updated the Google Scholar Web-Scraper Function GScholarScaper_2 to GScholarScraper_3 (and GScholarScaper_3.1) or it was deprecated due to changes in the Google Scholar html-code. The new script is more slender and faster. It returns a dataframe or optionally a CSV-file with the titles, authors, publications & links. Feel free to report bugs, etc.

An R function to use in web-scraping Google Scholar.

Remember, anything we can “see,” can be “mapped.”

Clunky interfaces and not using REST can make capture/mapping more difficult but local delivery means data can be captured and mapped. (full stop)

Who’s the Most Influential in a Social Graph?

Filed under: Graphs,Social Graphs — Patrick Durusau @ 3:11 pm

Who’s the Most Influential in a Social Graph? New Software Recognizes Key Influencers Faster Than Ever

At an airport, many people are essential for planes to take off. Gate staffs, refueling crews, flight attendants and pilots are in constant communication with each other as they perform required tasks. But it’s the air traffic controller who talks with every plane, coordinating departures and runways. Communication must run through her in order for an airport to run smoothly and safely.

In computational terms, the air traffic controller is the “betweenness centrality,” the most connected person in the system. In this example, finding the key influencer is easy because each departure process is nearly the same.

Determining the most influential person on a social media network (or, in computer terms, a graph) is more complex. Thousands of users are interacting about a single subject at the same time. New people (known computationally as edges) are constantly joining the streaming conversation.

Georgia Tech has developed a new algorithm that quickly determines betweenness centrality for streaming graphs. The algorithm can identify influencers as information changes within a network. The first-of-its-kind streaming tool was presented this week by Computational Science and Engineering Ph.D. candidate Oded Green at the Social Computing Conference in Amsterdam.

“Unlike existing algorithms, our system doesn’t restart the computational process from scratch each time a new edge is inserted into a graph,” said College of Computing Professor David Bader, the project’s leader. “Rather than starting over, our algorithm stores the graph’s prior centrality data and only does the bare minimal computations affected by the inserted edges.”

No pointers to the paper, yet, but the software is said to be open source.

Will make a new post when the article appears. To make sure it gets on your radar.

On obvious use of “influence” in a topic map is what topics have the most impact on the subject identities represented by other topics.

Such as if I remove person R, do we still think persons W – Z are members of a terrorist group?

Bonus question: I wonder what influence Jack Menzel, Product Management Director at Google, has in social graphs now?

PS: Just in case you want to watch for this paper to appear:

O. Green, R. McColl, and D.A. Bader, “A Fast Algorithm for Incremental Betweenness Centrality,” ASE/IEEE International Conference on Social Computing (SocialCom), Amsterdam, The Netherlands, September 3-5, 2012.

(From Prof. David A. Bader’s CV page.)

So Long, and Thanks for All The Triples – OKG Shuts Down

Filed under: Google Knowledge Graph,RDF — Patrick Durusau @ 2:48 pm

So Long, and Thanks for All The Triples – OKG Shuts Down by Eric Franzon.

From the post:

I take no pleasure in being right.

Earlier this week, I speculated that the Open Knowledge Graph might be scaled back or shut down. This morning, I awoke to a post by the project’s creators, Thomas Steiner and Stefan Mirea announcing the closing of the OKG.

Eric and the original announcement both quote: Jack Menzel, Product Management Director at Google, as making the following statement:

“We try to make data as accessible as possible to people around the world, which is why we put as much data as as we can in Freebase. However there are a few reasons we can’t participate in your project.

First, the reason we can’t put all the data we have into Freebase is that we’ve acquired it from other sources who have not granted us the rights to redistribute. Much of the local and books data, for example, was given to us with terms that we would not immediately syndicate or provide it to others for free.

Other pieces of data are used, but only with attribution. For example, some data, like images, we feel comfortable using only in the context of search (as it is a preview of content that people will be finding with that search) and some data like statistics from the World Bank should only be shown with proper attribution.

With regards to automatic access to extract the ranking of the content: we block this kind of access to Google because our ranking is the proprietary core of what Google provides whenever you use search—users should access Google via the interfaces we provide.”

I can summarize that for you:

The Open Knowledge Graph (OKG) project is incompatible with the ad-driven business model of Google.

If you want the long version:

  • …not granted us the rights to redistribute.” Google engineered contracts for content that mandate its delivery/presentation via Google ad-driven interfaces. The “…not granted us…” language is always a tip off.
  • …but only with attribution.” That means the Google ad-driven interface as the means for attribution. Their choice you notice.
  • …ranking of content…block….” Probably the most honest part of the quote. Our facts, our revenue stream and we say no.

Illustrates a problem with ad-driven business models:

No ads, no revenue, which means you use our interfaces.

Value-add models avoid that but only with subscription models.

(Do you see another way?)

“how hard can this be?” (Data and Reality)

Filed under: Design,Modeling,Subject Identity — Patrick Durusau @ 2:07 pm

Books that Influenced my Thinking: Kent’s Data and Reality by Thomas Redman.

From the post:

It was the rumor that Steve Hoberman (Technics Publications) planned to reissue Data and Reality by William Kent that led me to use this space to review books that had influenced my thinking about data and data quality. My plan had been to do the review of Data and Reality as soon as it came out. I completely missed the boat – it has been out for some six months.

I first read Data and Reality as we struggled at Bell Labs to develop a definition of data that would prove useful for data quality. While I knew philosophers had debated the merits of various approaches for thousands of years, I still thought “how hard can this be?” About twenty minutes with Kent’s book convinced me. This is really tough.
….

Amazon reports Data and Reality (3rd edition) as 200 pages long.

Looking at a hard copy I see:

  • Prefaces 17-34
  • Chapter 1 Entities 35-54
  • Chapter 2 The Nature of an Information System 55-67
  • Chapter 3 Naming 69-86
  • Chapter 4 Relationships 87-98
  • Chapter 5 Attributes 99-107
  • Chapter 6 Types and Categories and Sets 109-117
  • Chapter 7 Models 119-123
  • Chapter 8 The Record Model 125-137
  • Chapter 9 Philosophy 139-150
  • Bibliography 151-159
  • Index 161-162

Way less than the 200 pages promised by Amazon.

To ask a slightly different question:

“How hard can it be” to teach building data models?

A hard problem with no fixed solution?

Suggestions?

10 Productivity Tips for Working with Large Mind Maps

Filed under: Mapping,Maps,Mind Maps,Visualization — Patrick Durusau @ 1:22 pm

10 Productivity Tips for Working with Large Mind Maps by Roger C. Parker.

From the post:

A while ago, I wrote a series of posts helping individuals get the most out of their mapping efforts. Today, I’d like share 10 productivity tips and best practices for working with large mind maps.

CMI-Image

As illustrated by the image above, mind maps can become substantially difficult to work with when the number of topics exceeds 60. At this size should you try and use MindManager’s Fit Map view, the type size decreases so much so that it becomes difficult to read. If you Zoom In to increase the type size, however, you lose context, or the “big picture” ability to view each topic in relation to all the other topics. So, what do you do?

A number of useful tips while constructing graphical views of topic maps. Or even for construction of topic maps per se.

Except for suggestion #7:

7. Search for duplicates before entering new topics

Inserting a duplicate topic is always a problem. Instead of manually searching through various topics looking for duplicates try using MindManager’s Search In All Open Maps command – it will certainly save you some time.

You should not need that one with good topic map software. 😉

Women’s representation in media:… [Counting and Evaluation]

Filed under: Data,Dataset,News — Patrick Durusau @ 10:46 am

Women’s representation in media: the best data on the subject to date

From the post:

In the first of a series of datablog posts looking at women in the media, we present one year of every article published by the Guardian, Telegraph and Daily Mail, with each article tagged by section, gender, and social media popularity.

(images omitted)

The Guardian datablog has joined forces with J. Nathan Matias of the MIT media lab and data scientist Lynn Cherny to collect what is to our knowledge, the most comprehensive, high resolution dataset available on news content by gender and audience interest.

The dataset covers from July 2011 to June 2012. The post describes the data collection and some rough counts by gender, etc. More analysis to follow.

The data should not be impacted by:

Opinion sections can shape a society’s opinions and therefore are an important measure of women’s voices in society.

It isn’t clear how those claims go together.

Anything being possible the statement that “…opinion sections can shape a society’s opinions…,” is trivially true.

But even if true (an unwarranted assumption), how does that lead to it being “…an important measure of women’s voices in society[?]”

Could be true and have nothing to do with measuring “…women’s voices in society.”

Could be false and have nothing to do with measuring “…women’s voices in society.”

As well as the other possibilities.

Just because we can count something, doesn’t imbue it with relevance for something else that is harder to evaluate.

Women’s voices in society are important. Let’s not demean them by grabbing the first thing we can count as their measure.

Software fences

Filed under: Knowledge,Software — Patrick Durusau @ 10:07 am

Software fences by John D. Cook.

A great quote from G. K. Chesterton.

Do reformers of every generation think their forefathers were fools or do reformers have a mistaken belief in “progress?”

Rather than saying “progress,” what if we say we know things “differently” than our forefathers?

Not better or worse, just differently.

September 7, 2012

HTML5: Render urban population growth on a 3D world globe with Three.js and canvas

Filed under: HTML5,Maps,Marketing,Three.js — Patrick Durusau @ 2:47 pm

HTML5: Render urban population growth on a 3D world globe with Three.js and canvas By jos.dirksen.

From the post:

In this article I’ll once again look at data / geo visualization with Three.js. This time I’ll show you how you can plot the urban population growth over the years 1950 to 2050 on a 3D globe using Three.js. The resulting visualization animates the growth of the world’s largest cities on a rotating 3D world. The result we’re aiming for looks like this (for a working example look here.):

Possible contender for the topic map graphic? A 3D globe?

If you think of topic maps as representing a users world view?

Perhaps, perhaps, but then you will need a flat earth version for some users as well. 😉

Neo4j 1.8.RC1 – Really Careful #ftw

Filed under: Cypher,Graphs,Neo4j — Patrick Durusau @ 2:26 pm

Neo4j 1.8.RC1 – Really Careful #ftw

From the post:

As we prepare the Neo4j 1.8 series for General Availability, we’re moving to an RC model of finalizing production ready software. RC of course stands for Really Careful.

Resisting Changes

Every line of code that is committed to github is greeted with exhaustive continuous testing, earning the developer either a deep-fried twinkie or pickled herring – the reward/punishment is flipped depending on the resident country.

For milestone releases, great care is used to QA the packaged artifacts. Download, install, start/stop, go through the motions of normal use, throw sample applications against it, compare benchmarks, try out language bindings. Yet, we haven’t been entirely comfortable going directly from a milestone to general availability, because the milestone often will have introduced new features and possible breaking changes.

Now, we’re adopting a formal Release Candidate strategy: a feature complete release built from a frozen code base which will only accept bug fixes. An RC could be the GA, but introduces a longer public review before getting the final stamp of approval.

Do you have your copy yet?

Images for your next Hadoop and Big Data presentation [Topic Map Images?]

Filed under: BigData,Hadoop,Marketing — Patrick Durusau @ 2:17 pm

Images for your next Hadoop and Big Data presentation

Images that will help with your next Hadoop/Big Data presentation.

Question: What images will you use for your next topic map presentation?

Possibles:

Raptor

A bit too tame for my tastes. And its doesn’t say: “map” to me. You?

Adam - Sistene Chapel

Hmmm, presumptuous don’t you think? Plus lacking that “map” quality as well.

Barta

It claims to be a map, of sorts. But scarring potential customers isn’t good strategy.

Dante - Inferno

Will be familiar soon enough. Not sure anyone wants a reminder.

Suggestions?

Thinking Functionally with Haskell: Types? Tests? We Need a New Word

Filed under: Functional Programming,Haskell — Patrick Durusau @ 1:42 pm

Thinking Functionally with Haskell: Types? Tests? We Need a New Word by Paul Callaghan.

From the post:

In which we explore what modern type systems bring to the table.

Imagine an approach to programming where you write down some description of what your code should do, then before running your code you run some automatic tool to see if the code matches the description. That’s Test-driven development, you say!

Actually, this is what you are doing when you use static types in most languages too. Types are a description of the code’s inputs and outputs, and the check ensures that inputs and outputs match up and are used consistently. Modern type systems—such as in Haskell or above—are very flexible, and allow these descriptions to be quite detailed; plus they are not too obtrusive in use and often very helpful.

One point I’ll investigate here is how advances in types are converging with new ideas on testing, to the point where (I claim) the old distinctions are starting to blur and starting to open up exciting new possibilities—hence my suggestion that we need a new word to describe what we’re doing that is free from preconceptions and out-dated thinking.

So put aside your bad experiences from Java, and prepare to be amazed!

I suppose we should all wish Paul luck on finding words that are “…free from preconceptions and out-dated thinking.”;-)

It has been my experience that “new” words replace “[existing] preconceptions and out-dated thinking,” with “[different] preconceptions and out-dated thinking.”

Not a bad thing but let’s be honest that we are contending for different preconceptions and assumptions as opposed to having none at all.

Has the potential to make us less resistant when some (then) younger programming generation wants to overturn “…preconceptions and out-dated thinking.”

If you haven’t kept up with type theory, you should spend some time with Paul’s post. Maybe suggest a new word or two.

MongoDB Index Shootout: Covered Indexes vs. Clustered Fractal Tree Indexes

Filed under: Clustering,Fractal Trees,Fractals,MongoDB — Patrick Durusau @ 1:05 pm

MongoDB Index Shootout: Covered Indexes vs. Clustered Fractal Tree Indexes by Tim Callaghan.

From the post:

In my two previous blogs I wrote about our implementation of Fractal Tree Indexes on MongoDB, showing a 10x insertion performance increase and a 268x query performance increase. MongoDB’s covered indexes can provide some performance benefits over a regular MongoDB index, as they reduce the amount of IO required to satisfy certain queries. In essence, when all of the fields you are requesting are present in the index key, then MongoDB does not have to go back to the main storage heap to retrieve anything. My benchmark results are further down in this write-up, but first I’d like to compare MongoDB’s Covered Indexes with Tokutek’s Clustered Fractal Tree Indexes.

MongoDB Covered Indexes Tokutek Clustered Fractal Tree Indexes
Query Efficiency Improved when all requested fields are part of index key Always improved, all non-keyed fields are stored in the index
Index Size Data is not compressed Generally 10x to 20x compression, user selects zlib, quicklz, or lzma. Note that non-clustered indexes are compressed as well.
Planning/Maintenance Index “covers” a fixed set of fields, adding a new field to an existing covered index requires a drop and recreate of the index. None, all fields in the document are always available in the index.

When putting my ideas together for the above table it struck me that covered indexes are really about a well defined schema, yet NoSQL is often thought of as “schema-less”. If you have a very large MongoDB collection and add a new field that you want covered by an existing index, the drop and recreate process will take a long time. On the other hand, a clustered Fractal Tree Index will automatically include this new field so there is no need to drop/recreate unless you need the field to be part of a .find() operation itself.

If you have some time to experiment this weekend, more MongoDB benchmarks/improvements to consider.

« Newer PostsOlder Posts »

Powered by WordPress