Another Word For It Patrick Durusau on Topic Maps and Semantic Diversity

April 8, 2012

50 million messages per second – on a single machine

Filed under: Akka,Marketing — Patrick Durusau @ 4:19 pm

50 million messages per second – on a single machine

From the post:

50 million messages per second on a single machine is mind blowing!

We have measured this for a micro benchmark of Akka 2.0.

As promised in Scalability of Fork Join Pool I will here describe one of the tuning settings that can be used to achieve even higher throughput than the amazing numbers presented previously. Using the same benchmark as in Scalability of Fork Join Pool and only changing the configuration we go from 20 to 50 million messages per second.

The micro benchmark use pairs of actors sending messages to each other, classical ping-pong. All sharing the same fork join dispatcher.

Fairly sure the web scale folks will just sniff and move on. It’s not like every Facebook user sending individual messages to all of their friends and their friend’s friends, all at the same time.

On the other hand, 50 million messages per second per machine, on enough machines, and you are talking about a real pile of message. 😉

Are we approaching the point of data being responsible for processing itself and reporting the results? Or at least reporting itself to the nearest processor with the appropriate inputs? Perhaps by broadcasting a message itself?

Closer to home, could a topic map infrastructure be built using message passing that reports a TMDM based data model? For use by query or constraint languages? That is it presents a TMDM API as it were, although behind the scenes the reported API is the result of message passing and processing.

That would make the data model or API if you prefer, a matter of what message passing had been implemented.

More malleable and flexible than a relational database scheme or Cyc based ontology. An enlightened data structure, for a new age.

April 7, 2012

tl;dr

Filed under: Writing — Patrick Durusau @ 7:43 pm

tl;dr

John D. Cook writes:

The slang “tl;dr” stands for “too long; didn’t read.” The context is often either a bad joke or a shallow understanding.

What bothers me most about tl;dr is the mindset it implies, scanning everything but reading nothing. I find myself slipping into that mode sometimes. Skimming is a vital skill, but it can become so habitual that it crowds out reflective reading.

I despaired when I read in the comments that someone used this as their entire review of an ebook version of “Moby Dick.” I have read it more than once and didn’t really notice the length, other than to be disappointed with I reached the end.

On the other hand, I have read short conference proposals that required me to force myself to the end of a three page abstract. Being uncertain at the end if the authors actually had a point or were trying to conceal some point.

Reflexive reading isn’t encouraged by some user documentation, which is written carelessly, inconsistently and apparently for the purpose of claiming it exists.

To avoid seeing the use of “tl;dr” on your work, convey some of your excitement about it by caring enough to write well. Readers will recognize your writing as a cut above the average and may consider that as a good sign about your software.

Rediscovering the World: Gridded Cartograms of Human and Physical Space

Filed under: Geographic Data,Mapping,Maps — Patrick Durusau @ 7:43 pm

Rediscovering the World: Gridded Cartograms of Human and Physical Space by Benjamin Hennig.

Abstract:

‘We need new maps’ is the central claim made in this thesis. In a world increasingly influenced by human action and interaction, we still rely heavily on mapping techniques that were invented to discover unknown places and explore our physical environment. Although the traditional concept of a map is currently being revived in digital environments, the underlying mapping approaches are not capable of making the complexity of human-environment relationships fully comprehensible.

Starting from how people can be put on the map in new ways, this thesis outlines the development of a novel technique that stretches a map according to quantitative data, such as population. The new maps are called gridded cartograms as the method is based on a grid onto which a density-equalising cartogram technique is applied. The underlying grid ensures the preservation of an accurate geographic reference to the real world. It allows the gridded cartograms to be used as basemaps onto which other information can be mapped. This applies to any geographic information from the human and physical environment. As demonstrated through the examples presented in this thesis, the new maps are not limited to showing population as a defining element for the transformation, but can show any quantitative geospatial data, such as wealth, rainfall, or even the environmental conditions of the oceans. The new maps also work at various scales, from a global perspective down to the scale of urban environments.

The gridded cartogram technique is proposed as a new global and local map projection that is a viable and versatile alternative to other conventional map projections. The maps based on this technique open up a wide range of potential new applications to rediscover the diverse geographies of the world. They have the potential to allow us to gain new perspectives through detailed cartographic depictions.

I found the reference to this dissertation in Fast Thinking and Slow Thinking Visualisation and thought it merited a high profile.

If you are interested in mapping, the history of mapping, or proposals for new ways to think about mapping projections, you will really appreciate this work.

Fast Thinking and Slow Thinking Visualisation

Filed under: Graphics,Maps,Visualization — Patrick Durusau @ 7:43 pm

Fast Thinking and Slow Thinking Visualisation

James Cheshire writes:

Last week I attended the Association of American Geographers Annual Conference and heard a talk by Robert Groves, Director of the US Census Bureau. Aside the impressiveness of the bureau’s work I was struck by how Groves conceived of visualisations as requiring either fast thinking or slow thinking. Fast thinking data visualisations offer a clear message without the need for the viewer to spend more than a few seconds exploring them. These tend to be much simpler in appearance, such as my map of the distance that London Underground trains travel during rush hour.

Betraying my reader-response background, I would argue that fast/slow nature of maps may well be found in the reader.

Particularly if the reader is also a customer paying for a visualisation of data or a visual interface for a topic map.

It makes little difference whether I find the interface/visualisation fast/slow, intuitive or not. It makes a great deal of difference how the customer finds it.

A quick example: The moving squares with lines that re-orient themselves. Would not even be my last choice for an interface. And I have used very large tomes that have cross-references from page to page that are the equivalent of those moving square displays.

The advantage I see in the manual equivalent is that I can refer back to the prior visualisation. True, I can try to retrace my steps on the moving graphic but that is unlikely.

An improvement to the moving boxes I don’t like? Make each change a snapshot that I can recall, perhaps displayed as a smallish line of snapshots.

Some of those snapshots may be fast or slow, when I display them to you. Hard to say until you see them.

Explore Geographic Coverage in Mapping Wikipedia

Filed under: Mapping,Maps,Ontopia,Wikipedia — Patrick Durusau @ 7:42 pm

Explore Geographic Coverage in Mapping Wikipedia

From the post:

TraceMedia, in collaboration with the Oxford Internet Institute, maps language use across Wikipedia in an interactive, fittingly named Mapping Wikipedia.

Simply select a language, a region, and the metric that you want to map, such as word count, number of authors, or the languages themselves, and you’ve got a view into “local knowledge production and representation” on the encyclopedia. Each dot represents an article with a link to the Wikipedia article. For the number of dots on the map, a maximum of 800,000, it works surprisingly without a hitch, other than the time it initially takes to load articles.

You need to follow the link to: Who represents the Arab world online? Mapping and measuring local knowledge production and representation in the Middle East and North Africa. The researchers are concerned with fairness and balance of coverage of the Arab world.

Rather than focusing on Wikipedia, an omnipresent resource on the WWW, I would rather have a mapping of who originates the news feeds more generally? Rather than focusing on who is absent. Moreover, I would ask why the Arab OPEC members have not been more effective at restoring balance in the news media?

April 6, 2012

“Give me your tired, your poor, your huddled identifiers yearning to be used.”

Filed under: Identifiers,RDF,Semantic Web — Patrick Durusau @ 6:52 pm

I was reminded of the title quote when I read Richard Wallis’s: A Fundamental Linked Data Debate.

Contrary to Richard’s imaginings, the vast majority of people on and off the Web are not waiting for the debates on the W3C’s Technical Architecture (TAG) or Linked Open Data (public-lod) mailing lists to be resolved.

Why?

They had identifiers for subjects long before the WWW, Semantic Web, Linked Data or whatever and will have identifiers for subjects long after those efforts and their successors are long forgotten.

Some of those identifiers are still in use today and will survive well into the future. Others are historical curiosities.

Moreover, when it was necessary to distinguish between identifiers and the things identified, that need was met.

Entire the WWW and its poster child, Tim Berners-Lee.

It was Tim Berners-Lee who created the problem Richard frames as: “the difference between a thing and a description of that thing.”

Amazing how much fog of discussion there has been to cover up that amateurish mistake.

The problem isn’t one of conflicting world views (a la Jeni Tennison) but rather how given a bare URI, how to interpret it? Given the bad choices made in the Garden of the Web as it were.

That we simply abandon bare URIs as a solution has never darkened their counsel. They would rather impose the 303/TBL burden on everyone rather than admit to fundamental error.

I have a better solution.

The rest of us should carry on with the identifiers that we want to use, whether they be URIs or not. Whether they are prior identifiers or new ones. And we should put forth statements/standards/documents to establish how in our contexts, those identifiers should be used.

If IBM, Oracle, Microsoft and a few other adventurers decide that IT can benefit from some standard terminology, I am sure they can influence others to use it. Whether composed of URIs or not. And the same can be said for many other domains, most of who will do far better than the W3C at fashioning identifiers for themselves.

Take heart TAG and LOD advocates.

As the poem says: “Give me your tired, your poor, your huddled identifiers yearning to be used.”

Someday your identifiers will be preserved as well.

MongoDB Architecture

Filed under: MongoDB,NoSQL — Patrick Durusau @ 6:51 pm

MongoDB Architecture by Ricky Ho.

From the post:

NOSQL has become a very heated topic for large web-scale deployment where scalability and semi-structured data driven the DB requirement towards NOSQL. There has been many NOSQL products evolving in over last couple years. In my past blogs, I have been covering the underlying distributed system theory of NOSQL, as well as some specific products such as CouchDB and Cassandra/HBase.

Last Friday I was very lucky to meet with Jared Rosoff from 10gen in a technical conference and have a discussion about the technical architecture of MongoDb. I found the information is very useful and want to share with more people.

One thing I am very impressed by MongoDb is that it is extremely easy to use and the underlying architecture is also very easy to understand.

Very nice walk through the architecture of MongoDB! Certainly a model for posts exploring other NoSQL solutions.

Amazon DynamoDB Libraries, Mappers, and Mock Implementations Galore!

Filed under: Amazon DynamoDB,Amazon Web Services AWS — Patrick Durusau @ 6:50 pm

Amazon DynamoDB Libraries, Mappers, and Mock Implementations Galore!

From the post:

Today’s guest blogger is Dave Lang, Product Manager of the DynamoDB team, who has a great list of tools and SDKs that will allow you to use DynamoDB from just about any language or environment.

While you are learning AWS, you may as well take a look at the DynamoDB.

Comments on any of these resources? I just looked at them briefly but they seemed quite, err, uneven.

I understand wanting to thank everyone who made an effort but on the other hand, I think AWS customers would be well served by a top coder’s type list of products. X% of the top 100 AWS projects use Y. That sort of thing.

Mapped: British, Spanish and Dutch Shipping 1750-1800 (Stable Identifiers)

Filed under: Dataset,Graphics,R,Visualization — Patrick Durusau @ 6:49 pm

Mapped: British, Spanish and Dutch Shipping 1750-1800 by James Cheshire.

From the post:

I recently stumbled upon a fascinating dataset which contains digitised information from the log books of ships (mostly from Britain, France, Spain and The Netherlands) sailing between 1750 and 1850. The creation of this dataset was completed as part of the Climatological Database for the World’s Oceans 1750-1850 (CLIWOC) project. The routes are plotted from the lat/long positions derived from the ships’ logs. I have played around with the original data a little to clean it up (I removed routes where there was a gap of over 1000km between known points, and only mapped to the year 1800). As you can see the British (above) and Spanish and Dutch (below) had very different trading priorities over this period. What fascinates me most about these maps is the thousands (if not millions) of man hours required to create them. Today we churn out digital spatial information all the time without thinking, but for each set of coordinates contained in these maps a ship and her crew had to sail there and someone had to work out a location without GPS or reliable charts.

Truly awesome display of data! You will have to see the maps to appreciate it.

Note the space between creation and use of the data. Over two hundred (200) years.

“Stable” URIs are supposed to be what? Twelve (12) to fifteen (15) years?

What older identifiers can you think of? (Hint: Ask a librarian.)

Annotator (and AnnotateIt)

Filed under: AnnotateIt,Annotator,Topic Map Software — Patrick Durusau @ 6:49 pm

Annotator

From the webpage:

The Annotator is an open-source JavaScript library and tool that can be added to any webpage to make it annotatable.

Annotations can have comments, tags, users and more. Morever, the Annotator is designed for easy extensibility so its a cinch to add a new feature or behaviour.

AnnotateIt is a bookmarklet that claims to allow annotation of arbitrary webpages.

Not what I think anyone was expecting when XLink/XPointer were young but perhaps sufficient unto the day.

I am going to look rather hard at this and it may appear as part of this blog in the near future.

What other features do you think would make this a better topic mapping tool?

Is Machine Learning v Domain expertise the wrong question?

Filed under: Domain Expertise,Machine Learning — Patrick Durusau @ 6:48 pm

Is Machine Learning v Domain expertise the wrong question?

James Taylor writes:

KDNuggets had an interesting poll this week in which readers expressed themselves as Skeptical of Machine Learning replacing Domain Expertise. This struck me not because I disagree but because I think it is in some ways the wrong question:

  • Any given decision is made based on a combination of information, know-how and pre-cursor decisions.
  • The know-how can be based on policy, regulation, expertise, best practices or analytic insight (such as machine learning).
  • Some decisions are heavily influenced by policy and regulation (deciding if a claim is complete and valid for instance) while others are more heavily influenced by the kind of machine learning insight common in analytics (deciding if the claim is fraudulent might be largely driven by a Neural Network that determines how “normal” the claim seems to be).
  • Some decisions are driven primarily by the results of pre-cursor or dependent decisions.
  • All require access to some set of information.

I think the stronger point, the one that James closes with, is decision management needs machine learning and domain expertise, together.

And we find our choices of approaches justified by the results, “as we see them.” What more could you ask for?

URN:LEX: New Version 06 Available

Filed under: Identifiers,Law,Law - Sources,Legal Informatics — Patrick Durusau @ 6:47 pm

URN:LEX: New Version 06 Available

From the purpose of the namespace “lex:”

The purpose of the “lex” namespace is to assign an unequivocal identifier, in standard format, to documents that are sources of law. To the extent of this namespace, “sources of law” include any legal document within the domain of legislation, case law and administrative acts or regulations; moreover potential “sources of law” (acts under the process of law formation, as bills) are included as well. Therefore “legal doctrine” is explicitly not covered.

The identifier is conceived so that its construction depends only on the characteristics of the document itself and is, therefore, independent from the document’s on-line availability, its physical location, and access mode.

This identifier will be used as a way to represent the references (and more generally, any type of relation) among the various sources of law. In an on-line environment with resources distributed among different Web publishers, uniform resource names allow simplified global interconnection of legal documents by means of automated hypertext linking.

If creating names just for law “sources” sounds like low-lying fruit to you, take some time to become familiar with the latest draft.

Count a billion distinct objects w/ 1.5KB of Memory (Coarsening Graph Traversal)

Filed under: BigData,Graph Traversal,HyperLogLog,Probablistic Counting — Patrick Durusau @ 6:46 pm

Big Data Counting: How to count a billion distinct objects using only 1.5KB of Memory

From the post:

This is a guest post by Matt Abrams (@abramsm), from Clearspring, discussing how they are able to accurately estimate the cardinality of sets with billions of distinct elements using surprisingly small data structures. Their servers receive well over 100 billion events per month.

At Clearspring we like to count things. Counting the number of distinct elements (the cardinality) of a set is challenge when the cardinality of the set is large.

Cardinality estimation algorithms trade space for accuracy. To illustrate this point we counted the number of distinct words in all of Shakespeare’s works using three different counting techniques. Note that our input dataset has extra data in it so the cardinality is higher than the standard reference answer to this question. The three techniques we used were Java HashSet, Linear Probabilistic Counter, and a Hyper LogLog Counter. Here are the results:

Counter

Bytes Used

Count

Error

HashSet

10447016

67801

0%

Linear

3384

67080

1%

HyperLogLog

512

70002

3%


The table shows that we can count the words with a 3% error rate using only 512 bytes of space. Compare that to a perfect count using a HashMap that requires nearly 10 megabytes of space and you can easily see why cardinality estimators are useful. In applications where accuracy is not paramount, which is true for most web scale and network counting scenarios, using a probabilistic counter can result in tremendous space savings.

The post goes onto describe merging of counters from distributed machines and choosing an acceptable error rate for probabilistic counting.

Question: Can we make graph traversal resemble probabilistic counting?

I will have to work on a graphic but see if this word picture works for the moment.

Assume we have a 3-D graph and the top layer of nodes is composed of basketballs, the basketballs are sitting on a layer of baseballs, and the baseballs are sitting on top of marbles. Each layer represents the nodes and edges below it, except that the representation is coarser at the baseball level and coarser still at the level of basketballs.

Traversal at the “level” of basketballs may be sufficient until we reach a point of interest and then we traverse into greater detail levels of the graph.

Another illustration.

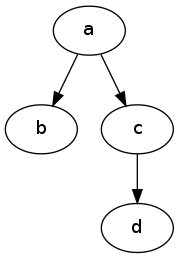
You draw and traverse from node a to node d the following graph:

Graph Traversal Illustration

Easy enough.

Now, same traversal but choose a molecule located in a to traverse to d and travel along edges between molecules.

Or, same traversal but choose an atom located in a to traverse to d and travel along edges between atoms.

In some sense the “same” path but substantially higher traversal cost at the level of greater detail.

Has someone suggested coarsening graph traversal (or having multiple levels of traversal)? Sure it has happened. Would appreciate a pointer.


The authors cite: Hyperloglog: The analysis of a near-optimal cardinality estimation algorithm (2007) by Philippe Flajolet , Éric Fusy , Olivier Gandouet, et al.

And, stream-lib, a project with many useful implementations of the strategies in the post.

Cassandra Europe 2012 (Slides)

Filed under: Cassandra,Conferences,NoSQL — Patrick Durusau @ 6:45 pm

Cassandra Europe 2012 (Slides)

Slides are up from Cassandra Europe, 28 March 2012.

From the program:

  • Andrew Byde – Acunu Analytics: Simple, Powerful, Real-time
  • Gary Dusbabek – Cassandra at Rackspace: Cloud Monitoring
  • Eric Evans – CQL: Then, Now, and When
  • Nicolas Favre-Felix – Cassandra Storage Internals
  • Dave Gardner – Introduction to NoSQL and Cassandra
  • Jeremy Hanna – Powering Social Business Intelligence: Cassandra and Hadoop at the Dachis Group
  • Sylvain Lebresne – On Cassandra Development: Past, Present and Future
  • Richard Low – Data Modelling Workshop
  • Richard Lowe – Cassandra at Arkivum
  • Sam Overton – Highly Available: The Cassandra Distribution Model
  • Noa Resare – Cassandra at Spotify
  • Denis Sheahan – Netflix’s Cassandra Architecture and Open Source Efforts
  • Tom Wilkie – Next Generation Cassandra

Ontopia

Filed under: Ontopia,Topic Map Software — Patrick Durusau @ 6:44 pm

Ontopia

Tutorial from TMRA 2010 by Lars Marius Garshol and Geir Ove Grønmo on the Ontopia software suite.

200+ slides so it is rather complete.

April 5, 2012

Pegasus

Filed under: Hadoop,Pegasus,Spectral Graph Theory — Patrick Durusau @ 3:38 pm

Pegasus

I mentioned Pegasus on September 28th of 2010. It was at version 2.0 at that time.

It is at version 2.0 today.

With all the development, including in graph projects, over the last eighteen months, I expect to be reading about new capabilities and features.

There have been new publications, Spectral Analysis for Billion-Scale Graphs: Discoveries and Implementation, but it isn’t clear to what degree those have been incorporated into Pegasus.

Choosing a Java Version on Ubuntu

Filed under: Java — Patrick Durusau @ 3:38 pm

Choosing a Java Version on Ubuntu

Apologies but I had to write this down where I am likely to find it in the future.

I run a fair number of Java based apps that are, shall we say, sensitive as to the edition/version of Java that is being invoked.

Some updates take it upon themselves to “correct” my settings.

I happened upon this and it reminded me of that issue.

Thought you might find it helpful at some point.

Beautiful visualisation tool transforms maps into works of art

Filed under: Mapping,Maps — Patrick Durusau @ 3:38 pm

Beautiful visualisation tool transforms maps into works of art: Introducing Stamen maps, cartography with aesthetics at its heart

From the post:

Stamen maps, the second stage of the City Tracking project funded by the Knight News Challenge has just been released for public use.

This installment consists of three beautifully intricate mapping styles, which use OpenStreetMap data to display any area of the world* in a new and highly stylised layout.

Take a look at each of the designs below. You can click and drag the maps to view other locations.

More tools for better looking maps!

Google in the World of Academic Research (Lead by Example?)

Filed under: Research Methods,Search Behavior,Searching — Patrick Durusau @ 3:37 pm

Google in the World of Academic Research by Whitney Grace.

From the post:

Librarians, teachers, and college professors all press their students not to use Google to research their projects, papers, and homework, but it is a dying battle. All students have to do is type in a few key terms and millions of results are displayed. The average student or person, for that matter, is not going to scour through every single result. If they do not find what they need, they simply rethink their initial key words and hit the search button again.

The Hindu recently wrote about, “Of Google and Scholarly Search,” the troubles researchers face when they only use Google and makes several suggestions for alternate search engines and databases.

The perennial complaint (academics used to debate the perennial philosophy, now the perennial complaint).

Is Google responsible for superficial searching and consequently superficial results?

Or do superficial Google results reflect our failure to train students in “doing” research?

What research models do students have to follow? In terms of research behavior?

In my next course, I will do a research problem by example. Good as well as bad results. What worked and what didn’t. And yes, Google will be in the mix of methods.

Why not? With four and five work queries and domain knowledge, I get pretty good results from Google. You?

Using Hilbert curves and Polyhedrons for Geo-Indexing

Filed under: Geo-Indexing,Hilbert Curve,Polyhedrons — Patrick Durusau @ 3:37 pm

Using Hilbert curves and Polyhedrons for Geo-Indexing

From the AvocadoDB blog:

Cambridge mathematician Richard R. Parker presents a novel algorithm he has developed using a Hilbert curve and Polyhedrons to efficiently implement geo-indexing.

Basic premise is that points that are “near” on the line are also “near” on the Earth’s surface.

Interesting rhetoric but I think the “near” on the Earth’s surface is unnecessary.

More important to observe that a Hilbert curve when “straightened” and indexed, each point cuts across multiple dimensions of “nearness.”

Enables the isolation of “near” points in another representation, say global coordinates, quickly.

Points to consider/research:

  • Basis for indexing/sharding a graph database? An particular n-dimensional Hilbert curve is used for indexing/sharding. Not all queries created equal.
  • How do characteristics of the distances that compose the curve impact particular use cases?

Data Locality in Graph Databases through N-Body Simulation

Filed under: Data Locality,Graph Databases,Graphs,N-Body Simulation — Patrick Durusau @ 3:37 pm

Data Locality in Graph Databases through N-Body Simulation by Dominic Pacher, Robert Binna, and GĂŒnther Specht.

Abstract:

Data locality poses a major performance requirement in graph databases, since it forms a basis for efficient caching and distribution. This vision paper presents a new approach to satisfy this requirement through n-body simulation. We describe our solution in detail and provide a theoretically complexity estimation of our method. To prove our concept, we conducted an evaluation using the DBpedia dataset data. The results are promising and show that n-body simulation is capable to improve data locality in graph databases significantly.

My first reaction was why clustering of nodes wasn’t compared to n-body simulation? That seems like an equally “natural” method to achieve data locality.

My second reaction was that the citation of “…Simulations of the formation, evolution and clustering of galaxies and quasars. nature, 435(7042):629–636, jun 2005. (citation 16 in the article) was reaching in terms of support for scaling. That type of simulation involves a number of simplifying assumptions that aren’t likely to be true for most graphs.

Imaginative work but it needs a little less imagination and a bit rigor in terms of its argument/analysis.

SpiderStore: A Native Main Memory Approach for Graph Storage

Filed under: Graphs,RDF,SpiderStore — Patrick Durusau @ 3:37 pm

SpiderStore: A Native Main Memory Approach for Graph Storage by Robert Binna, Wolfgang Gassler, Eva Zangerle, Dominic Pacher, and GĂŒnther Specht.

Abstract:

The ever increasing amount of linked open data results in a demand for high performance graph databases. In this paper we therefore introduce a memory layout which is tailored to the storage of large RDF data sets in main memory. We present the memory layout SpiderStore. This layout features a node centric design which is in contrast to the prevailing systems using triple focused approaches. The benefi t of this design is a native mapping between the nodes of a graph onto memory locations connected to each other. Based on this native mapping an addressing schema which facilitates relative addressing together with a snapshot mechanism is presented. Finally a performance evaluation, which demonstrates the capabilities, of the SpiderStore memory layout is performed using an RDF-data set consisting of about 190 mio triples.

I saw this in a tweet by Marko A. Rodriguez.

I am sure RenĂ© Pickhardt will be glad to see the focus on edges in this paper. 😉

It is hard to say which experiments or lines of inquiry will lead to substantial breakthroughs, but focusing on smallish data sets is unlikey to push the envelope very hard. Even if smallish experiments are sufficient for Linked Data scenarios.

The authors project that their technique might work up for up to a billion triples. Yes, well, but by 2024, one science installation will be producing one exabyte of data per day. And that is just one source of data.

The science community isn’t going to wait for the W3C to catch up, nor should they.

Fixing Healthcare with Big Data

Filed under: BigData,Health care — Patrick Durusau @ 3:36 pm

I was reminded of “Unrealistic Expectations,” no, sorry, that was “Great Expectations” (Dickens) when I read: Fixing Healthcare with Big Data

Robert Gelber writes:

Yesterday, Roger Foster, the Senior Director for DRC’s technologies group, discussed the immense expenses of the U.S. healthcare system. The 2.6 trillion dollar market is ripe for new efficiencies reducing overall costs and improving public health. He believes these enhancements can be achieved with the help of big data.

Foster set forth a six-part approach aimed at reducing costs and improving patient outcomes using big data.

It would have been more correct to say Foster is “selling big data as the basis for these enhancements.”

Consider his six part plan:

Unwarranted use

Many healthcare providers focus on a fee-for-service model, which promotes recurring medical visits at higher rates. Instead, big data analytics could help generate a model that implements a performance-based payment method.

Did you notice the use of “could” in the first approach? The current service model developed in the absence of “big data.” But Foster would have us create big data analytics of healthcare in hopes a new model will suddenly appear. Not real likely.

Fraud waste & abuse

Criminal organizations defraud Centers for Medicare and Medicaid Services (CMS) by charging for services never rendered. Using big data analytics, these individuals could be tracked much faster through the employment of outlier algorithms.

Here I think “criminal organizations” is a synonym for dishonest doctors and hospitals. Hardly takes big data analytics and outlier algorithms to know one doctor cannot read several hundred x-rays day after day.

Administrative costs

The departments of Veterans Affairs (VA), Military Heath System (MHS) and others suffer high costs due to administrative inefficiencies in billing and medical records management. By updating billing systems and employing big data records management, facilities could spend less time working on bookkeeping and more time providing accurate information to doctors and physicians assistants.

Really? Perhaps Foster could consult the VA Data Repository and get back to us on that.

Provider inefficiencies

A wide implementation of clinical decision systems could reduce errors and increase congruency among various healthcare providers. Such systems could also predict risks based on population data.

Does that sound like more, not less, IT overhead to you?

Lack of coordinated care

The process of sharing medical data across institutions has become cumbersome resulting in redundant information and added costs. Improved sharing of information would open systems up to predictive modeling and also allow patients to view their history. This would allow the patient to have greater control in their treatment.

How much “added costs” versus the cost of predictive modeling? Sounds like we are going to create “big data” and then manage it to save money. That went by a little fast for me.

Preventable conditions

Through the use of big data, healthcare providers can track the change in behavior of patients after treatment. Using this data, medical professionals can better educate patients of the resulting effects from their behavior.

Is it a comfort that we are viewed as ignorant rather than making poor choices? What if despite tracking and education we don’t change our behavior? Sounds like someone is getting ready to insist that we change.

Foster is confident that big data will answer pressing issues in the healthcare as long as solutions are deployed properly.

That last sentence sums up my problem with Foster’s position. “Big data” is the answer, so long as you understand the problem correctly.

“Big data” has a lot of promise, but we need understand the problems at hand before choosing solutions.

Let’s avoid “Unrealistic Expectations.”
Dates, date boosting, and NOW

Filed under: Query Language,Searching,Solr — Patrick Durusau @ 3:36 pm

Dates, date boosting, and NOW by Erick Erickson

From the post:

More NOW evil

Prompted by a subtle issue a client raised, I was thinking about date boosting. According to the Wiki, a good way to bost by date is by something like the following:

http://localhost:8983/solr/select?q={!boost
b=recip(ms(NOW,manufacturedate_dt),3.16e-11,1,1)}ipod

(see: date boosting link). And this works well, no question.

However, there’s a subtle issue when paging. NOW evaluates to the current time, and every subsequent request will have a different value for NOW. This blog post about the effects of this on filter queries provides some useful background.

If you like really subtle Solr issues then you will love this post. It doesn’t really have a happy ending per se but you will pick up some experience at deep analysis.

Erick’s concluding advice that users rarely go to the second page of search results, making the problem here an edge case, makes me uneasy.

I am sure Erick is right about the numbers, but I remain uneasy. I would have to monitor users for occurrences of the “edge case” before I would be confident enough to simply ignore it.

All Aboard for Quasi-Productive Stemming

Filed under: RDF,Semantic Web — Patrick Durusau @ 3:35 pm

All Aboard for Quasi-Productive Stemming by Bob Carpenter.

From the post:

One of the words Becky and I are having annotated for word sense (collecting 25 non-spam Mechanical Turk responses per word) is the nominal (noun) use of “board”.

One of the examples was drawn from a text with a typo where “aboard” was broken into two words, “a board”. I looked at the example, and being a huge fan of nautical fiction, said “board is very productive — we should have the nautical sense”. Then I thought a bit longer and had to admit I didn’t know what “board” meant all by itself. I did know a whole bunch of terms that involved “board” as a stem:

Highly entertaining post by Bob on the meanings of “board.”

I have a question: Which sense of board gets the URL: http://w3.org/people/TBL/OneWorldMeaning/board?

Just curious.

April 4, 2012

Modelling graphs with processes in Erlang

Filed under: Erlang,Graphs — Patrick Durusau @ 3:42 pm

Modelling graphs with processes in Erlang by Nick Gibson.

From the post:

One of the advantages of Erlang’s concurrency model is that creating and running new processes is much cheaper. This opens up opportunities to write algorithms in new ways. In this article, I’ll show you how you can implement a graph searching algorithm by modeling the domain using process interaction.

I’ll assume you’re more or less comfortable with Erlang, if you’re not you might want to go back and read through Builder AU’s previous guides on the subject.

First we need to write a function for the nodes in the graph. When we spawn a process for each node it will need to run a function that sends and receives messages. Each node needs two things, its own name, and the links it has to other nodes. To store the links, we’ll use a dictionary which maps name to the node’s Pid. [I checked the links and they still work. Amazing for a five year old post.]

In the graph reading club discussion today, it was suggested that we need to look at data structures more closely. There are a number of typical and not so typical data structures for graphs and/or graph databases.

I am curious if it would be better to develop the requirements for data structures, separate and apart from thinking of them as graph or graph database storage?

For example, we don’t want information about “edges,” but rather data items composed of two (or more) addresses (of other data items) per data item. Or an ordered list of such data items. And the addresses of the data items in question have specific characteristics.

Trying to avoid being influenced by the implied necessities of “edges,” at least until they are formally specified. At that point, we can evaluate data structures that meet all the previous requirements, plus any new ones.

Astronomers Look to Exascale Computing to Uncover Mysteries of the Universe

Filed under: Astroinformatics,Marketing — Patrick Durusau @ 3:34 pm

Astronomers Look to Exascale Computing to Uncover Mysteries of the Universe by Robert Gelber.

From the post:

Plans are currently underway for development of the world’s most powerful radio telescope. The Square Kilometer Array (SKA) will consist of roughly 3,000 antennae located in Southern Africa or Australia; its final location may be decided later this month. The heart of this system, however, will include one of the world’s fastest supercomputers.

The array is quite demanding of both data storage and processing power. It is expected to generate an exabyte of data per day and require a multi-exaflops supercomputer to process it. Rebecca Boyle of Popsci wrote an article about the telescope’s computing demands, estimating that such a machine would have to deliver between two to thirty exaflops.

The array is not due to go online until 2024 but that really isn’t that far away.

Strides in engineering, processing, programming, and other fields, all of which rely upon information retrieval, are going to be necessary. Will your semantic application advance or retard those efforts?

Linked Data Basic Profile 1.0

Filed under: Linked Data,LOD,RDF,Semantic Web — Patrick Durusau @ 3:33 pm

Linked Data Basic Profile 1.0

A group of W3C members, IBM, DERI, EMC, Oracle, Red Hat, Tasktop and SemanticWeb.com have made a submission to the W3C with the title: Linked Data Basic Profile 1.0.

The submission consists of:

Linked Data Basic Profile 1.0

Linked Data Basic Profile Use Cases and Requirements

Linked Data Basic Profile RDF Schema

Interesting proposal.

Doesn’t try to do everything. The old 303/TBL is relegated to pagination. Probably a good use for it.

Comments?

Adobe Releases Malware Classifier Tool

Filed under: Classification,Classifier,Malware — Patrick Durusau @ 3:33 pm

Adobe Releases Malware Classifier Tool by Dennis Fisher.

From the post:

Adobe has published a free tool that can help administrators and security researchers classify suspicious files as malicious or benign, using specific machine-learning algorithms. The tool is a command-line utility that Adobe officials hope will make binary classification a little easier.

Adobe researcher Karthik Raman developed the new Malware Classifier tool to help with the company’s internal needs and then decided that it might be useful for external users, as well.

” To make life easier, I wrote a Python tool for quick malware triage for our team. I’ve since decided to make this tool, called “Adobe Malware Classifier,” available to other first responders (malware analysts, IT admins and security researchers of any stripe) as an open-source tool, since you might find it equally helpful,” Raman wrote in a blog post.

“Malware Classifier uses machine learning algorithms to classify Win32 binaries – EXEs and DLLs – into three classes: 0 for “clean,” 1 for “malicious,” or “UNKNOWN.” The tool extracts seven key features from a binary, feeds them to one or all of the four classifiers, and presents its classification results.”

Adobe Malware Classifier (Sourceforge)

Old hat that malware scanners have been using machine learning but new that you can now see it from the inside.

Lessons to be learned about machine learning algorithms for malware and other uses with software.

Kudos to Adobe!

OpenStreetMap versus Google maps

Filed under: Mapping,Maps — Patrick Durusau @ 3:32 pm

OpenStreetMap versus Google maps

From the post:

Travelling to Sarajevo showed the Open Knowledge Foundation’s Lucy Chambers the overwhelming reach of crowdsourced open data

Lucy says nice things about both OpenStreetMap and Google maps.

I mention it as encouragement to try crowdsourced data in your semantic solutions where appropriate.

Depending on the subject, we are all parts of “crowds” of one sort or another.

« Newer PostsOlder Posts »

Powered by WordPress