Another Word For It Patrick Durusau on Topic Maps and Semantic Diversity

April 19, 2012

Knoema Launches the World’s First Knowledge Platform Leveraging Data

Filed under: Data,Data Analysis,Data as Service (DaaS),Data Mining,Knoema,Statistics — Patrick Durusau @ 7:13 pm

Knoema Launches the World’s First Knowledge Platform Leveraging Data

From the post:

DEMO Spring 2012 conference — Today at DEMO Spring 2012, Knoema launched publicly the world’s first knowledge platform that leverages data and offers tools to its users to harness the knowledge hidden within the data. Search and exploration of public data, its visualization and analysis have never been easier. With more than 500 datasets on various topics, gallery of interactive, ready to use dashboards and its user friendly analysis and visualization tools, Knoema does for data what YouTube did to videos.

Millions of users interested in data, like analysts, students, researchers and journalists, struggle to satisfy their data needs. At the same time there are many organizations, companies and government agencies around the world collecting and publishing data on various topics. But still getting access to relevant data for analysis or research can take hours with final outcomes in many formats and standards that can take even longer to get it to a shape where it can be used. This is one of the issues that the search engines like Google or Bing face even after indexing the entire Internet due to the nature of statistical data and diversity and complexity of sources.

One-stop shop for data. Knoema, with its state of the art search engine, makes it a matter of minutes if not seconds to find statistical data on almost any topic in easy to ingest formats. Knoema’s search instantly provides highly relevant results with chart previews and actual numbers. Search results can be further explored with Dataset Browser tool. In Dataset Browser tool, users can get full access to the entire public data collection, explore it, visualize data on tables/charts and download it as Excel/CSV files.

Numbers made easier to understand and use. Knoema enables end-to-end experience for data users, allowing creation of highly visual, interactive dashboards with a combination of text, tables, charts and maps. Dashboards built by users can be shared to other people or on social media, exported to Excel or PowerPoint and embedded to blogs or any other web site. All public dashboards made by users are available in dashboard gallery on home page. People can collaborate on data related issues participating in discussions, exchanging data and content.

Excellent!!!

When “other” data becomes available, users will want to integrate it with their data.

But “other” data will have different or incompatible semantics.

So much for attempts to wrestle semantics to the ground (W3C) or build semantic prisons (unnamed vendors).

What semantics are useful to you today? (patrick@durusau.net)
AvocadoDB Query Language

Filed under: AvocadoDB,NoSQL — Patrick Durusau @ 6:52 pm

AvocadoDB Query Language

This just in, resources on the proposed AvocadoDB query language.

There are slides, a presentation, a “visualization” (railroad diagram).

Apparently not set in stone (yet) so take the time to review and make comments.

BTW, blog comments are a good idea but a mailing list might be better?

April 18, 2012

Gas Price Fact Vacuum

Filed under: Marketing,Topic Maps — Patrick Durusau @ 6:12 pm

President Obama claims that speculation in oil markets are responsible for high gas prices. While others see only supply and demand.

Two stories, very different takes on the gas price question. The only fact the stories have in common is that gas prices are high.

In a high school debate setting, we would say the two teams did not “join the issue.” That is they don’t directly address the questions raised by their opponents but trot out their “evidence,” which is ignored in turn by the other side.

The result is a claim rich but fact poor environment that leaves readers to cherry pick claims that support their present opinions.

If you are interested in public policy, for an area like gas prices, topic maps can capture the lack of “joining the issue” by both sides in such a debate.

Might make an interesting visual for use in presidential debates. Where have the candidates have simply missed each others arguments?

Topic maps anyone? (PBS? Patrick Durusau)

If you want a more “practical” application of topic maps and the analysis that underlie them, think about the last set of ads, white papers, webinars you have seen on technology alternatives.

A topic map could help you get past the semantic-content="zero" parts of technology promotions. (Note the use of “could.” Like any technology, the usefulness of topic maps depend on the skill of their author(s) and user(s). Anyone who says differently is lying.)

Windows Azure Marketplace

Filed under: Dataset,Windows Azure Marketplace — Patrick Durusau @ 6:09 pm

Windows Azure Marketplace

The location of the weather data sets for the Download 10,000 Days of Free Weather… post.

I was somewhat disappointed by the small number of data sets and equally overwhelmed when I saw the number of applications at this site.

One that stood out was an EDI to XML translation service, featuring “manual” translations. Yikes!

But the principle was what interested me.

That is the offering of an interface that “translates” data that users can then consume via some other application.

There are any number of government data sets, in a variety of formats, with diverse semantics, that could be useful, if they were only available with a common format and reconciled semantics. (True I would prefer to capture their true diversity but also need to have a product users will buy.)

To make that repeatable for a large number of data sets, the creation the tool that offers the common format and reconciled semantics, I am thinking that a topic map would be quite appropriate.

Of course, need to find data sets that are of commercial interest (unlike campaign contribution datasets, businesses already know which members of government they own and which they don’t).

Thoughts? Suggestions?

The Little MongoDB Book

Filed under: MongoDB,NoSQL — Patrick Durusau @ 6:08 pm

The Little MongoDB Book

Karl Seguin has written a short (thirty-two pages) guide to MongoDB.

It won’t make you a hairy-chested terror at big data conferences but it will get you started with MongoDB.

I would bookmark http://mongly.com/, also by Karl, to consult along with the Little MongoDB book.

Finally, as you learn MongoDB, contribute to these and other resources with examples, tutorials, data sets.

Particularly tutorials on analysis of data sets. It is one thing to know schema X works in general with data sets of type Y. It is quite another to understand why.

DUALIST: Utility for Active Learning with Instances and Semantic Terms

Filed under: Active Learning,Bayesian Models,HCIR,Machine Learning — Patrick Durusau @ 6:08 pm

DUALIST: Utility for Active Learning with Instances and Semantic Terms

From the webpage:

DUALIST is an interactive machine learning system for quickly building classifiers for text processing tasks. It does so by asking “questions” of a human “teacher” in the form of both data instances (e.g., text documents) and features (e.g., words or phrases). It uses active learning and semi-supervised learning to build text-based classifiers at interactive speed.

(video demo omitted)

The goals of this project are threefold:

  1. A practical tool to facilitate annotation/learning in text analysis projects.
  2. A framework to facilitate research in interactive and multi-modal active learning. This includes enabling actual user experiments with the GUI (as opposed to simulated experiments, which are pervasive in the literature but sometimes inconclusive for use in practice) and exploring HCI issues, as well as supporting new dual supervision algorithms which are fast enough to be interactive, accurate enough to be useful, and might make more appropriate modeling assumptions than multinomial naive Bayes (the current underlying model).
  3. A starting point for more sophisticated interactive learning scenarios that combine multiple “beyond supervised learning” strategies. See the proceedings of the recent ICML 2011 workshop on this topic.

This could be quite useful for authoring a topic map across a corpus of materials. With interactive recognition of occurrences of subjects, etc.

Sponsored in part by the folks at DARPA. Unlike Al Gore, they did build the Internet.

Learning Fuzzy β-Certain and β-Possible rules…

Filed under: Classification,Fuzzy Matching,Fuzzy Sets,Rough Sets — Patrick Durusau @ 6:08 pm

Learning Fuzzy β-Certain and β-Possible rules from incomplete quantitative data by rough sets by Ali Soltan Mohammadi, L. Asadzadeh, and D. D. Rezaee.

Abstract:

The rough-set theory proposed by Pawlak, has been widely used in dealing with data classification problems. The original rough-set model is, however, quite sensitive to noisy data. Tzung thus proposed deals with the problem of producing a set of fuzzy certain and fuzzy possible rules from quantitative data with a predefined tolerance degree of uncertainty and misclassification. This model allowed, which combines the variable precision rough-set model and the fuzzy set theory, is thus proposed to solve this problem. This paper thus deals with the problem of producing a set of fuzzy certain and fuzzy possible rules from incomplete quantitative data with a predefined tolerance degree of uncertainty and misclassification. A new method, incomplete quantitative data for rough-set model and the fuzzy set theory, is thus proposed to solve this problem. It first transforms each quantitative value into a fuzzy set of linguistic terms using membership functions and then finding incomplete quantitative data with lower and the fuzzy upper approximations. It second calculates the fuzzy {\beta}-lower and the fuzzy {\beta}-upper approximations. The certain and possible rules are then generated based on these fuzzy approximations. These rules can then be used to classify unknown objects.

In part interesting because of its full use of sample data to illustrate the process being advocated.

Unless smooth sets in data are encountered by some mis-chance, rough sets will remain a mainstay of data mining for the foreseeable future.

Learning Topic Models – Going beyond SVD

Filed under: BigData,Latent Dirichlet Allocation (LDA),Topic Models,Topic Models (LDA) — Patrick Durusau @ 6:07 pm

Learning Topic Models – Going beyond SVD by Sanjeev Arora, Rong Ge, and Ankur Moitra.

Abstract:

Topic Modeling is an approach used for automatic comprehension and classification of data in a variety of settings, and perhaps the canonical application is in uncovering thematic structure in a corpus of documents. A number of foundational works both in machine learning and in theory have suggested a probabilistic model for documents, whereby documents arise as a convex combination of (i.e. distribution on) a small number of topic vectors, each topic vector being a distribution on words (i.e. a vector of word-frequencies). Similar models have since been used in a variety of application areas; the Latent Dirichlet Allocation or LDA model of Blei et al. is especially popular.

Theoretical studies of topic modeling focus on learning the model’s parameters assuming the data is actually generated from it. Existing approaches for the most part rely on Singular Value Decomposition(SVD), and consequently have one of two limitations: these works need to either assume that each document contains only one topic, or else can only recover the span of the topic vectors instead of the topic vectors themselves.

This paper formally justifies Nonnegative Matrix Factorization(NMF) as a main tool in this context, which is an analog of SVD where all vectors are nonnegative. Using this tool we give the first polynomial-time algorithm for learning topic models without the above two limitations. The algorithm uses a fairly mild assumption about the underlying topic matrix called separability, which is usually found to hold in real-life data. A compelling feature of our algorithm is that it generalizes to models that incorporate topic-topic correlations, such as the Correlated Topic Model and the Pachinko Allocation Model.

We hope that this paper will motivate further theoretical results that use NMF as a replacement for SVD – just as NMF has come to replace SVD in many applications.

The proposal hinges on the following assumption:

Separability requires that each topic has some near-perfect indicator word – a word that we call the anchor word for this topic— that appears with reasonable probability in that topic but with negligible probability in all other topics (e.g., “soccer” could be an anchor word for the topic “sports”). We give a formal definition in Section 1.1. This property is particularly natural in the context of topic modeling, where the number of distinct words (dictionary size) is very large compared to the number of topics. In a typical application, it is common to have a dictionary size in the thousands or tens of thousands, but the number of topics is usually somewhere in the range from 50 to 100. Note that separability does not mean that the anchor word always occurs (in fact, a typical document may be very likely to contain no anchor words). Instead, it dictates that when an anchor word does occur, it is a strong indicator that the corresponding topic is in the mixture used to generate the document.

The notion of an “anchor word” (or multiple anchor words per topics as the authors point out in the conclusion) resonates with the idea of identifying a subject. It is at least a clue that an author/editor should take into account.

Bad Names, Renaming, …?

Filed under: Identifiers,Names — Patrick Durusau @ 6:06 pm

David Loshin as a series of posts going at the Data Roundtable:

The Perils of Bad Names

and

The Impact of Data Element Renaming…

In “Bad Names,” David cites this example:

An example of this might be a column named “STREET_ADDRESS,” but that instead of that field holding a street number and name, it contains a set of flags indicating the types of customer correspondences that are to be sent to a home address instead of an email address. From one perspective, our assumption about what was stored in that field were mistaken, but on the other hand, conventional wisdom might have suggested otherwise.

I would agree, that at least looks like a bad name. Moreover, its one that is likely to trip up successors who have to deal with the data set.

David goes on to argue in “Renaming,” that finding and replacing all the uses of this name may lead to worse problems.

Ah, after thinking about it for a bit, I can see he has a point.

How about you?

Explain: New Version

Filed under: Explain.solr.pl,Solr — Patrick Durusau @ 6:05 pm

Explain: New Version

Curious about your Solr results? This is the tool for you.

From the post:

We are proud to inform that we deployed a new version of explain.solr.pl, software for debugging and analyzing Solr queries. This version contains the following changes:

  • bugfixes
  • initial support for dla Solr 4.0
  • support for ruby 1.9

Source code is available on our GitHub.

Using Three.js with Neo4j

Filed under: Neo4j,Three.js — Patrick Durusau @ 6:05 pm

Using Three.js with Neo4j by Max De Marzi.

From the post:

Last week we saw Sigma.js, and as promised here is a graph visualization with Three.js. Three.js is a lightweight 3D library, written by Mr. Doob and a small army of contributors.

The things you can do with Three.js are amazing, and my little demo here doesn’t give it justice, but nonetheless I’ll show you how to build it.

There has been a blizzard of tweets along the lines of “When 2D is not enough…” so I won’t pursue that line.

Different question: Is 3D enough?

That is to ask:

Should nodes have positions along three axes or should nodes have positions along 3+ axes that are displayed only 3 dimensions at a time?

How many serious business/planning/science problems only have data for 3 axes? Or relationships that are only between nodes in 3 axes?

Some nodes may not even exist (no properties to cause display) in some sets of 3 axes.

As could be the case for typed edges between nodes. Node might exist, but not the edge.

Interesting from a number of perspectives, querying, authoring, constraints, etc.

April 17, 2012

Secret Service Babes

Filed under: BigData,Marketing,Topic Maps — Patrick Durusau @ 7:14 pm

The major news organizations are all over the story of the U.S. Secret Service and the prostitutes in Cartagena, Columbia.

But not every TV or radio station can afford to send reporters to Columbia.

And what news could they uncover at this point?

Ask yourself: Why were the secret service agents in Columbia?

Answer: The president was visiting.

Opportunity: Run the list of overnight presidential visits backwards and start interviewing the local prostitutes for their stories. May turn up some “Secret Service babes” of the smaller sort.

This is where a topic map makes an excellent mapping/information sharing tool. Being “secret,” you won’t have photos of Secret Service agents but physical descriptions can be collated/merged.

Composite physical/sexual description as it were.

To be reviewed/recognized by other prostitutes or wives of the Secret Service agents.

Interested in a topic map of Secret Service Sexual Liaisons (SSSL)? (Patrick Durusau)

PS: Is this a “big data” mining opportunity?

Download 10,000 Days of Free Weather Data for Almost Any Location Worldwide

Filed under: Data,Dataset,PowerPivot — Patrick Durusau @ 7:12 pm

Download 10,000 Days of Free Weather Data for Almost Any Location Worldwide

A very cool demonstration of PowerPivot with weather data.

I don’t have PowerPivot (or Office 2010) but will be correcting that in the near future.

Pointers to importing diverse data into PowerPivot?

Accumulo

Filed under: Accumulo,NoSQL — Patrick Durusau @ 7:12 pm

Accumulo

From the webpage:

The Apache Accumulo™ sorted, distributed key/value store is a robust, scalable, high performance data storage and retrieval system. Apache Accumulo is based on Google’s BigTable design and is built on top of Apache Hadoop, Zookeeper, and Thrift. Apache Accumulo features a few novel improvements on the BigTable design in the form of cell-based access control and a server-side programming mechanism that can modify key/value pairs at various points in the data management process. Other notable improvements and feature are outlined here.

We mentioned Accumulo here but missed its graduation from the incubator. Apologies.

Superfastmatch: A text comparison tool

Filed under: Duplicates,News,Text Analytics — Patrick Durusau @ 7:12 pm

Superfastmatch: A text comparison tool by Donovan Hide.

Slides on a Chrome extension that compares news stories for unique content.

Would be interesting to compare 24-hour news channels both to themselves and to others on the basis of duplicate content.

Could even have a 15 minute, highlights of the news and deliver most of the non-duplicate content (well, omitting the commercials as well) for any 24-hour period.

Until then, visit this project and see what you think.

How can we get our map colours right?

Filed under: Graphics,Mapping,Maps,Visualization — Patrick Durusau @ 7:11 pm

How can we get our map colours right? How open journalism helped us get better

Watch the debate as it unfolds over Twitter with argument for and against color schemes, plus examples!

Did the map get better, worse, about the same?

The Guardian writes:

How can you get the colour scales right on maps? It’s something we spend a lot of time thinking about here on the Datablog – and you may notice a huge variety of ones we try out.

This isn’t just design semantics – using the wrong colours can mean your maps are completely inaccessible to people with colour blindness, for instance and actually obscure what you’re trying to do.

It’s distinct to problems expertly faced by the Guardian graphics team – who have a lot of experience of making maps just right.

But on the blog, making a Google Fusion map in a hurry, do we get it right?

What avenues for public contribution do you allow for your topic maps?

HBaseCon 2012: A Glimpse into the Development Track

Filed under: Conferences,HBase,NoSQL — Patrick Durusau @ 7:11 pm

HBaseCon 2012: A Glimpse into the Development Track by Jon Zuanich.

Jon posted a reminder about the development track at HBaseCon 2012:

  • Learning HBase Internals – Lars Hofhansl, Salesforce.com
  • Lessons learned from OpenTSDB – Benoit Sigoure, StumbleUpon
  • HBase Schema Design – Ian Varley, Salesforce.com
  • HBase and HDFS: Past, Present, and Future – Todd Lipcon, Cloudera
  • Lightning Talk | Relaxed Transactions for HBase – Francis Liu, Yahoo!
  • Lightning Talk | Living Data: Applying Adaptable Schemas to HBase – Aaron Kimball, WibiData

Non-developers can check out the rest of the Agenda. 😉

Conference: May 22, 2012 InterContinental San Francisco Hotel.

sixty two-minute r twotorials now available

Filed under: R — Patrick Durusau @ 7:11 pm

sixty two-minute r twotorials now available

See the post or jump directly to the R twotorials.

Optimistically starts with three digit episode identifiers. 😉

I agree with the comment that two minutes is constraining but I suspect that is on purpose.

Say what you have to say, then stop.

Self-Service BI Mapping with Microsoft Research’s Layerscape–Part 1

Filed under: Business Intelligence,Layerscape — Patrick Durusau @ 7:11 pm

Self-Service BI Mapping with Microsoft Research’s Layerscape–Part 1 by Chris Webb.

From the post:

Sometimes you find a tool that is so cool, you can’t believe no-one else has picked up on it before. This is one of those times: a few month or so ago I came across a new tool called Layerscape (http://www.layerscape.org) from Microsoft Research which allows you to overlay data from Excel onto maps in Microsoft WorldWide Telescope (http://www.worldwidetelescope.org). “What is WorldWide Telescope?” I hear you ask – well, it’s basically Microsoft Research’s answer to Google Earth, although it’s not limited to the Earth in that it also contains images of the universe from a wide range of ground and space-based telescopes. It’s a pretty cool toy in its own right, but Layerscape – which seems to be aimed at academics, despite the obvious business uses – turns it into a pretty amazing BI visualisation tool.

Layerscape is very easy to use: it’s an Excel addin, and once you have it and WWT installed all you need to do is select a range of data in Excel to be able to visualise it in WWT. For some cool examples of what it can do, take a look at the videos posted on the Layerscape website like this one (Silverlight required): http://www.layerscape.org/Content/Index/384

Looks like I am going to be putting the latest version of Windows and Office on my Linux box.

Will applications like Layerscape raise the bar for BI products generally? Products for the intelligence community?


Update: Self-Service BI Mapping with Microsoft Research’s Layerscape–Part 2

Chris plots the weather data from the earlier post onto a map. I think it looks pretty good. Am concerned if the 150000 row limit Chris mentions are in Layerscape or in his hardware?

I may have to beef up the RAM in my Ubuntu box for the Windows/Office combination.

Using the Disease ontology (DO) to map the genes involved in a category of disease

Filed under: Bioinformatics,Biomedical — Patrick Durusau @ 7:11 pm

Using the Disease ontology (DO) to map the genes involved in a category of disease by Pierre Lindenbaum.

Of particular interest if you are developing topic maps for bioinformatics.

The medical community has created a number of mapping term resources. In this particular case a mapping from the DO (disease ontology) to OMIM (Online Mendelian Inheritance in Man) and to NCBI Gene (Gene).

Data mining opens the door to predictive neuroscience (Google Hazing Rituals)

Filed under: Data Mining,Neuroinformatics,Predictive Analytics — Patrick Durusau @ 7:10 pm

Data mining opens the door to predictive neuroscience

From the post:

Ecole Polytechnique Fédérale de Lausanne (EPFL) researchers have discovered rules that relate the genes that a neuron switches on and off to the shape of that neuron, its electrical properties, and its location in the brain.

The discovery, using state-of-the-art computational tools, increases the likelihood that it will be possible to predict much of the fundamental structure and function of the brain without having to measure every aspect of it.

That in turn makes modeling the brain in silico — the goal of the proposed Human Brain Project — a more realistic, less Herculean, prospect.

The fulcrum of predictive analytics is finding the “basis” for prediction and within what measurement of error.

Curious how that would work in an employment situation?

Rather than Google’s intellectual hazing rituals, project a thirty-minute questionnaire on Google hires against their evaluations at six-month intervals. Give prospective hires the same questionnaire and then “up” or “down” decisions on hiring. Likely to be as accurate as the current rituals.

April 16, 2012

Working with your Data: Easier and More Fun

Filed under: Data Fusion,Data Integration,Fusion Tables — Patrick Durusau @ 7:15 pm

Working with your Data: Easier and More Fun by Rebecca Shapley.

From the post:

The Fusion Tables team has been a little quiet lately, but that’s just because we’ve been working hard on a whole bunch of new stuff that makes it easier to discover, manage and visualize data.

New features from Fusion Tables include:

  • Faceted search
  • Multiple tabs
  • Line charts
  • Graph visualizations
  • New API that returns JSON
  • and more features on the way!

The ability of tools to ease users into data mining, visualization and exploration continues to increase.

Question: How do you counter mis-application of a tool with a sophisticated looking result?

Clicks in Search

Filed under: Click Graph,Searching — Patrick Durusau @ 7:15 pm

Clicks in Search by Hugh E. Williams.

From the post:

Have you heard of the Pareto principle? The idea that 80% of sales come from 20% of customers, or that the 20% of the richest people control 80% of the world’s wealth.

How about George K. Zipf? The author of the “Human behavior and the principle of least effort” and “The Psycho-Biology of Language” is best-known for “Zipf’s Law“, the observation that the frequency of a word is inversely proportional to the rank of its frequency. Over simplifying a little, the word “the” is about twice as frequent as the word “of”, and then comes “and”, and so on. This also applies to the populations of cities, corporation sizes, and many more natural occurrences.

I’ve spent time understanding and publishing work how Zipf’s work applies in search engines. And the punchline in search is that the Pareto principle and Zipf’s Law are hard at work: the first item in a list gets about twice as many clicks as the second, and so on. There are inverse power law distributions everywhere.

Interesting conclusion: If curves don’t decay rapidly, worry.

How do subject identification curves decay? Same, different? Domain specific?

Now that could be interesting, viewed a a feature of a domain. Could lead to an empirical measure of which identification works “best” in a particular domain.

Constraint-Based XML Query Rewriting for Data Integration

Constraint-Based XML Query Rewriting for Data Integration by Cong Yu and Lucian Popa.

Abstract:

We study the problem of answering queries through a target schema, given a set of mappings between one or more source schemas and this target schema, and given that the data is at the sources. The schemas can be any combination of relational or XML schemas, and can be independently designed. In addition to the source-to-target mappings, we consider as part of the mapping scenario a set of target constraints specifying additional properties on the target schema. This becomes particularly important when integrating data from multiple data sources with overlapping data and when such constraints can express data merging rules at the target. We define the semantics of query answering in such an integration scenario, and design two novel algorithms, basic query rewrite and query resolution, to implement the semantics. The basic query rewrite algorithm reformulates target queries in terms of the source schemas, based on the mappings. The query resolution algorithm generates additional rewritings that merge related information from multiple sources and assemble a coherent view of the data, by incorporating target constraints. The algorithms are implemented and then evaluated using a comprehensive set of experiments based on both synthetic and real-life data integration scenarios.

Who does this sound like?:

Data merging is notoriously hard for data integration and often not dealt with. Integration of scientific data, however, offers many complex scenarios where data merging is required. For example, proteins (each with a unique protein id) are often stored in multiple biological databases, each of which independently maintains different aspects of the protein data (e.g., structures, biological functions, etc.). When querying on a given protein through a target schema, it is important to merge all its relevant data (e.g., structures from one source, functions from another) given the constraint that protein id identifies all components of the protein.

When target constraints are present, it is not enough to consider only the mappings for query answering. The target instance that a query should “observe” must be defined by the interaction between all the mappings from the sources and all the target constraints. This interaction can be quite complex when schemas and mappings are nested and when the data merging rules can enable each other, possibly, in a recursive way. Hence, one of the first problems that we study in this paper is what it means, in a precise sense, to answer the target queries in the “best” way, given that the target instance is specified, indirectly, via the mappings and the target constraints. The rest of the paper will then address how to compute the correct answers without materializing the full target instance, via two novel algorithms that rewrite the target query into a set of corresponding source queries.

Wrong! 😉

The ACM reports sixty-seven (67) citations of this paper as of today. (Paper published in 2004.) Summaries of any of the citing literature welcome!

The question of data integration persists to this day. I take that to indicate that whatever the merits of this approach, data integration issues remain unsolved.

What are the merits/demerits of this approach?

Random Walks on the Click Graph

Filed under: Click Graph,Markov Decision Processes,Probabilistic Ranking,Random Walks — Patrick Durusau @ 7:13 pm

Random Walks on the Click Graph by Nick Craswell and Martin Szummer.

Abstract:

Search engines can record which documents were clicked for which query, and use these query-document pairs as ‘soft’ relevance judgments. However, compared to the true judgments, click logs give noisy and sparse relevance information. We apply a Markov random walk model to a large click log, producing a probabilistic ranking of documents for a given query. A key advantage of the model is its ability to retrieve relevant documents that have not yet been clicked for that query and rank those effectively. We conduct experiments on click logs from image search, comparing our (‘backward’) random walk model to a different (‘forward’) random walk, varying parameters such as walk length and self-transition probability. The most effective combination is a long backward walk with high self-transition probability.

Two points that may capture your interest:

  • The model does not consider query or document content. “Just the clicks, Ma’am.”
  • Image data is said to have “less noise” since users can see thumbnails before they follow a link. (True?)

I saw this cited quite recently but it is about five years old now (2007). Any recent literature on click graphs that you would point out?

German Compound Words

Filed under: Query Expansion,Query Rewriting,Searching — Patrick Durusau @ 7:13 pm

German Compound Words by Brian Johnson.

From the post:

Mark Twain is quoted as having said, “Some German words are so long that they have a perspective.”

Although eBay users are unlikely to search using fearsome beasts like “rindfleischetikettierungsüberwachungsaufgabenübertragungsgesetz”, which stands for the “beef labeling supervision duties delegation law”, we do frequently see compound words in our users’ queries. While some might look for “damenlederhose”, others might be searching for the same thing (women’s leather pants) using the decompounded forms “damen lederhose” or “damen leder hose”. And even though a German teacher would tell you only “damenlederhose” or “damen lederhose” are correct, the users’ expectation is to see the same results regardless of which form is used.

This scenario exists on the seller side as well. That is, people selling on eBay might describe their item using one or more of these forms. In such cases, what should a search engine do? While the problem might seem simple at first, German word-breaking – or decompounding, as it is also known – is not so simple.

And you thought all this worrying about subject identifiers was just another intellectual pose! 😉

There are serious people who spend serious money in the quest to make even more money who worry about subject identification. They don’t discuss it in topic map terms, but it is subject identity none the less.

This post should get your started on some issues with German.

What other languages/scripts have the same or similar issues? Are the solutions here extensible or are new solutions needed?

Pointers to similar resources most welcome!

Query Rewriting in Search Engines

Filed under: Query Expansion,Query Rewriting,Search Engines — Patrick Durusau @ 7:12 pm

Query Rewriting in Search Engines by Hugh Williams was mentioned in Amazon CloudSearch, Elastic Search as a Service by Jeff Dalton. (You need to read Jeff’s comments on Amazon Cloudsearch but onto query rewriting.)

From the post:

There’s countless information on search ranking – creating ranking functions, and their factors such as PageRank and text. Query rewriting is less conspicuous but equally important. Our experience at eBay is that query rewriting has the potential to deliver as much improvement to search as core ranking, and that’s what I’ve seen and heard at other companies.

What is query rewriting?

Let’s start with an example. Suppose a user queries for Gucci handbags at eBay. If we take this literally, the results will be those that have the words Gucci and handbags somewhere in the matching documents. Unfortunately, many great answers aren’t returned. Why?

Consider a document that contains Gucci and handbag, but never uses the plural handbags. It won’t match the query, and won’t be returned. Same story if the document contains Gucci and purse (rather than handbag). And again for a document that contains Gucci but doesn’t contain handbags or a synonym – instead it’s tagged in the “handbags” category on eBay; the user implicitly assumed it’d be returned when a buyer types Gucci handbags as their query.

To solve this problem, we need to do one of two things: add words to the documents so that they match other queries, or add words to the queries so that they match other documents. Query rewriting is the latter approach, and that’s the topic of this post. What I will say about expanding documents is there are tradeoffs: it’s always smart to compute something once in search and store it, rather than compute it for every query, and so there’s a certain attraction to modifying documents once. On the other hand, there are vastly more words in documents than there are words in queries, and doing too much to documents gets expensive and leads to imprecise matching (or returning too many irrelevant documents). I’ve also observed over the years that what works for queries doesn’t always work for documents.

You really need to read the post by Hugh a couple of times.

Query rewriting is approaching the problem of subject identity from the other side of topic maps.

Topic maps collect different identifiers for a subject as a basis for “merging”.

Query rewriting changes a query so it specifies different identifiers for a subject.

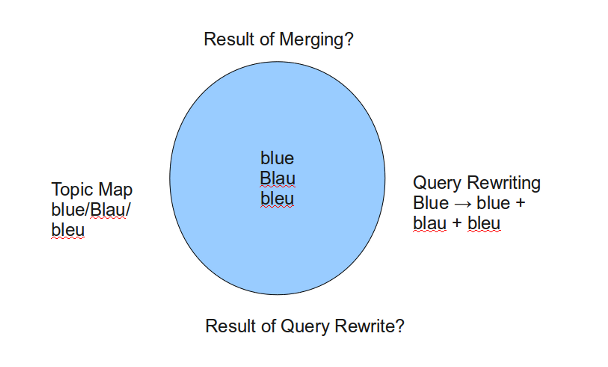
Let me try to draw a graphic for you (my graphic skills are crude at best):

Topic Maps versus Query Rewrite

I used “/” as an alternative marker for topic maps to illustrate that matching any identifier returns all of them. For query rewrite, the “+” sign indicates that each identifier is searched for in addition to the others.

The result is the same set of identifiers and results from using them on a query set.

From a different point of view.

Third Challenge on Large Scale Hierarchical Text Classification

Filed under: Classification,Contest — Patrick Durusau @ 7:12 pm

ECML/PKDD 2012 Discovery Challenge: Third Challenge on Large Scale Hierarchical Text Classification

Important dates:

– March 30, start of the challenge
– April 20, opening of the evaluation
– June 29, closing of evaluation
– July 20, paper submission deadline
– August 3, paper notifications

From the website:

This year’s discovery challenge hosts the third edition of the successful PASCAL challenges on large scale hierarchical text classification. The challenge comprises three tracks and it is based on two large datasets created from the ODP web directory (DMOZ) and Wikipedia. The datasets are multi-class, multi-label and hierarchical. The number of categories ranges between 13,000 and 325,000 roughly and the number of documents between 380,000 and 2,400,000.

The tracks of the challenge are organized as follows:

1. Standard large-scale hierarchical classification
a) On collection of medium size from Wikipedia
b) On a large collection from Wikipedia

2. Multi-task learning, based on both DMOZ and Wikipedia category systems

3. Refinement-learning
a) Semi-Supervised approach
b) Unsupervised approach

In order to register for the challenge and gain access to the datasets you must have an account at the challenge Web site.

More fun than repeating someone’s vocabulary. Yes?

The Statistical Core Vocabulary (scovo)

Filed under: Statistical Core Vocabulary (scovo),Statistics,Vocabularies — Patrick Durusau @ 7:12 pm

The Statistical Core Vocabulary (scovo)

From the webpage:

This document specifies an [RDF-Schema] vocabulary for representing statistical data on the Web. It is normatively encoded in [XHTML+RDFa], that is embedded in this page.

The homepage reports this vocabulary as deprecated but cited as a namespace in the RDF Data Cube Vocabulary (1.6).

I don’t have any numbers on the actual use of this vocabulary but you probably need to be aware of it.

Data Documentation Initiative (DDI)

Filed under: Data,Data Documentation Initiative (DDI),Vocabularies — Patrick Durusau @ 7:12 pm

Data Documentation Initiative (DDI)

From the website:

The Data Documentation Initiative (DDI) is an effort to create an international standard for describing data from the social, behavioral, and economic sciences. Expressed in XML, the DDI metadata specification now supports the entire research data life cycle. DDI metadata accompanies and enables data conceptualization, collection, processing, distribution, discovery, analysis, repurposing, and archiving.

Two current development lines:

DDI-Lifecycle

Encompassing all of the DDI-Codebook specification and extending it, DDI-Lifecycle is designed to document and manage data across the entire life cycle, from conceptualization to data publication and analysis and beyond. Based on XML Schemas, DDI-Lifecycle is modular and extensible.

Users new to DDI are encouraged to use this DDI-Lifecycle development line as it incorporates added functionality. Use DDI-Lifecycle if you are interested in:

  • Metadata reuse across the data life cycle
  • Metadata-driven survey design
  • Question banks
  • Complex data, e.g., longitudinal data
  • Detailed geographic information
  • Multiple languages
  • Compliance with other metadata standards like ISO 11179
  • Process management and automation

The current version of the DDI-L Specification is Version 3.1.  DDI 3.1 was published in October 2009, superseding DDI 3.0 (published in April 2008). 

DDI-Codebook

DDI-Codebook is a more light-weight version of the standard, intended primarily to document simple survey data. Originally DTD-based, DDI-C is now available as an XML Schema.

The current version of DDI-C is 2.5.

Be aware that micro-data in DDI was mentioned in The RDF Data Cube Vocabulary draft as a possible target for “extension” of that proposal.

Suggestions of other domain specific data vocabularies?

Unlike the W3C I don’t see the need for an embrace and extent strategy.

There are enough vocabularies, from ancient to present-day to keep us all busy for the foreseeable future. Without trying to restart every current vocabulary effort.

« Newer PostsOlder Posts »

Powered by WordPress