Another Word For It Patrick Durusau on Topic Maps and Semantic Diversity

October 26, 2013

0xdata Releases Second Generation H2O…

Filed under: H20,Hadoop,Machine Learning — Patrick Durusau @ 8:01 pm

0xdata Releases Second Generation H2O, Big Data’s Fastest Open Source Machine Learning and Predictive Analytics Engine

From the post:

0xdata (www.0xdata.com), the open source machine learning and predictive analytics company for big data, today announced general availability of the latest release of H2O, the industry’s fastest prediction engine for big data users of Hadoop, R and Excel. H2O delivers parallel and distributed advanced algorithms on big data at speeds up to 100X faster than other predictive analytics providers.

The second generation H2O “Fluid Vector” release — currently in use at two of the largest insurance companies in the world, the largest provider of streaming video entertainment and the largest online real estate services company — delivers new levels of performance, ease of use and integration with R. Early H2O customers include Netflix, Trulia and Vendavo.

“We developed H2O to unlock the predictive power of big data through better algorithms,” said SriSatish Ambati, CEO and co-founder of 0xdata. “H2O is simple, extensible and easy to use and deploy from R, Excel and Hadoop. The big data science world is one of algorithm-haves and have-nots. Amazon, Goldman Sachs, Google and Netflix have proven the power of algorithms on data. With our viral and open Apache software license philosophy, along with close ties into the math, Hadoop and R communities, we bring the power of Google-scale machine learning and modeling without sampling to the rest of the world.”

“Big data by itself is useless. It is only when you have big data plus big analytics that one has the capability to achieve big business impact. H2O is the platform for big analytics that we have found gives us the biggest advantage compared with other alternatives,” said Chris Pouliot, Director of Algorithms and Analytics at Netflix and advisor to 0xdata. “Our data scientists can build sophisticated models, minimizing their worries about data shape and size on commodity machines. Over the past year, we partnered with the talented 0xdata team to work with them on building a great product that will meet and exceed our algorithm needs in the cloud.”

From the H2O Github page:

H2O makes hadoop do math!
H2O scales statistics, machine learning and math over BigData. H2O is extensible and users can build blocks using simple math legos in the core.
H2O keeps familiar interfaces like R, Excel & JSON so that big data enthusiasts & & experts can explore, munge, model and score datasets using a range of simple to advanced algorithms.
Data collection is easy. Decision making is hard. H2O makes it fast and easy to derive insights from your data through faster and better predictive modeling

Product Vision for first cut:

  • H2O, the Analytics Engine will scale Classification and Regression.
  • RandomForest, Generalized Linear Modeling (GLM), logistic regression, k-Means, available over R / REST/ JSON-API
  • Basic Linear Algebra as building blocks for custom algorithms
  • High predictive power of the models
  • High speed and scale for modeling and validation over BigData
  • Data Sources:
    • We read and write from/to HDFS, S3
    • We ingest data in CSV format from local and distributed filesystems (nfs)
    • A JDBC driver for SQL and DataAdapters for NoSQL datasources is in the roadmap. (v2)
  • Adhoc Data Analytics at scale via R-like Parser on BigData

Machine learning is not as ubiquitous as Excel, yet.

But like Excel, the quality of results depends on the skills of the user, not the technology.
October 24, 2013

I Mapreduced a Neo store:…

Filed under: Graphs,Hadoop,Neo4j — Patrick Durusau @ 2:14 pm

I Mapreduced a Neo store: Creating large Neo4j Databases with Hadoop by Kris Geusebroek. (Berlin Buzzwords 2013)

From the description:

When exploring very large raw datasets containing massive interconnected networks, it is sometimes helpful to extract your data, or a subset thereof, into a graph database like Neo4j. This allows you to easily explore and visualize networked data to discover meaningful patterns.

When your graph has 100M+ nodes and 1000M+ edges, using the regular Neo4j import tools will make the import very time-intensive (as in many hours to days).

In this talk, I’ll show you how we used Hadoop to scale the creation of very large Neo4j databases by distributing the load across a cluster and how we solved problems like creating sequential row ids and position-dependent records using a distributed framework like Hadoop.

If you find the slides hard to read (I did) you may want to try:

Combining Neo4J and Hadoop (part I) and,

Combining Neo4J and Hadoop (part II)

A recent update from Chris: I MapReduced a Neo4j store.

BTW, the code is on github.

Just in case you have any modest sized graphs that you want to play with in Neo4j. 😉

PS: I just found Chris’s slides: http://www.slideshare.net/godatadriven/i-mapreduced-a-neo-store-creating-large-neo4j-databases-with-hadoop

October 20, 2013

PredictionIO Guide

Filed under: Cascading,Hadoop,Machine Learning,Mahout,Scalding — Patrick Durusau @ 4:20 pm

PredictionIO Guide

From the webpage:

PredictionIO is an open source Machine Learning Server. It empowers programmers and data engineers to build smart applications. With PredictionIO, you can add the following features to your apps instantly:

  • predict user behaviors
  • offer personalized video, news, deals, ads and job openings
  • help users to discover interesting events, documents, apps and restaurants
  • provide impressive match-making services
  • and more….

PredictionIO is built on top of solid open source technology. We support Hadoop, Mahout, Cascading and Scalding natively.

PredictionIO looks interesting in general but especially its Item Similarity Engine.

From the Item Similarity: Overview:

People who like this may also like….

This engine tries to suggest N items that are similar to a targeted item. By being ‘similar’, it does not necessarily mean that the two items look alike, nor they share similar attributes. The definition of similarity is independently defined by each algorithm and is usually calculated by a distance function. The built-in algorithms assume that similarity between two items means the likelihood any user would like (or buy, view etc) both of them.

The example that comes to mind is merging all “shoes” from any store and using the resulting price “occurrences” to create a price range and average for each store.

October 16, 2013

Hadoop Tutorials – Hortonworks

Filed under: Hadoop,HCatalog,HDFS,Hive,Hortonworks,MapReduce,Pig — Patrick Durusau @ 4:49 pm

With the GA release of Hadoop 2, it seems appropriate to list a set of tutorials for the Hortonworks Sandbox.

Tutorial 1: Hello World – An Overview of Hadoop with HCatalog, Hive and Pig

Tutorial 2: How To Process Data with Apache Pig

Tutorial 3: How to Process Data with Apache Hive

Tutorial 4: How to Use HCatalog, Pig & Hive Commands

Tutorial 5: How to Use Basic Pig Commands

Tutorial 6: How to Load Data for Hadoop into the Hortonworks Sandbox

Tutorial 7: How to Install and Configure the Hortonworks ODBC driver on Windows 7

Tutorial 8: How to Use Excel 2013 to Access Hadoop Data

Tutorial 9: How to Use Excel 2013 to Analyze Hadoop Data

Tutorial 10: How to Visualize Website Clickstream Data

Tutorial 11: How to Install and Configure the Hortonworks ODBC driver on Mac OS X

Tutorial 12: How to Refine and Visualize Server Log Data

Tutorial 13: How To Refine and Visualize Sentiment Data

Tutorial 14: How To Analyze Machine and Sensor Data

By the time you finish these, I am sure there will be more tutorials or even proposed additions to the Hadoop stack!

(Updated December 3, 2013 to add #13 and #14.)

Apache Hadoop 2 is now GA!

Filed under: BigData,Hadoop,Hadoop YARN — Patrick Durusau @ 4:37 pm

Apache Hadoop 2 is now GA! by Arun Murthy.

From the post:

I’m thrilled to note that the Apache Hadoop community has declared Apache Hadoop 2.x as Generally Available with the release of hadoop-2.2.0!

This represents the realization of a massive effort by the entire Apache Hadoop community which started nearly 4 years to date, and we’re sure you’ll agree it’s cause for a big celebration. Equally, it’s a great credit to the Apache Software Foundation which provides an environment where contributors from various places and organizations can collaborate to achieve a goal which is as significant as Apache Hadoop v2.

Congratulations to everyone!
(emphasis in the original)

See Arun’s post for his summary of Hadoop 2.

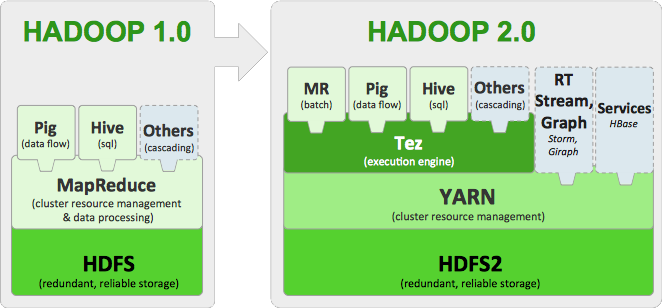
Take the following graphic I stole from his post as motivation to do so:

Hadoop Stack

October 8, 2013

Hadoop: Is There a Metadata Mess Waiting in the Wings?

Filed under: Hadoop,HDFS — Patrick Durusau @ 6:47 pm

Hadoop: Is There a Metadata Mess Waiting in the Wings? by Robin Bloor.

From the post:

Why is Hadoop so popular? There are many reasons. First of all it is not so much a product as an ecosystem, with many components: MapReduce, HBase, HCatalog, Pig, Hive, Sqoop, Mahout and quite a few more. That makes it versatile, and all these components are open source, so most of them improve with each release cycle.

But, as far as I can tell, the most important feature of Hadoop is its file system: HDFS. This has two notable features: it is a key-value store, and it is built for scale-out use. The IT industry seemed to have forgotten about key-value stores. They used to be called ISAM files and came with every operating system until Unix, then Windows and Linux took over. These operating systems didn’t provide general purpose key-value stores, and nobody seemed to care much because there was a plethora of databases that you could use to store data, and there were even inexpensive open source ones. So, that seemed to take care of the data layer.

But it didn’t. The convenience of a key-value store is that you can put anything you want into it as long as you can think of a suitable index for it, and that is usually a simple choice. With a database you have to create a catalog or schema to identify what’s in every table. And, if you are going to use the data coherently, you have to model the data and determine what tables to hold and what attributes are in each table. This puts a delay into importing data from new sources into the database.

Now you can, if you want, treat a database table as a key-value store and define only the index. But that is regarded as bad practice, and it usually is. Add to this the fact that the legacy databases were never built to scale out and you quickly conclude that Hadoop can do something that a database cannot. It can become a data lake – a vast and very scalable data staging area that will accommodate any data you want, no matter how “unstructured” it is.

I rather like that imagery, unadorned Hadoop as a “data lake.”

But that’s not the only undocumented data in a Hadoop ecosystem.

What about the PIG scripts? The MapReduce routines? Or Mahout, Hive, Hbase, etc., etc.

Do you think all the other members of the Hadoop ecosystem also have undocumented data? And other variables?

When Robin mentions Revelytix as having a solution, I assume he means Loom.

Looking at Loom, ask yourself how well it documents other parts of the Hadoop ecosystem?

Robin has isolated a weakness in the current Hadoop system that will unexpectedly and suddenly make itself known.

Will you be ready?

October 7, 2013

Hortonworks Sandbox – Default Instructional Tool?

Filed under: BigData,Eclipse,Hadoop,Hortonworks,Visualization — Patrick Durusau @ 10:07 am

Visualizing Big Data: Actuate, Hortonworks and BIRT

From the post:

Challenge

Hadoop stores data in key-value pairs. While the raw data is accessible to view, to be usable it needs to be presented in a more intuitive visualization format that will allow users to glean insights at a glance. While a business analytics tool can help business users gather those insights, to do so effectively requires a robust platform that can:

  • Work with expansive volumes of data
  • Offer standard and advanced visualizations, which can be delivered as reports, dashboards or scorecards
  • Be scalable to deliver these visualizations to a large number of users

Solution

When paired with Hortonworks, Actuate adds data visualization support for the Hadoop platform, using Hive queries to access data from Hortonworks. Actuate’s commercial product suite – built on open source Eclipse BIRT – extracts data from Hadoop, pulling data sets into interactive BIRT charts, dashboards and scorecards, allowing users to view and analyze data (see diagram below). With Actuate’s familiar approach to presenting information in easily modified charts and graphs, users can quickly identify patterns, resolve business issues and discover opportunities through personalized insights. This is further enhanced by Actuate’s inherent ability to combine Hadoop data with more traditional data sources in a single visualization screen or dashboard.

A BIRT/Hortonworks “Sandbox” for both the Eclipse open source and commercial versions of BIRT is now available. As a full HDP environment on a virtual machine, the Sandbox allows users to start benefiting quickly from Hortonworks’ distribution of Hadoop with BIRT functionality.

If you know about “big data” you should be familiar with the Hortonworks Sandbox.

Sandbox is a personal, portable Hadoop environment that comes with a dozen interactive Hadoop tutorials. Sandbox includes many of the most exciting developments from the latest HDP distribution, packaged up in a virtual environment that you can get up and running in 15 minutes!

What you may not know is that Hortonworks partners are creating additional tutorials based on the sandbox.

I count seven (7) to date and more are coming.

The Sandbox may become the default instructional tool for Hadoop.

That would be a benefit to all users, whatever the particulars of their environments.

October 1, 2013

Get Started with Hadoop

Filed under: BigData,Hadoop,Hortonworks — Patrick Durusau @ 6:16 pm

Get Started with Hadoop

If you want to avoid being a Gartner statistic or hear big data jokes involving the name of your enterprise, this is a page to visit.

Hortonworks, one of the leading contributors to the Hadoop ecosystem, has assembled resources targeted at developers, analysts and systems administrators.

There are videos, tutorials and even a Hadoop sandbox.

All of which are free.

The choice is yours: Spend enterprise funds and hope to avoid failure or spend some time and plan for success.

September 22, 2013

…Hive Functions in Hadoop

Filed under: Hadoop,Hive,SQL — Patrick Durusau @ 3:22 pm

Cheat Sheet: How To Work with Hive Functions in Hadoop by Marc Holmes.

From the post:

Just a couple of weeks ago we published our simple SQL to Hive Cheat Sheet. That has proven immensely popular with a lot of folk to understand the basics of querying with Hive. Our friends at Qubole were kind enough to work with us to extend and enhance the original cheat sheet with more advanced features of Hive: User Defined Functions (UDF). In this post, Gil Allouche of Qubole takes us from the basics of Hive through to getting started with more advanced uses, which we’ve compiled into another cheat sheet you can download here.

The cheat sheet will be useful but so is this observation in the conclusion of the post:

One of the key benefits of Hive is using existing SQL knowledge, which is a common skill found across business analysts, data analysts, software engineers, data scientist and others. Hive has nearly no barriers for new users to start exploring and analyzing data.

I’m sure use of existing SQL knowledge isn’t the only reason for Hive’s success, but the Hive PowerBy page shows it didn’t hurt!

Something to think about in creating a topic map query language. Yes, the queries executed by an engine will be traversing a topic map graph, but presenting it to the user as a graph query isn’t required.

September 15, 2013

Apache Tez: A New Chapter in Hadoop Data Processing

Filed under: Hadoop,Hadoop YARN,Tez — Patrick Durusau @ 3:56 pm

Apache Tez: A New Chapter in Hadoop Data Processing by Bikas Saha.

From the post:

In this post we introduce the motivation behind Apache Tez (http://incubator.apache.org/projects/tez.html) and provide some background around the basic design principles for the project. As Carter discussed in our previous post on Stinger progress, Apache Tez is a crucial component of phase 2 of that project.

What is Apache Tez?

Apache Tez generalizes the MapReduce paradigm to execute a complex DAG (directed acyclic graph) of tasks. It also represents the next logical next step for Hadoop 2 and the introduction of with YARN and its more general-purpose resource management framework.

While MapReduce has served masterfully as the data processing backbone for Hadoop, its batch-oriented nature makes it unsuited for certain workloads like interactive query. Tez represents an alternate to the traditional MapReduce that allows for jobs to meet demands for fast response times and extreme throughput at petabyte scale. A great example of a benefactor of this new approach is Apache Hive and the work being done in the Stinger Initiative.

Motivation

Distributed data processing is the core application that Apache Hadoop is built around. Storing and analyzing large volumes and variety of data efficiently has been the cornerstone use case that has driven large scale adoption of Hadoop, and has resulted in creating enormous value for the Hadoop adopters. Over the years, while building and running data processing applications based on MapReduce, we have understood a lot about the strengths and weaknesses of this framework and how we would like to evolve the Hadoop data processing framework to meet the evolving needs of Hadoop users. As the Hadoop compute platform moves into its next phase with YARN, it has decoupled itself from MapReduce being the only application, and opened the opportunity to create a new data processing framework to meet the new challenges. Apache Tez aspires to live up to these lofty goals.

Does your topic map engine decoupled from a single merging algorithm?

I ask because SLAs may require different algorithms for data sets or sources.

Leaked U.S. military documents may have a higher priority for completeness than half-human/half-bot posts on a Twitter stream.

September 14, 2013

How to Refine and Visualize Twitter Data [Al-Qaeda Bots?]

Filed under: Hadoop,Tweets,Visualization — Patrick Durusau @ 6:34 pm

How to Refine and Visualize Twitter Data by Cheryle Custer.

From the post:

He loves me, he loves me not… using daisies to figure out someone’s feelings is so last century. A much better way to determine whether someone likes you, your product or your company is to do some analysis on Twitter feeds to get better data on what the public is saying. But how do you take thousands of tweets and process them? We show you how in our video – Understand your customers’ sentiments with Social Media Data – that you can capture a Twitter stream to do Sentiment Analysis.

Twitter Sentiment VisualizationNow, when you boot up your Hortonworks Sandbox today, you’ll find Tutorial 13: Refining and Visualizing Sentiment Data as the companion step-by-step guide to the video. In this Hadoop tutorial, we will show you how you can take a Twitter stream and visualize it in Excel 2013 or you could use your own favorite visualization tool. Note you can use any version of Excel, but Excel 2013 allows you do plot the data on a map where other versions will limit you to the built-in charting function.
(…)

A great tutorial from Hortonworks as always!

My only reservation is the acceptance of Twitter data for sentiment analysis.

True, it is easy to obtain, not all that difficult to process, but that isn’t the same thing as having any connection with sentiment about a company or product.

Consider that a now somewhat dated report (2012) reported that 51% of all Internet traffic is “non-human.”

If that is the case or has worsened since then, how do you account for that in your sentiment analysis?

Or if you are monitoring the Internet for Al-Qaeda threats, how do you distinguish threats from Al-Qaeda bots from threats by Al-Qaeda members?

What if threat levels are being gamed by Al-Qaeda bot networks?

Forcing expenditure of resources on a global scale at a very small cost.

A new type of asymmetric warfare?

September 10, 2013

How To Capitalize on Clickstream data with Hadoop

Filed under: Hadoop,Marketing — Patrick Durusau @ 10:17 am

How To Capitalize on Clickstream data with Hadoop by Cheryle Custer.

From the post:

In the last 60 seconds there were 1,300 new mobile users and there were 100,000 new tweets. As you contemplate what happens in an internet minute Amazon brought in $83,000 worth of sales. What would be the impact of you being able to identify:

  • What is the most efficient path for a site visitor to research a product, and then buy it?
  • What products do visitors tend to buy together, and what are they most likely to buy in the future?
  • Where should I spend resources on fixing or enhancing the user experience on my website?

In the Hortonworks Sandbox, you can run a simulation of website Clickstream behavior to see where users are located and what they are doing on the website. This tutorial provides a dataset of a fictitious website and the behavior of the visitors on the site over a 5 day period. This is a 4 million line dataset that is easily ingested into the single node cluster of the Sandbox via HCatalog.

The first paragraph is what I would call an Economist lead-in. It captures your attention:

…60 seconds…1300 new mobile users …100,000 new tweets. …minute…Amazon…$83,000…sales.

If the Economist is your regular fare, your pulse rate went up at “1300 new mobile users” and by the minute/$83,000 you started to tingle. 😉

How to translate that for semantic technologies in general and topic maps in particular?

Remember The Monstrous Cost of Work Failure graphic?

Where we read that 58% of employees spend one-half of a workday “filing, deleting, or sorting information.”

Just to simplify the numbers, one-quarter (1/4) of your total workforce hours are spent on “filing, deleting, or sorting information.”

Divide your current payroll figure by four (4).

Does that result get your attention?

If not, call emergency services. You are dead or having a medical crisis.

Use that payroll division as:

A positive, topic maps can help you recapture some of that 1/4 of your payroll, or

A negative, topic maps can help you stem the bleeding from non-productive activity,

depending on which will be more effective with a particular client.

BTW, do read Cheryle’s post.

Hadoop’s capabilities are more limited by your imagination than any theoretical CS limit.

September 5, 2013

Introducing Cloudera Search

Filed under: Cloudera,Hadoop,Search Engines — Patrick Durusau @ 6:15 pm

Introducing Cloudera Search

Cloudera Search 1.0 has hit the streets!

Download

Prior coverage of Cloudera Search: Hadoop for Everyone: Inside Cloudera Search.

Enjoy!

September 3, 2013

…Integrate Tableau and Hadoop…

Filed under: Hadoop,Hortonworks,Tableau — Patrick Durusau @ 7:34 pm

How To Integrate Tableau and Hadoop with Hortonworks Data Platform by Kim Truong.

From the post:

Chances are you’ve already used Tableau Software if you’ve been involved with data analysis and visualization solutions for any length of time. Tableau 6.1.4 introduced the ability to visualize large, complex data stored in Hadoop with Hortonworks Data Platform via Hive and the Hortonworks Hive ODBC driver.

If you want to get hands on with Tableau as quickly as possible, we recommend using the Hortonworks Sandbox and the ‘Visualize Data with Tableau’ tutorial.

(…)

Kim has a couple of great resources from Tableau to share with you so jump to her post now.

That’s right. I want you to look at someone else’s blog. Won’t catch on at capture sites with advertising but then that’s not me.

Summingbird [Twitter open sources]

Filed under: Hadoop,Storm,Summingbird,Tweets — Patrick Durusau @ 5:59 pm

Twitter open sources Storm-Hadoop hybrid called Summingbird by Derrick Harris.

I look away for a few hours to review a specification and look what pops up:

Twitter has open sourced a system that aims to mitigate the tradeoffs between batch processing and stream processing by combining them into a hybrid system. In the case of Twitter, Hadoop handles batch processing, Storm handles stream processing, and the hybrid system is called Summingbird. It’s not a tool for every job, but it sounds pretty handy for those it’s designed to address.

Twitter’s blog post announcing Summingbird is pretty technical, but the problem is pretty easy to understand if you think about how Twitter works. Services like Trending Topics and search require real-time processing of data to be useful, but they eventually need to be accurate and probably analyzed a little more thoroughly. Storm is like a hospital’s triage unit, while Hadoop is like longer-term patient care.

This description of Summingbird from the project’s wiki does a pretty good job of explaining how it works at a high level.

(…)

While the Summingbird announcement is heavy sledding, it is well written. The projects spawned by Summingbird are rife with possibilities.

I appreciate Derrick’s comment:

It’s not a tool for every job, but it sounds pretty handy for those it’s designed to address.

I don’t know of any tools “for every job,” the opinions of some graph advocates notwithstanding. 😉

If Summingbird fits your problem set, spend some serious time seeing what it has to offer.

August 28, 2013

A Set of Hadoop-related Icons

Filed under: Graphics,Hadoop — Patrick Durusau @ 6:56 pm

A Set of Hadoop-related Icons by Marc Holmes.

From the post:

The best architecture diagrams are those that impart the intended knowledge with maximum efficiency and minimum ambiguity. But sometimes there’s a need to add a little pizazz, and maybe even draw a picture or two for those Powerpoint moments.

Marc introduces a small set of Hadoop-related icons.

It will be interesting to see if these icons catch on as the defaults for Hadoop-related presentations.

Would be nice to have something similar for topic maps, if there are any artistic topic mappers in the audience.

Building a distributed search system

Filed under: Distributed Computing,Hadoop,Lucene,Search Engines — Patrick Durusau @ 2:13 pm

Building a distributed search system with Apache Hadoop and Lucene by Mirko Calvaresi.

From the preface:

This work analyses the problem coming from the so called Big Data scenario, which can be defined as the technological challenge to manage and administer quantity of information with global dimension in the order of Terabyte (1012bytes) or Petabyte (1015bytes) and with an exponential growth rate. We’ll explore a technological and algorithmic approach to handle and calculate theses amounts of data that exceed the limit of computation of a traditional architecture based on real-time request processing:in particular we’ll analyze a singular open source technology, called Apache Hadoop, which implements the approach described as Map and Reduce.

We’ll describe also how to distribute a cluster of common server to create a Virtual File System and use this environment to populate a centralized search index (realized using another open source technology, called Apache Lucene). The practical implementation will be a web based application which offers to the user a unified searching interface against a collection of technical papers. The scope is to demonstrate that a performant search system can be obtained pre-processing the data using the Map and Reduce paradigm, in order to obtain a real time response, which is independent to the underlying amount of data. Finally we’ll compare this solutions to different approaches based on clusterization or No SQL solutions, with the scope to describe the characteristics of concrete scenarios, which suggest the adoption of those technologies.

Fairly complete (75 pages) report on a project indexing academic papers with Lucene and Hadoop.

I would like to see treatment of the voiced demand for “real-time processing” versus the need for “real-time processing.”

When I started using research tools, indexes, like the Readers Guide to Periodical Literature were at a minimum two (2) weeks behind popular journals.

Academic indexes ran that far behind if not a good bit longer.

The timeliness of indexing journal articles is now nearly simultaneous with publication.

Has the quality of our research improved due to faster access?

I can imagine use cases, drug interactions for example, the discovery of which should be streamed out as soon as practical.

But drug interactions are not the average case.

It would be very helpful to see research on what factors favor “real-time” solutions and which are quite sufficient with “non-real-time” solutions.

August 26, 2013

Apache Hadoop 2 (beta)

Filed under: Hadoop,MapReduce — Patrick Durusau @ 10:24 am

Announcing Beta Release of Apache Hadoop 2 by Arun Murthy.

From the post:

It’s my great pleasure to announce that the Apache Hadoop community has declared Hadoop 2.x as Beta with the vote closing over the weekend for the hadoop-2.1.0-beta release.

As noted in the announcement to the mailing lists, this is a significant milestone across multiple dimensions: not only is the release chock-full of significant features (see below), it also represents a very stable set of APIs and protocols on which we can continue to build for the future. In particular, the Apache Hadoop community has spent an enormous amount of time paying attention to stability and long-term viability of our APIs and wire protocols for both HDFS and YARN. This is very important as we’ve already seen a huge interest in other frameworks (open-source and proprietary) move atop YARN to process data and run services *in* Hadoop.

It is always nice to start the week with something new.

Your next four steps:

  1. Download and install Hadoop 2.
  2. Experiment with and use Hadoop 2.
  3. Look for and report bugs (and fixes if possible) for Hadoop 2.
  4. Enjoy!

August 22, 2013

Indexing use cases and technical strategies [Hadoop]

Filed under: Hadoop,HDFS,Indexing — Patrick Durusau @ 6:02 pm

Indexing use cases and technical strategies

From the post:

In this post, let us look at 3 real life indexing use cases. While Hadoop is commonly used for distributed batch index building, it is desirable to optimize the index capability in near real time. We look at some practical real life implementations where the engineers have successfully worked out their technology stack combinations using different products.

Resources on:

  1. Near Real Time index at eBay
  2. Distributed indexing strategy at Trovit
  3. Incremental Processing by Google’s Percolator

Presentations and a paper for the weekend!

August 20, 2013

Step by step to build my first R Hadoop System

Filed under: Hadoop,R,RHadoop — Patrick Durusau @ 5:16 pm

Step by step to build my first R Hadoop System by Yanchang Zhao.

From the post:

After reading documents and tutorials on MapReduce and Hadoop and playing with RHadoop for about 2 weeks, finally I have built my first R Hadoop system and successfully run some R examples on it. My experience and steps to achieve that are presented at http://www.rdatamining.com/tutorials/rhadoop. Hopefully it will make it easier to try RHadoop for R users who are new to Hadoop. Note that I tried this on Mac only and some steps might be different for Windows.

Before going through the complex steps, you may want to have a look what you can get with R and Hadoop. There is a video showing Wordcount MapReduce in R at http://www.youtube.com/watch?v=hSrW0Iwghtw.

Unfortunately, I can’t get the video sound to work.

On the other hand, the step by step instructions are quite helpful, even without the video.

August 16, 2013

ST_Geometry Aggregate Functions for Hive…

Filed under: Geographic Data,Geographic Information Retrieval,Hadoop,Hive — Patrick Durusau @ 4:00 pm

ST_Geometry Aggregate Functions for Hive in Spatial Framework for Hadoop by Jonathan Murphy.

From the post:

We are pleased to announce that the ST_Geometry aggregate functions are now available for Hive, in the Spatial Framework for Hadoop. The aggregate functions can be used to perform a convex-hull, intersection, or union operation on geometries from multiple records of a dataset.

While the non-aggregate ST_ConvexHull function returns the convex hull of the geometries passed like a single function call, the ST_Aggr_ConvexHull function accumulates the geometries from the rows selected by a query, and performs a convex hull operation over those geometries. Likewise, ST_Aggr_Intersection and ST_Aggr_Union aggregrate the geometries from multiple selected rows, to perform intersection and union operations, respectively.

The example given covers earthquake data and California-county data.

I have a weakness for aggregating functions as you know. 😉

The other point this aggregate functions illustrates is that sometimes you want subjects to be treated as independent of each other and sometimes you want to treat them as a group.

Depends upon your requirements.

There really isn’t a one size fits all granularity of subject identity for all situations.

August 15, 2013

Video Tutorials on Hadoop for Microsoft Developers

Filed under: Hadoop,Microsoft — Patrick Durusau @ 7:05 pm

Video Tutorials on Hadoop for Microsoft Developers by Marc Holmes.

From the post:

If you’re a Microsoft developer and stepping into Hadoop for the first time with HDP for Windows, then we thought we’d highlight this fantastic resource from Rob Kerr, Chris Campbell and Garrett Edmondson : the MSBIAcademy.

They’ve produced a high quality, practical series of videos covering anything from essential MapReduce concepts, to using .NET (in this case C#) to submit MapReduce jobs to HDInsight, to using Apache Pig for Web Log Analysis. As you may know, HDInsight is based on Hortonworks HDP platform.

More resources on Hadoop by Microsoft! (see: Microsoft as Hadoop Leader)

The more big data, the greater the need for accurate and repeatable semantics.

Go big data!

August 12, 2013

Microsoft as Hadoop Leader

Filed under: Hadoop,Microsoft,REEF — Patrick Durusau @ 3:03 pm

Microsoft to open source a big data framework called REEF by Derrick Harris.

From the post:

Microsoft has developed a big data framework called REEF (a graciously simple acronym for Retainable Evaluator Execution Framework) that the company intends to open source in about a month. REEF is designed to run on top of YARN, the next-generation resource manager for Hadoop, and is particularly well suited for building machine learning jobs.

Microsoft Technical Fellow and CTO of Information Services Raghu Ramakrishnan explained REEF and Microsoft’s plans to open source it during a Monday morning keynote at the International Conference for Knowledge Mining and Data Discovery, taking place in Chicago.

YARN is a resource manager developed as part of the Apache Hadoop project that lets users run and manage multiple types of jobs (e.g., batch MapReduce, stream processing with Storm and/or a graph-processing package) atop the same cluster of physical machines. This makes it possible not only to consolidate the number of systems that an organization has to manage, but also to run different types of analysis on top of the same data from the same place. In some cases, the entire data workflow can be carried out on just one cluster of machines.

This is very good news!

In part because it furthers the development of the Hadoop ecosystem.

But also because it reinforces the Microsoft commitment to the Hadoop ecosystem.

If you think of TCP/IP as a roadway, consider the value of good and services moving along it.

Now think of the Hadoop ecosystem as another roadway.

An interoperable and high-speed roadway for data and data analysis.

Who has user facing applications that rely on data and data analysis? 😉

Here’s to hoping that MS doubles down on the Hadoop ecosystem!

August 9, 2013

Introducing Watchtower…

Filed under: Hadoop,Pig — Patrick Durusau @ 6:43 pm

Introducing Watchtower – Like Light Table for Pig by Thomas Millar.

From the post:

There are no two ways around it, Hadoop development iterations are slow. Traditional programmers have always had the benefit of re-compiling their app, running it, and seeing the results within seconds. They have near instant validation that what they’re building is actually working. When you’re working with Hadoop, dealing with gigabytes of data, your development iteration time is more like hours.

Inspired by the amazing real-time feedback experience of Light Table, we’ve built Mortar Watchtower to bring back that almost instant iteration cycle developers are used to. Not only that, Watchtower also helps surface the semantics of your Pig scripts, to give you insight into how your scripts are working, not just that they are working.

Instant Feedback

Watchtower is a daemon that sits in the background, continuously flowing a sample of your data through your script while your work. It captures what your data looks like, and shows how it mutates at each step, directly inline with your script.

I am not sure about the “…helps surface the semantics of your Pig scripts…,” but just checking scripts against data is a real boon.

I continue to puzzle over how the semantics of data and operations in Pig scripts should be documented.

Old style C comments seem out of place in 21st century programming.

I first saw this at Alex Popescu’s Watchtower – Instant feedback development tool for Pig.

August 2, 2013

How-to: Use Eclipse with MapReduce in Cloudera’s QuickStart VM

Filed under: Cloudera,Eclipse,Hadoop,MapReduce — Patrick Durusau @ 6:26 pm

How-to: Use Eclipse with MapReduce in Cloudera’s QuickStart VM by Jesse Anderson.

From the post:

One of the common questions I get from students and developers in my classes relates to IDEs and MapReduce: How do you create a MapReduce project in Eclipse and then debug it?

To answer that question, I have created a screencast showing you how, using Cloudera’s QuickStart VM:

The QuickStart VM helps developers get started writing MapReduce code without having to worry about software installs and configuration. Everything is installed and ready to go. You can download the image type that corresponds to your preferred virtualization platform.

Eclipse is installed on the VM and there is a link on the desktop to start it.

Nice illustration of walking through the map reduce process.

I continue to be impressed by the use of VMs.

Would be a nice way to distribute topic map tooling.

July 30, 2013

Parquet 1.0: Columnar Storage for Hadoop

Filed under: Columnar Database,Hadoop,Parquet — Patrick Durusau @ 6:49 pm

Announcing Parquet 1.0: Columnar Storage for Hadoop by Justin Kestelyn.

From the post:

In March we announced the Parquet project, the result of a collaboration between Twitter and Cloudera intended to create an open-source columnar storage format library for Apache Hadoop.

Today, we’re happy to tell you about a significant Parquet milestone: a 1.0 release, which includes major features and improvements made since the initial announcement. But first, we’ll revisit why columnar storage is so important for the Hadoop ecosystem.

What is Parquet and Columnar Storage?

Parquet is an open-source columnar storage format for Hadoop. Its goal is to provide a state of the art columnar storage layer that can be taken advantage of by existing Hadoop frameworks, and can enable a new generation of Hadoop data processing architectures such as Impala, Drill, and parts of the Hive ‘Stinger’ initiative. Parquet does not tie its users to any existing processing framework or serialization library.

The idea behind columnar storage is simple: instead of storing millions of records row by row (employee name, employee age, employee address, employee salary…) store the records column by column (all the names, all the ages, all the addresses, all the salaries). This reorganization provides significant benefits for analytical processing:

  • Since all the values in a given column have the same type, generic compression tends to work better and type-specific compression can be applied.
  • Since column values are stored consecutively, a query engine can skip loading columns whose values it doesn’t need to answer a query, and use vectorized operators on the values it does load.

These effects combine to make columnar storage a very attractive option for analytical processing.

A little over four (4) months from announcement to a 1.0 release!

Now that’s performance!

The Hadoop ecosystem just keeps getting better.

July 29, 2013

New Community Forums for Cloudera Customers and Users

Filed under: Cloudera,Hadoop,MapReduce,Taxonomy — Patrick Durusau @ 4:34 pm

New Community Forums for Cloudera Customers and Users by Justin Kestelyn.

From the post:

This is a great day for technical end-users – developers, admins, analysts, and data scientists alike. Starting now, Cloudera complements its traditional mailing lists with a new, feature-rich community forums intended for users of Cloudera’s Platform for Big Data! (Login using your existing credentials or click the link to register.)

Although mailing lists have long been a standard for user interaction, and will undoubtedly continue to be, they have flaws. For example, they lack structure or taxonomy, which makes consumption difficult. Search functionality is often less than stellar and users are unable to build reputations that span an appreciable period of time. For these reasons, although they’re easy to create and manage, mailing lists inherently limit access to knowledge and hence limit adoption.

The new service brings key additions to the conversation: functionality, search, structure and scalability. It is now considerably easier to ask questions, find answers (or questions to answer), follow and share threads, and create a visible and sustainable reputation in the community. And for Cloudera customers, there’s a bonus: your questions will be escalated as bonafide support cases under certain circumstances (see below).

Another way for you to participate in the Hadoop ecosystem!

BTW, the discussion taxonomy:

What is the reasoning behind your taxonomy?

We made a sincere effort to balance the requirements of simplicity and thoroughness. Of course, we’re always open to suggestions for improvements.

I don’t doubt the sincerity of the taxonomy authors. Not one bit.

But all taxonomies represent the “intuitive” view of some small group. There is no means to escape the narrow view of all taxonomies.

What we can do, at least with topic maps, is to allow groups to have their own taxonomies and to view data through those taxonomies.

Mapping between taxonomies means that addition via any of the taxonomies results in new data appearing as appropriate in other taxonomies.

Perhaps it was necessary to champion one taxonomy when information systems were fixed, printed representations of data and access systems.

But the need for a single taxonomy, if it ever existed, does not exist now. We are free to have any number of taxonomies for any data set, visible or invisible to other users/taxonomies.

More than thirty (30) years after the invention of the personal computer, we are still laboring under the traditions of printed information systems.

Isn’t it time to move on?

July 27, 2013

…Spatial Analytics with Hive and Hadoop

Filed under: Geo Analytics,Hadoop,Hive — Patrick Durusau @ 5:54 pm

How To Perform Spatial Analytics with Hive and Hadoop by Carter Shanklin.

From the post:

One of the big opportunities that Hadoop provides is the processing power to unlock value in big datasets of varying types from the ‘old’ such as web clickstream and server logs, to the new such as sensor data and geolocation data.

The explosion of smart phones in the consumer space (and smart devices of all kinds more generally) has continued to accelerate the next generation of apps such as Foursquare and Uber which depend on the processing of and insight from huge volumes of incoming data.

In the slides below we look at a sample, anonymized data set from Uber that is available on Infochimps. We step through basics of analyzing the data in Hive and learn how a new using spatial analysis decide whether a new product offering is viable or not.

Great tutorial and slides!

My only reservation is the use of geo-location data to make a judgement about the potential for a new ride service.

Geo-location data is only way to determine potential for a ride service. Surveying potential riders would be another.

Or to put it another way, having data to crunch, doesn’t mean crunching data will lead to the best answer.

July 15, 2013

The Book on Apache Sqoop is Here!

Filed under: Hadoop,Sqoop — Patrick Durusau @ 12:45 pm

The Book on Apache Sqoop is Here! by Justin Kestelyn.

From the post:

Continuing the fine tradition of Clouderans contributing books to the Apache Hadoop ecosystem, Apache Sqoop Committers/PMC Members Kathleen Ting and Jarek Jarcec Cecho have officially joined the book author community: their Apache Sqoop Cookbook is now available from O’Reilly Media (with a pelican the assigned cover beast).

The book arrives at an ideal time. Hadoop has quickly become the standard for processing and analyzing Big Data, and in order to integrate a new Hadoop deployment into your existing environment, you will very likely need to transfer data stored in legacy relational databases into your new cluster.

Sqoop is just the ticket; it optimizes data transfers between Hadoop and RDBMSs via a command-line interface listing 60 parameters. This new cookbook focuses on applying these parameters to common use cases — one recipe at a time, Kate and Jarek guide you from basic commands that don’t require prior Sqoop knowledge all the way to very advanced use cases. These recipes are sufficiently detailed not only to enable you to deploy Sqoop in your environment, but also to understand its inner workings.

Good to see a command with a decent number of options, sixty (60).

A little lite when compared to ps at one hundred and eight-six (186) options and formatting flags.

I didn’t find a quick answer to the question: Which *nix command has the most options and formatting flags?

If you have a candidate, sing out!

Combining Neo4J and Hadoop (part II)

Filed under: Graphs,Hadoop,Neo4j — Patrick Durusau @ 12:20 pm

Combining Neo4J and Hadoop (part II) by Kris Geusebroek.

From the post:

In the previous post Combining Neo4J and Hadoop (part I) we described the way we combine Hadoop and Neo4J and how we are getting the data into Neo4J.

In this second part we will take you through the journey we took to implement a distributed way to create a Neo4J database. The idea is to use our Hadoop cluster for creating the underlying file structure of a Neo4J database.

To do this we must first understand this file-structure. Luckily Chris Gioran has done a great job describing this structure in his blog Neo4J internal file storage.

The description was done for version 1.6 but largely still matches the 1.8 file-structure.

First I’ll start with a small recap of the file-structure.

The Chris Gioran post has been updated at: Rooting out redundancy – The new Neo4j Property Store.

Internal structures influence what you can or can’t easily say. Best to know about those structures in advance.

« Newer PostsOlder Posts »

Powered by WordPress