Another Word For It Patrick Durusau on Topic Maps and Semantic Diversity

November 20, 2014

Cytoscape.js != Cytoscape (desktop)

Filed under: Graphs,Javascript,Visualization — Patrick Durusau @ 11:29 am

Cytoscape.js

From the webpage:

Cytoscape.js is an open-source Cytoscape.jsgraph theory (a.k.a. network) library written in JavaScript. You can use Cytoscape.js for graph analysis and visualisation.

Cytoscape.js allows you to easily display and manipulate rich, interactive graphs. Because Cytoscape.js allows the user to interact with the graph and the library allows the client to hook into user events, Cytoscape.js is easily integrated into your app, especially since Cytoscape.js supports both desktop browsers, like Chrome, and mobile browsers, like on the iPad. Cytoscape.js includes all the gestures you would expect out-of-the-box, including pinch-to-zoom, box selection, panning, et cetera.

Cytoscape.js also has graph analysis in mind: The library contains many useful functions in graph theory. You can use Cytoscape.js headlessly on Node.js to do graph analysis in the terminal or on a web server.

Cytoscape.js is an open-source project, and anyone is free to contribute. For more information, refer to the Cytoscape.jsGitHub README.

The library was developed at the Cytoscape.jsDonnelly Centre at the University of Toronto. It is the successor of Cytoscape.jsCytoscape Web.

Cytoscape.js & Cytoscape

Though Cytoscape.js shares its name with Cytoscape, Cytoscape.js is not exactly the same as Cytoscape desktop. Cytoscape.js is a JavaScript library for programmers. It is not an app for end-users, and developers need to write code around Cytoscape.js to build graphcentric apps.

Cytoscape.js is a JavaScript library: It gives you a reusable graph widget that you can integrate with the rest of your app with your own JavaScript code. The keen members of the audience will point out that this means that Cytoscape plugins/apps — written in Java — will obviously not work in Cytoscape.js — written in JavaScript. However, Cytoscape.js supports its own ecosystem of extensions.

We are trying to make the two projects intercompatible as possible, and we do share philosophies with Cytoscape: Graph style and data should be separate, the library should provide core functionality with extensions adding functionality on top of the library, and so on.

Great demo graphs!

High marks on the documentation and its TOC. Generous use of examples.

One minor niggle on the documentation:

Note that metacharacters need to be escaped:

cy.filter('#some\\$funky\\@id');

I think the full set of metacharacters for JavaScript reads:

^ $ \ / ( ) | ? + * [ ] { } , .

Given that metacharacters vary between regex languages (unfortunately), it would be clearer to list the full set of JavaScript metacharacters and use only a few in the examples.

Thus:

Note that metacharacters ( ^ $ \ / ( ) | ? + * [ ] { } , . )need to be escaped:

cy.filter('#some\\$funky\\@id');

Overall a graph theory library that deserves your attention.

I first saw this in a tweet by Friedrich Lindenberg.


Update: I submitted a ticket on the metacharacters this morning and it was fixed shortly thereafter. Hard problems will likely take longer but definitely a responsive project!

November 15, 2014

Py2neo 2.0

Filed under: Graphs,Neo4j,py2neo,Python — Patrick Durusau @ 7:30 pm

Py2neo 2.0 by Nigel Small.

From the webpage:

Py2neo is a client library and comprehensive toolkit for working with Neo4j from within Python applications and from the command line. The core library has no external dependencies and has been carefully designed to be easy and intuitive to use.

If you are using Neo4j or Python or both, you need to be aware of Py2Neo 2.0.

Impressive documentation!

I haven’t gone through all of it but contributed examples would be helpful.

For example:

API: Cypher

exception py2neo.cypher.ClientError(message, **kwargs)

The Client sent a bad request – changing the request might yield a successful outcome.

exception py2neo.cypher.error.request.Invalid(message, **kwargs)[source]

The client provided an invalid request.

Without an example the difference between a “bad” versus an “invalid” request isn’t clear.

Writing examples would not be a bad way to work through the Py2neo 2.0 documentation.

Enjoy!

I first saw this in a tweet by Nigel Small.

November 8, 2014

Mazerunner – Update – Neo4J – GraphX

Filed under: Graphs,GraphX,Neo4j — Patrick Durusau @ 7:36 pm

Three new algorithms have been added to Mazerunner:

  • Triangle Count
  • Connected Components
  • Strongly Connected Components

From: Using Apache Spark and Neo4j for Big Data Graph Analytics

Mazerunner uses a message broker to distribute graph processing jobs to Apache Spark’s GraphX module. When an agent job is dispatched, a subgraph is exported from Neo4j and written to Apache Hadoop HDFS.

That’s good news!

I first saw this in a tweet by Kenny Bastani

November 3, 2014

neo4apis

Filed under: Graphs,Neo4j,Tweets — Patrick Durusau @ 9:09 pm

neo4apis by Brian Underwood.

From the post:

I’ve been reading a few interesting analyses of Twitter data recently such as this #gamergate analysis by Andy Baio. I thought it would be nice to have a mechanism for people to quickly and easily import data from Twitter to Neo4j for research purposes. Like a good programmer I had to go up at least one level of abstraction. Thus was born the ruby gems neo4apis and neo4apis-twitter (and, incidentally, neo4apis-github just to prove it was repeatable).

Using the neo4apis-twitter gem is easy and can be used either in your ruby code or from the command line. neo4apis takes care of loading your data efficiently as well as creating database indexes so that you can query it effectively.

In case you haven’t heard, the number of active Twitter users is estimated at 228 million. That is a lot of users but as I write this post, the world’s population passed 7,271,955,000.

Just doing rough numbers, 7,271,955,000 / 228,000,000 = 31.

So if you captured a tweet from every active twitter user, that would be 1/31 of the world’s population.

Not saying you shouldn’t capture tweets or analyze them in Neo4j. I am saying that you should be mindful of the lack of representation in such tweets.

Using Apache Spark and Neo4j for Big Data Graph Analytics

Filed under: BigData,Graphs,Hadoop,HDFS,Spark — Patrick Durusau @ 8:29 pm

Using Apache Spark and Neo4j for Big Data Graph Analytics by Kenny Bastani.

From the post:


Fast and scalable analysis of big data has become a critical competitive advantage for companies. There are open source tools like Apache Hadoop and Apache Spark that are providing opportunities for companies to solve these big data problems in a scalable way. Platforms like these have become the foundation of the big data analysis movement.

Still, where does all that data come from? Where does it go when the analysis is done?

Graph databases

I’ve been working with graph database technologies for the last few years and I have yet to become jaded by its powerful ability to combine both the transformation of data with analysis. Graph databases like Neo4j are solving problems that relational databases cannot.

Graph processing at scale from a graph database like Neo4j is a tremendously valuable power.

But if you wanted to run PageRank on a dump of Wikipedia articles in less than 2 hours on a laptop, you’d be hard pressed to be successful. More so, what if you wanted the power of a high-performance transactional database that seamlessly handled graph analysis at this scale?

Mazerunner for Neo4j

Mazerunner is a Neo4j unmanaged extension and distributed graph processing platform that extends Neo4j to do big data graph processing jobs while persisting the results back to Neo4j.

Mazerunner uses a message broker to distribute graph processing jobs to Apache Spark’s GraphX module. When an agent job is dispatched, a subgraph is exported from Neo4j and written to Apache Hadoop HDFS.

Mazerunner is an alpha release with page rank as its only algorithm.

It has a great deal of potential so worth your time to investigate further.

October 21, 2014

TinkerPop 3.0.0.M4 Released (A Gremlin Rāga in 7/16 Time)

Filed under: Graphs,Gremlin,TinkerPop — Patrick Durusau @ 4:50 pm

TinkerPop 3.0.0.M4 Released (A Gremlin Rāga in 7/16 Time) by Marko Rodriguez.

From the post:

TinkerPop (http://tinkerpop.com) is happy to announce the release of TinkerPop 3.0.0.M4.

gremlin-hindu

Documentation

User Documentation: http://www.tinkerpop.com/docs/3.0.0.M4/
Core JavaDoc: http://www.tinkerpop.com/javadocs/3.0.0.M4/core/ [user javadocs]
Full JavaDoc : http://www.tinkerpop.com/javadocs/3.0.0.M4/full/ [vendor javadocs]

Downloads

Gremlin Console: http://tinkerpop.com/downloads/3.0.0.M4/gremlin-console-3.0.0.M4.zip
Gremlin Server: http://tinkerpop.com/downloads/3.0.0.M4/gremlin-server-3.0.0.M4.zip

There were lots of updates in this release — with a lot of valuable feedback provided by Titan (Matthias), Titan-Hadoop (Dan), FoundationDB (Mike), PostgreSQL-Gremlin (Pieter), and Gremlin-Scala (Mike).

https://github.com/tinkerpop/tinkerpop3/blob/master/CHANGELOG.asciidoc

We are very close to a GA. We think that either there will be a “minor M5” or the next release will be GA. Why the delay? We are currently working closely with the Titan team to see if there are any problems in our interfaces/test-suites/etc. The benefit of working with the Titan team is that they are doing both OLTP and OLAP so are covering the full gamut of the TinkerPop3 API. Of course, we have had lots of experience with these APIs for both Neo4j (OTLP) and Giraph (OLAP), but to see it standup to yet another vendor’s requirements will be a confidence boost for GA. If you are vendor, please feel free to join the conversation as your input is crucial to making sure GA meets everyone’s needs.

A few important notes for users:
1. The GremlinKryo serialization format is not guaranteed to be stable from MX to MY. By GA it will be locked.
2. Neo4j-Gremlin’s disk representation is not guaranteed to be stable from MX to MY. By GA it will be locked.
3. Giraph-Gremlin’s Hadoop Writable specification is not guaranteed to be stable from MX to MY. By GA it will be locked.
4. VertexProgram, Memory, Step, SideEffects, etc. hidden and system labels may change between MX and MY. By GA they will be locked.
5. Package and class names might change from MX to MY. By GA they will be locked.

Thank you everyone. Please play and provide feedback. This is the time to get your ideas into TinkerPop3 as once it goes GA, sweeping changes are going to be more difficult.

October 16, 2014

GraphLab Create™ v1.0 Now Generally Available

Filed under: GraphLab,Graphs — Patrick Durusau @ 3:04 pm

GraphLab Create™ v1.0 Now Generally Available by Johnnie Konstantas.

From the post:

It is with tremendous pride in this amazing team that I am posting on the general availability of version 1.0, our flagship product. This work represents a bar being set on usability, breadth of features and productivity possible with a machine learning platform.

What’s next you ask? It’s easy to talk about all of our great plans for scale and administration but I want to give this watershed moment it’s due. Have a look at what’s new.

graphlab demo

New features available in the GraphLab Create platform include:

  • Predictive Services – Companies can build predictive applications quickly, easily, and at scale.  Predictive service deployments are scalable, fault-tolerant, and high performing, enabling easy integration with front-end applications. Trained models can be deployed on Amazon Elastic Compute Cloud (EC2) and monitored through Amazon CloudWatch. They can be queried in real-time via a RESTful API and the entire deployment pipeline is seen through a visual dashboard. The time from prototyping to production is dramatically reduced for GraphLab Create users.
  • Deep Learning – These models are ideal for automatic learning of salient features, without human supervision, from data such as images. Combined with GraphLab Create image analysis tools, the Deep Learning package enables accurate and in-depth understanding of images and videos. The GraphLab Create image analysis package makes quick work of importing and preprocessing millions of images as well as numeric data. It is built on the latest architectures including Convolution Layer, Max, Sum, Average Pooling and Dropout. The available API allows for extensibility in building user custom neural networks. Applications include image classification, object detection and image similarity.
  • Boosted Trees – With this feature, GraphLab adds support for this popular class of algorithms for robust and accurate regression and classification tasks.  With an out-of-core implementation, Boosted Trees in GraphLab Create can easily scale up to large datasets that do not fit into memory.

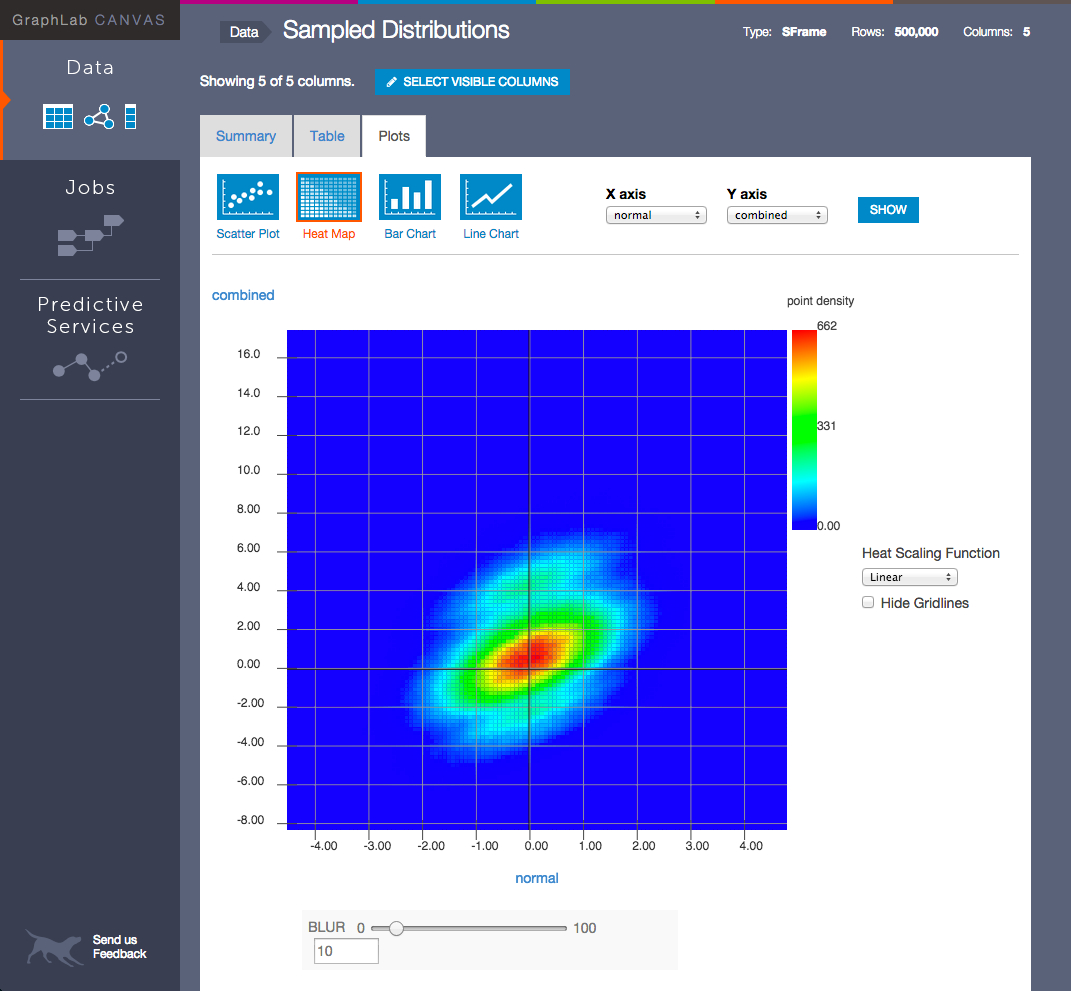
  • Visualization – New dashboards allow users to visualize the status and health of offline jobs deployed in various environments including local, Hadoop Clusters and EC2.  Also part of GraphLab Canvas is the visualization of GraphLab SFrames and SGraphs, enabling users to explore tables, graphs, text and images, in a single interactive environment making feature engineering more efficient.

…(and more)

Rather than downloading the software, go to GraphLab Create™ Quick Start to generate a product key. After you generate a product key (displayed on webpage), GraphLab offers command line code to set you up for installing GraphLab via pip. Quick and easy on Ubuntu 12.04.

Next stop: The Five-Line Recommender, Explained by Alice Zheng. 😉

Enjoy!

October 15, 2014

Inductive Graph Representations in Idris

Filed under: Functional Programming,Graphs,Types — Patrick Durusau @ 8:54 am

Inductive Graph Representations in Idris by Michael R. Bernstein.

An early exploration on Inductive Graphs and Functional Graph Algorithms by Martin Erwig.

Abstract (of Erwig’s paper):

We propose a new style of writing graph algorithms in functional languages which is based on an alternative view of graphs as inductively defined data types. We show how this graph model can be implemented efficiently and then we demonstrate how graph algorithms can be succinctly given by recursive function definitions based on the inductive graph view. We also regard this as a contribution to the teaching of algorithms and data structures in functional languages since we can use the functional-graph algorithms instead of the imperative algorithms that are dominant today.

You can follow Michael at: @mrb_bk or https://github.com/mrb or his blog: http://michaelrbernste.in/.

More details on Idris: A Language With Dependent Types.

October 14, 2014

RNeo4j: Neo4j graph database combined with R statistical programming language

Filed under: Graphs,Neo4j,R — Patrick Durusau @ 2:46 pm

From the description:

RNeo4j combines the power of a Neo4j graph database with the R statistical programming language to easily build predictive models based on connected data. From calculating the probability of friends of friends connections to plotting an adjacency heat map based on graph analytics, the RNeo4j package allows for easy interaction with a Neo4j graph database.

Nicole is the author of the RNeo4j R package. Don’t be dismayed by the “What is a Graph” and “What is R” in the presentation outline. Mercifully only three minutes followed by a rocking live coding demonstration of the package!

Beyond Neo4j and R, use this webinar as a standard for the useful content that should appear in a webinar!

RNeo4j at Github.

October 10, 2014

Flexible Neo4j Batch Import with Groovy

Filed under: Graphs,Neo4j — Patrick Durusau @ 4:03 pm

Flexible Neo4j Batch Import with Groovy by Michael Hunger.

From the post:

You might have data as CSV files to create nodes and relationships from in your Neo4j Graph Database.
It might be a lot of data, like many tens of million lines.
Too much for LOAD CSV to handle transactionally.

Usually you can just fire up my batch-importer and prepare node and relationship files that adhere to its input format requirements.

Your Requirements

There are some things you probably want to do differently than the batch-importer does by default:

  • not create legacy indexes
  • not index properties at all that you just need for connecting data
  • create schema indexes
  • skip certain columns
  • rename properties from the column names
  • create your own labels based on the data in the row
  • convert column values into Neo4j types (e.g. split strings or parse JSON)

Michael helps you avoid the defaults of batch importing into Neo4j.

October 8, 2014

A look at Cayley

Filed under: Cayley,Graphs,Neo4j — Patrick Durusau @ 4:15 pm

A look at Cayley by Tony.

From the post:

Recently I took the time to check out Cayley, a graph database written in Go that’s been getting some good attention.

cayley

https://github.com/google/cayley

A great introduction to Cayley. Tony has some comparisons to Neo4j, but for beginners with graph databases, those comparisons may not be real useful. Come back for those comparisons once you have moved beyond example graphs.

September 30, 2014

Neo4j: Generic/Vague relationship names

Filed under: Graphs,Neo4j — Patrick Durusau @ 7:21 pm

Neo4j: Generic/Vague relationship names by Mark Needham.

From the post:

An approach to modelling that I often see while working with Neo4j users is creating very generic relationships (e.g. HAS, CONTAINS, IS) and filtering on a relationship property or on a property/label at the end node.

Intuitively this doesn’t seem to make best use of the graph model as it means that you have to evaluate many relationships and nodes that you’re not interested in whereas if you use a more specific relationship type that isn’t the case.

However, I’ve never actually tested the performance differences between the approaches so I thought I’d try it out.

I created 4 different databases which had one node with 60,000 outgoing relationships – 10,000 which we wanted to retrieve and 50,000 that were irrelevant.

I modelled the ‘relationship’ in 4 different ways…

  • Filter by relationship type
    (node)-[:HAS_ADDRESS]->(address)
  • Filter by end node label
    (node)-[:HAS]->(address:Address)
  • Filter by relationship property
    (node)-[:HAS {type: “address”}]->(address)
  • Filter by end node
    (node)-[:HAS]->(address {type: “address”})

…and then measured how long it took to retrieve the ‘has address’ relationships.

See Mark’s post for the test results but the punch line is the less filtering required, the faster the result.

Designing data structures for eventual queries seems sub-optimal to me.

You?

Neo4j 2.1.5

Filed under: Graphs,Neo4j — Patrick Durusau @ 4:11 pm

Neo4j 2.1.5

From the post:

Neo4j 2.1.5 is a maintenance release, with critical improvements.

Notably, this release addresses the following:

  • Corrects a Cypher compiler error introduced only in Neo4j 2.1.4, which caused Cypher queries containing nested maps to fail type checking.
  • Resolves a critical error, where discrete remove+add operations on properties could result in a new property being added, without the old property being correctly removed.
  • Corrects an issue causing significantly degraded write performance in larger transactions.
  • Improves memory use in Cypher queries containing OPTIONAL MATCH.
  • Resolves an issue causing failed index lookups for some newly created integer properties.
  • Fixes an issue which could cause excessive store growth in some clustered environments (Neo4j Enterprise).
  • Adds additional metadata (label and ID) to node and relationship representations in JSON responses from the REST API.
  • Resolves an issue with extraneous remove commands being added to the legacy auto-index transaction log.
  • Resolves an issue preventing the lowest ID cluster member from successfully leaving and rejoining the cluster, in cases where it was not the master (Neo4j Enterprise).

All Neo4j 2.x users are recommended to upgrade to this release. Upgrading to Neo4j 2.1 requires a migration to the on-disk store and can not be reversed. Please ensure you have a valid backup before proceeding, then use on a test or staging server to understand any changed behaviors before going into production.

Neo4j 1.9 users may upgrade directly to this release, and are recommended to do so carefully. We strongly encourage verifying the syntax and validating all responses from your Cypher scripts, REST calls, and Java code before upgrading any production system. For information about upgrading from Neo4j 1.9, please see our Upgrading to Neo4j 2 FAQ.

Do you remember which software company had the “We are holding the gun but you decide whether to pull the trigger” type upgrade warning? There are so many legendary upgrade stories that it is hard to remember them all. Is there a collection of upgrade warnings and/or stories on the Net? Thanks!

BTW, if you are running Neo4j 2.x upgrade. No comment on Neo4j 1.9.

September 15, 2014

GraphX: Graph Processing in a Distributed Dataflow Framework

Filed under: Distributed Computing,Graphs,GraphX — Patrick Durusau @ 7:25 pm

GraphX: Graph Processing in a Distributed Dataflow Framework by Joseph Gonzalez, Reynold Xin, Ankur Dave, Dan Crankshaw, Michael Franklin, Ion Stoica.

Abstract:

In pursuit of graph processing performance, the systems community has largely abandoned general-purpose distributed dataflow frameworks in favor of specialized graph processing systems that provide tailored programming abstractions and accelerate the execution of iterative graph algorithms. In this paper we argue that many of the advantages of specialized graph processing systems can be recovered in a modern general-purpose distributed dataflow system. We introduce GraphX, an embedded graph processing framework built on top of Apache Spark, a widely used distributed dataflow system. GraphX presents a familiar composable graph abstraction that is sufficient to express existing graph APIs, yet can be implemented using only a few basic dataflow operators (e.g., join, map, group-by). To achieve performance parity with specialized graph systems, GraphX recasts graph-specific optimizations as distributed join optimizations and materialized view maintenance. By leveraging advances in distributed dataflow frameworks, GraphX brings low-cost fault tolerance to graph processing. We evaluate GraphX on real workloads and demonstrate that GraphX achieves an order of magnitude performance gain over the base dataflow framework and matches the performance of specialized graph processing systems while enabling a wider range of computation.

GraphX: Graph Processing in a Distributed Dataflow Framework (as PDF file)

The “other” systems for comparison were GraphLab and Giraph. Those systems were tuned in cooperation with experts in their use. These are some of the “fairest” benchmarks you are likely to see this year. Quite different from “shiny graph engine” versus lame or misconfigured system benchmarks.

Definitely the slow-read paper for this week!

I first saw this in a tweet by Arnon Rotem-Gal-Oz.

September 10, 2014

TinkerPop3 M2 Delay for MetaProperties

Filed under: Graphs,TinkerPop — Patrick Durusau @ 4:11 pm

TinkerPop3 M2 Delay for MetaProperties by Marko A. Rodreiguez.

From the post:

TinkerPop3 3.0.0.M2 was suppose to be released 1.5 weeks ago. We have delayed the release because we have now introduced MetaProperties into TinkerPop3. Matthias Bröcheler of Titan-fame has been pushing TinkerPop to provide this feature for over a year now. We had numerous discussions about it over the past year, and at one point, rejected the feature request. However, recently, a solid design proposal was presented by Matthias and Stephen and I went about implementing it over the last 1.5 weeks. With that said, TinkerPop3 now has MetaProperties.

What are meta-properties?

  1. Edges have Properties
  2. Vertices have MetaProperties
  3. MetaProperties have Properties

What are the consequences of meta-properties?

  1. A vertex can have multiple “name” properties (for example).
  2. A vertex’s properties (i.e. meta-properties) can have normal key/value properties (e.g. a “name” property can have an “acl:public” property).

What are the use cases?

  1. Provenance: different users have different declarations for Marko’s name: “marko”, “marko rodriguez,” “marko a. rodriguez.”
  2. Security: you can now do property-level security. Marko’s “age” has an acl:private property and his “name”(s) have acl:public properties.
  3. History: who mutated what and when did they do it? each vertex property can have a “creator:stephen” and a “createdAt:2014” property.

If you have ever had to build a graph application that required provenance, security, history, and the like, you realized how difficult it is with the current key/value property graph model. You end up, in essence, creating vertices for properties so you can express such higher order semantics. However, maintaing that becomes a nightmare as tools like Gremlin and GraphWrappers don’t know the semantics and you basically are left to create your own GremlinDSL-extensions and tools to process such a custom representation. Well now, you get it for free and TinkerPop will be able to provide (in the future) wrappers (called strategies in TP3) for provenance, security, history, etc.

I don’t grok the reason for a distinction between properties of vertices and properties of edges so I have posted a note asking about it.

Take the quoted portion as a sample of the quality of work being done on TinkerPop3.

September 8, 2014

Visualizing Website Pathing With Network Graphs

Filed under: Graphs,Networks,R,Visualization — Patrick Durusau @ 6:54 pm

Visualizing Website Pathing With Network Graphs by Randy Zwitch.

From the post:

Last week, version 1.4 of RSiteCatalyst was released, and now it’s possible to get site pathing information directly within R. Now, it’s easy to create impressive looking network graphs from your Adobe Analytics data using RSiteCatalyst and d3Network. In this blog post, I will cover simple and force-directed network graphs, which show the pairwise representation between pages. In a follow-up blog post, I will show how to visualize longer paths using Sankey diagrams, also from the d3Network package.

Great technical details and examples but also worth the read for:

I’m not going to lie, all three of these diagrams are hard to interpret. Like wordclouds, network graphs can often be visually interesting, yet difficult to ascertain any concrete information. Network graphs also have the tendency to reinforce what you already know (you or someone you know designed your website, you should already have a feel for its structure!).

Randy does spot some patterns but working out what those patterns “mean” remain for further investigation.

Hairball graph visualizations can be a starting point for the hard work that extracts actionable intelligence.

August 31, 2014

An Introduction to Graphical Models

Filed under: Graphical Models,Graphs,Probability,Probalistic Models — Patrick Durusau @ 2:08 pm

An Introduction to Graphical Models by Michael I. Jordan.

A bit dated (1997), slides, although “wordy” ones, that introduce you to graphical models.

Makes a nice outline to check your knowledge of graphical models.

I first saw this in a tweet by Data Tau.

August 28, 2014

…Deep Learning Text Classification

Filed under: Deep Learning,Graphs,Neo4j — Patrick Durusau @ 4:20 pm

Using a Graph Database for Deep Learning Text Classification by Kenny Bastani.

From the post:

Graphify is a Neo4j unmanaged extension that provides plug and play natural language text classification.

Graphify gives you a mechanism to train natural language parsing models that extract features of a text using deep learning. When training a model to recognize the meaning of a text, you can send an article of text with a provided set of labels that describe the nature of the text. Over time the natural language parsing model in Neo4j will grow to identify those features that optimally disambiguate a text to a set of classes.

Similarity and graphs. What’s there to not like?

August 16, 2014

Titan 0.5 Released!

Filed under: Graphs,Titan — Patrick Durusau @ 7:30 pm

Titan 0.5 Released!

From the Titan documentation:

1.1. General Titan Benefits

  • Support for very large graphs. Titan graphs scale with the number of machines in the cluster.
  • Support for very many concurrent transactions and operational graph processing. Titan’s transactional capacity scales with the number of machines in the cluster and answers complex traversal queries on huge graphs in milliseconds.
  • Support for global graph analytics and batch graph processing through the Hadoop framework.
  • Support for geo, numeric range, and full text search for vertices and edges on very large graphs.
  • Native support for the popular property graph data model exposed by Blueprints.
  • Native support for the graph traversal language Gremlin.
  • Easy integration with the Rexster graph server for programming language agnostic connectivity.
  • Numerous graph-level configurations provide knobs for tuning performance.
  • Vertex-centric indices provide vertex-level querying to alleviate issues with the infamous super node problem.
  • Provides an optimized disk representation to allow for efficient use of storage and speed of access.
  • Open source under the liberal Apache 2 license.

A major milestone in the development of Titan!

If you are interested in serious graph processing, Titan is one of the systems that should be on your short list.

PS: Matthias Broecheler has posted Titan 0.5.0 GA Release, which has links to upgrade instructions and comments about a future Titan 1.0 release!

August 11, 2014

Multiobjective Search

Filed under: Blueprints,Graphs,TinkerPop — Patrick Durusau @ 3:29 pm

Multiobjective Search with Hipster and TinkerPop Blueprints

From the webpage:

This advanced example explains how to perform a general multiobjective search with Hipster over a property graph using the TinkerPop Blueprints API. In a multiobjective problem, instead of optimizing just a single objective function, there are many objective functions that can conflict each other. The goal then is to find all possible solutions that are nondominated, i.e., there is no other feasible solution better than the current one in some objective function without worsening some of the other objective functions.

If you don’t know Hipster:

The aim of Hipster is to provide an easy to use yet powerful and flexible type-safe Java library for heuristic search. Hipster relies on a flexible model with generic operators that allow you to reuse and change the behavior of the algorithms very easily. Algorithms are also implemented in an iterative way, avoiding recursion. This has many benefits: full control over the search, access to the internals at runtime or a better and clear scale-out for large search spaces using the heap memory.

You can use Hipster to solve from simple graph search problems to more advanced state-space search problems where the state space is complex and weights are not just double values but custom defined costs.

I can’t help but hear “multiobjective search” in the the context of a document search where documents may or may not match multiple terms in a search request.

But that hearing is wrong because a graph can be more granular than a document and possess multiple ways to satisfy a particular objective. My intuition is that documents satisfy search requests only in a binary sense, yes or not. Yes?

Good way to get involved with Tinkerpop Blueprints.

August 9, 2014

400 GTEPS on 4096 GPUs

Filed under: Distributed Systems,GPU,Graphs — Patrick Durusau @ 7:14 pm

Breadth-First Graph Search Uses 2D Domain Decomposition – 400 GTEPS on 4096 GPUs by Rob Farber.

From the post:

Parallel Breadth-First Search is a standard benchmark and the basis of many other graph algorithms. The challenge li[]es in partitioning the graph across multiple nodes in a cluster while avoiding load-imbalance and communications delays. The authors of the paper, “Parallel Breadth First Search on the Kepler Architecture” utilize an interesting 2D decomposition of the graph adjacency matrix. Tests on R-MAT graphs shows large graph performance ranging from 1.1 GTEP on a single K20 to 396 GTEP using 4096 GPUs. The tests also compared performance against the method of Beamer (10 GTEP single SMP device and 240 GTEP on 115k cores).

See Rob’s post for background on the distributed DFS problem and additional references.

Graph processing continues to improve at an impressive rate but I wonder how applicable some techniques are to intersections of graphs?

The optimization of using a bitmap to mark vertices visited (Scalable Graph Exploration on Multicore Processors, Agarwal, et al., 2010), cited by authors of Parallel Distributed Breadth First Search on the Kepler Architecture saying:

Then, to reduce the work, we used an integer map to keep track of visited vertices. Agarwal et al., first introduced this optimization using a bitmap that has been used in almost all subsequent works.

appears to be stumbling block to tracking a vertex that appears in intersecting graphs.

Or would you track visited vertices in each intersecting graph separately? And communicate results from each intersecting graph?

August 2, 2014

MapGraph:… [3 billion Traversed Edges Per Second (TEPS) on a GPU]

Filed under: GPU,Graphs,Parallel Programming — Patrick Durusau @ 6:58 pm

MapGraph: A High Level API for Fast Development of High Performance Graph Analytics on GPUs by Zhisong Fu, Michael Personick, and Bryan Thompson.

Abstract:

High performance graph analytics are critical for a long list of application domains. In recent years, the rapid advancement of many-core processors, in particular graphical processing units (GPUs), has sparked a broad interest in developing high performance parallel graph programs on these architectures. However, the SIMT architecture used in GPUs places particular constraints on both the design and implementation of the algorithms and data structures, making the development of such programs difficult and time-consuming.

We present MapGraph, a high performance parallel graph programming framework that delivers up to 3 billion Traversed Edges Per Second (TEPS) on a GPU. MapGraph provides a high-level abstraction that makes it easy to write graph programs and obtain good parallel speedups on GPUs. To deliver high performance, MapGraph dynamically chooses among different scheduling strategies depending on the size of the frontier and the size of the adjacency lists for the vertices in the frontier. In addition, a Structure Of Arrays (SOA) pattern is used to ensure coalesced memory access. Our experiments show that, for many graph analytics algorithms, an implementation, with our abstraction, is up to two orders of magnitude faster than a parallel CPU implementation and is comparable to state-of-the-art, manually optimized GPU implementations. In addition, with our abstraction, new graph analytics can be developed with relatively little effort.

Those of us who remember Bryan Thompson from the early days of topic maps are not surprised to see his name on a paper with phrases like: “…delivers up to 3 billion Traversed Edges Per Second (TEPS) on a GPU,” and “…is up to two orders of magnitude faster than a parallel CPU implementation….”

Heavy sledding but definitely worth the effort.

Oh, btw, did I mention this is an open source project? http://sourceforge.net/projects/mpgraph/

I first saw this in MapGraph: speeding up graph processing with GPUs by Danny Bickson.

August 1, 2014

OpenGM

Filed under: C/C++,Graphs — Patrick Durusau @ 4:37 pm

OpenGM

From the webpage:

OpenGM is a C++ template library for discrete factor graph models and distributive operations on these models. It includes state-of-the-art optimization and inference algorithms beyond message passing. OpenGM handles large models efficiently, since (i) functions that occur repeatedly need to be stored only once and (ii) when functions require different parametric or non-parametric encodings, multiple encodings can be used alongside each other, in the same model, using included and custom C++ code. No restrictions are imposed on the factor graph or the operations of the model. OpenGM is modular and extendible. Elementary data types can be chosen to maximize efficiency. The graphical model data structure, inference algorithms and different encodings of functions inter-operate through well-defined interfaces. The binary OpenGM file format is based on the HDF5 standard and incorporates user extensions automatically.

Documentation lists algorithms with references.

I first saw this in a post by Danny Bickson, OpenGM graphical models toolkit.

GraphLab Conference 2014 (Videos!)

Filed under: GraphLab,Graphs,Machine Learning — Patrick Durusau @ 1:45 pm

GraphLab Conference 2014 (Videos!)

Videos from the GraphLab Conference 2014 have been posted! Who needs to wait for a new season of Endeavor? 😉

(I included the duration times so you can squeeze these in between conference calls.)

Presentations, ordered by author’s last name.

Training Sessions on GraphLab Create

I first saw this in a tweet by xamat.

July 30, 2014

Graphs, Databases and Graphlab

Filed under: GraphLab,Graphs,IMDb,Python — Patrick Durusau @ 2:40 pm

Graphs, Databases and Graphlab by Bugra Akyildiz.

From the post:

I will talk about graphs, graph databases and mainly the paper that powers Graphlab. At the end of the post, I will go over briefly basic capabilities of Graphlab as well.

Background coverage of graphs and graphdatabases, followed by a discussion of GraphLab.

The high point of the post are graphs generated from prior work by Bugra on the Internet Movie Database. (IMDB Top 100K Movies Analysis in Depth (Parts 1- 4))

Enjoy!

July 29, 2014

MusicGraph

Filed under: Graphs,Music,Titan — Patrick Durusau @ 3:31 pm

Senzari Unveils MusicGraph.ai At The GraphLab Conference 2014

From the post:

Senzari introduced MusicGraph.ai, the first web-based graph analytics and intelligence engine for the music industry at the GraphLab Conference 2014, the annual gathering of leading data scientists and machine learning experts. MusicGraph.ai will serve as the primary dashboard for MusicGraph, where API clients will be able to view detailed reports on their API usage and manage their account. More importantly, through this dashboard, they will also be able to access a comprehensive library of algorithms to extract even more value from the world’s most extensive repository of music data.

“We believe MusicGraph.ai will forever change the music intelligence industry, as it allows scientists to execute powerful analytics and machine learning algorithms at scale on a huge data-set without the need to write a single-line of code”

Free access to MusicGraph at: http://developer.musicgraph.com

I originally encountered MusicGraph because of its use of the Titan graph database. BTW, GraphLab and GraphX are also available for data analytics.

From the MusicGraph website:

MusicGraph is the world’s first “natural graph” for music, which represents the real-world structure of the musical universe. Information contained within it includes data related to the relationship between millions of artists, albums, and songs. Also included is detailed acoustical and lyrical features, as well as real-time statistics across artists and their music across many sources.

MusicGraph has over 600 million vertices and 1 billion edges, but more importantly it has over 7 billion properties, which allows for deep knowledge extraction through various machine learning approaches.

Sigh, why can’t people say: “…it represents a useful view of the musical universe…,” instead of “…which represents the real-world structure of the musical universe”? All representations are views of some observer. (full stop) If you think otherwise, please return your college and graduate degrees for a refund.

Yes, I know political leaders use “real world” all the time. But they are trying to deceive you into accepting their view as beyond question because it represents the “real world.” Don’t be deceived. Their views are no “real world” based than yours are. Which is to say, not at all. Defend your view but knowing it is a view.

I first saw this in a tweet by Gregory Piatetsky.

July 28, 2014

A Survey of Graph Theory and Applications in Neo4J

Filed under: Graphs,Neo4j — Patrick Durusau @ 7:35 pm

A Survey of Graph Theory and Applications in Neo4J by Geoff Moes.

A great summary of resources on graph theory along with a two part presentation on the same.

Geoff mentions: Graph Theory, 1736-1936 by Norman L. Biggs, E. Keith Lloyd, and Robin J. Wilson, putting to rest any notion that graphs are a recent invention.

Enjoy!

July 26, 2014

Stanford Large Network Dataset Collection

Filed under: Data,Graphs,Networks — Patrick Durusau @ 8:27 pm

Stanford Large Network Dataset Collection by Jure Leskovec.

From the webpage:

SNAP networks are also availalbe from UF Sparse Matrix collection. Visualizations of SNAP networks by Tim Davis.

If you need software to go with these datasets, consider Stanford Network Analysis Platform (SNAP)

Stanford Network Analysis Platform (SNAP) is a general purpose, high performance system for analysis and manipulation of large networks. Graphs consists of nodes and directed/undirected/multiple edges between the graph nodes. Networks are graphs with data on nodes and/or edges of the network.

The core SNAP library is written in C++ and optimized for maximum performance and compact graph representation. It easily scales to massive networks with hundreds of millions of nodes, and billions of edges. It efficiently manipulates large graphs, calculates structural properties, generates regular and random graphs, and supports attributes on nodes and edges. Besides scalability to large graphs, an additional strength of SNAP is that nodes, edges and attributes in a graph or a network can be changed dynamically during the computation.

A Python interface is available for SNAP.

I first saw this at: Stanford Releases Large Network Datasets by Ryan Swanstrom.

July 25, 2014

Neo4j Index Confusion

Filed under: Graphs,Indexing,Neo4j — Patrick Durusau @ 1:34 pm

Neo4j Index Confusion by Nigel Small.

From the post:

Since the release of Neo4j 2.0 and the introduction of schema indexes, I have had to answer an increasing number of questions arising from confusion between the two types of index now available: schema indexes and legacy indexes. For clarification, these are two completely different concepts and are not interchangable or compatible in any way. It is important, therefore, to make sure you know which you are using.
….

Nigel forgets to mention that legacy indexes were based on Lucene, schema indexes, not.

If you are interested in the technical details of the schema indexes, start with On Creating a MapDB Schema Index Provider for Neo4j 2.0 by Michael Hunger.

Michael says in his tests that the new indexing solution is faster than Lucene. Or more accurately, faster than Lucene as used in prior Neo4j versions.

How simple are your indexing needs?

July 23, 2014

Choke-Point based Benchmark Design

Filed under: Benchmarks,Graphs,Linked Data — Patrick Durusau @ 7:05 pm

Choke-Point based Benchmark Design by Peter Boncz.

From the post:

The Linked Data Benchmark Council (LDBC) mission is to design and maintain benchmarks for graph data management systems, and establish and enforce standards in running these benchmarks, and publish and arbitrate around the official benchmark results. The council and its ldbcouncil.org website just launched, and in its first 1.5 year of existence, most effort at LDBC has gone into investigating the needs of the field through interaction with the LDBC Technical User Community (next TUC meeting will be on October 5 in Athens) and indeed in designing benchmarks.

So, what makes a good benchmark design? Many talented people have paved our way in addressing this question and for relational database systems specifically the benchmarks produced by TPC have been very helpful in maturing relational database technology, and making it successful. Good benchmarks are relevant and representative (address important challenges encountered in practice), understandable , economical (implementable on simple hardware), fair (such as not to favor a particular product or approach), scalable, accepted by the community and public (e.g. all of its software is available in open source). This list stems from Jim Gray’s Benchmark Handbook. In this blogpost, I will share some thoughts on each of these aspects of good benchmark design.

Just in case you want to start preparing for the Athens meeting:

The Social Network Benchmark 0.1 draft and supplemental materials.

The Semantic Publishing Benchmark 0.1 draft and supplemental materials.

Take the opportunity to download the benchmark materials edited by Jim Gray. Will be useful in evaluating the benchmarks of the LDBC.

« Newer PostsOlder Posts »

Powered by WordPress