Another Word For It Patrick Durusau on Topic Maps and Semantic Diversity

January 25, 2016

Amazon Top 20 Books in Data Mining – 18? Low Quality Listicle?

Filed under: Books,Data Mining — Patrick Durusau @ 5:19 pm

Amazon Top 20 Books in Data Mining by Matthew Mayo.

Matthew’s bio says:

Bio: Matthew Mayo is a computer science graduate student currently working on his thesis parallelizing machine learning algorithms. He is also a student of data mining, a data enthusiast, and an aspiring machine learning scientist.

So, puzzle me this:

  • Why does this listicle have “Data Science From Scratch: First Principles with Python” by Joel Grus, listed twice?
  • Why does David Pogue’s “iPhone: The Missing Manual” appear in this list?

“Data Science From Scratch: First Principles with Python” appears twice because one is paperback and the other is Kindle. Amazon treats those as separate subjects for sales purposes, although to a reader they are more likely a single subject, which has several formats.

The appearance of “iPhone: The Missing Manual” in this listing is a category error.

If you want to generate unproofed listicles of bestsellers, start with the Amazon best http://www.amazon.com/Best-Sellers-Books-Computers-Technology/zgbs/books/5/ref=zg_bs_unv_b_2_549646_1seller link for computer science or choose one of its many sub-categories such as data mining.

The measure of a listicle isn’t how easy it was to generate but how useful it is to the targeted community.

Duplication and irrelevant results detract from the usefulness of a listicle.

Yes?

December 30, 2015

Playboy Exposed [Complete Archive]

Filed under: Data Mining,Humor,Statistics — Patrick Durusau @ 2:04 pm

Playboy Exposed by Univision’s Data Visualization Unit.

From the post:

The first time Pamela Anderson got naked for a Playboy cover, with a straw hat covering her inner thighs, she was barely 22 years old. It was 1989 and the magazine was starting to favor displaying young blondes on its covers.

On Friday, December 11, 2015, a quarter century later, the popular American model, now 48, graced the historical last nude edition of the magazine, which lost the battle for undress and decided to cover up its women in order to survive.

Univision Noticias analyzed all the covers published in the US, starting with Playboy’s first issue in December 1953, to study the cover models’ physical attributes: hair and skin color, height, age and body measurements. With these statistics, a model of the prototype woman for each decade emerged. It can be viewed in this interactive special.

I’ve heard people say they bought Playboy magazine for the short stories but this is my first time to hear of someone just looking at the covers. 😉

The possibilities for analysis of Playboy and its contents are nearly endless.

Consider the history of “party jokes” or “Playboy Advisor,” not to mention the cartoons in every issue.

I did check the Playboy Store but wasn’t about to find a DVD set with all the issues.

You can subscribe to Playboy Archive for $8.00 a month and access every issue from the first issue to the current one.

I don’t have a subscription so I not sure how you would do the OCR to capture the jokes.

December 29, 2015

Great R packages for data import, wrangling & visualization [+ XQuery]

Filed under: Data Mining,R,Visualization,XQuery — Patrick Durusau @ 5:37 pm

Great R packages for data import, wrangling & visualization by Sharon Machlis.

From the post:

One of the great things about R is the thousands of packages users have written to solve specific problems in various disciplines — analyzing everything from weather or financial data to the human genome — not to mention analyzing computer security-breach data.

Some tasks are common to almost all users, though, regardless of subject area: data import, data wrangling and data visualization. The table below show my favorite go-to packages for one of these three tasks (plus a few miscellaneous ones tossed in). The package names in the table are clickable if you want more information. To find out more about a package once you’ve installed it, type help(package = "packagename") in your R console (of course substituting the actual package name ).

Forty-seven (47) “favorites” sounds a bit on the high side but some people have more than one “favorite” ice cream, or obsession. 😉

You know how I feel about sort-order and I could not detect an obvious one in Sharon’s listing.

So, I extracted the package links/name plus the short description into a new table:

car data wrangling
choroplethr mapping
data.table data wrangling, data analysis
devtools package development, package installation
downloader data acquisition
dplyr data wrangling, data analysis
DT data display
dygraphs data visualization
editR data display
fitbitScraper misc
foreach data wrangling
ggplot2 data visualization
gmodels data wrangling, data analysis
googlesheets data import, data export
googleVis data visualization
installr misc
jsonlite data import, data wrangling
knitr data display
leaflet mapping
listviewer data display, data wrangling
lubridate data wrangling
metricsgraphics data visualization
openxlsx misc
plotly data visualization
plyr data wrangling
psych data analysis
quantmod data import, data visualization, data analysis
rcdimple data visualization
RColorBrewer data visualization
readr data import
readxl data import
reshape2 data wrangling
rga Web analytics
rio data import, data export
RMySQL data import
roxygen2 package development
RSiteCatalyst Web analytics
rvest data import, web scraping
scales data wrangling
shiny data visualization
sqldf data wrangling, data analysis
stringr data wrangling
tidyr data wrangling
tmap mapping
XML data import, data wrangling
zoo data wrangling, data analysis

Enjoy!


I want to use XQuery at least once a day in 2016 on my blog. To keep myself honest, I will be posting any XQuery I use.

To sort and extract two of the columns from Mary’s table, I copied the table to a separate file and ran this XQuery:

  1. xquery version “1.0”;
  2. <html>
  3. <table>{
  4. for $row in doc(“/home/patrick/working/favorite-R-packages.xml”)/table/tr
  5. order by lower-case(string($row/td[1]/a))
  6. return <tr>{$row/td[1]} {$row/td[2]}</tr>
  7. }</table>
  8. </html>

One of the nifty aspects of XQuery is that you can sort, as on line 5, in all lower-case on the first <td> element, while returning the same element as written in the original table. Which gives better (IMHO) sort order than UPPERCASE followed by lowercase.

This same technique should make you the master of any simple tables you encounter on the web.

PS: You should always acknowledge the source of your data and the original author.

I first saw Sharon’s list in a tweet by Christophe Lalanne.

December 12, 2015

Data scientists: Question the integrity of your data [Relevance/Fitness – Not “Integrity”]

Filed under: Data Mining,Modeling — Patrick Durusau @ 3:19 pm

Data scientists: Question the integrity of your data by Rebecca Merrett.

From the post:

If there’s one lesson website traffic data can teach you, it’s that information is not always genuine. Yet, companies still base major decisions on this type of data without questioning its integrity.

At ADMA’s Advancing Analytics in Sydney this week, Claudia Perlich, chief scientist of Dstillery, a marketing technology company, spoke about the importance of filtering out noisy or artificial data that can skew an analysis.

“Big data is killing your metrics,” she said, pointing to the large portion of bot traffic on websites.

“If the metrics are not really well aligned with what you are truly interested in, they can find you a lot of clicking and a lot of homepage visits, but these are not the people who will buy the product afterwards because they saw the ad.”

Predictive models that look at which users go to some brands’ home pages, for example, are open to being completely flawed if data integrity is not called into question, she said.

“It turns out it is much easier to predict bots than real people. People write apps that skim advertising, so a model can very quickly pick up what that traffic pattern of bots was; it can predict very, very well who would go to these brands’ homepages as long as there was bot traffic there.”

The predictive model in this case will deliver accurate results when testing its predictions. However, that doesn’t bring marketers or the business closer to reaching its objective of real human ad conversions, Perlich said.

The on-line Merriam-Webster’s defined “integrity” as:

  1. firm adherence to a code of especially moral or artistic values : incorruptibility
  2. an unimpaired condition : soundness
  3. the quality or state of being complete or undivided : completeness

None of those definitions of “integrity” apply to the data Perlich describes.

What Perlich criticizes is measuring data with no relationship to the goal of the analysis, “…human ad conversions.”

That’s not “integrity” of data. Perhaps appropriate/fitness for use or relevance but not “integrity.”

Avoid vague and moralizing terminology when discussing data and data science.

Discussions of ethics are difficult enough without introducing confusion with unrelated issues.

I first saw this in a tweet by Data Science Renee.

November 30, 2015

Connecting Roll Call Votes to Members of Congress (XQuery)

Filed under: Data Mining,Government,Government Data,XQuery — Patrick Durusau @ 10:29 pm

Apologies for the lack of posting today but I have been trying to connect up roll call votes in the House of Representatives to additional information on members of Congress.

In case you didn’t know, roll call votes are reported in XML and have this form:

<recorded-vote><legislator name-id="A000374" sort-field="Abraham" 
unaccented-name="Abraham" party="R" state="LA"
role="legislator">Abraham</legislator><
vote>Aye</vote></recorded-vote>
<recorded-vote><legislator name-id="A000370" sort-field="Adams" 
unaccented-name="Adams" party="D" state="NC" 
role="legislator">Adams</legislator
><vote>No</vote></recorded-vote>
<recorded-vote><legislator name-id="A000055" sort-field="Aderholt" 
unaccented-name="Aderholt" party="R" state="AL" 
role="legislator">Aderholt</legislator>
<vote>Aye</vote></recorded-vote>
<recorded-vote><legislator name-id="A000371" sort-field="Aguilar" 
unaccented-name="Aguilar" party="D" state="CA"
role="legislator">Aguilar</legislator><
vote>Aye</vote></recorded-vote>
...

For a full example: http://clerk.house.gov/evs/2015/roll643.xml

With the name-id attribute value, I can automatically construct URIs to the Biographical Directory of the United States Congress, for example, the entry on Abraham, Ralph.

More information than a poke with a sharp stick would give you but its only self-serving cant.

One of the things that would be nice to link up with roll call votes would be the homepages of those voting.

Continuing with Ralph Abraham, mapping A000374 to https://abraham.house.gov/ would be helpful in gathering other information, such as the various offices where Representative Abraham can be contacted.

If you are reading the URIs, you might think just prepending the last name of each representative to “house.gov” would be sufficient. Well, it would be except that there are eight-three cases where representatives share last names and/or a new naming scheme has more than the last name + house.gov.

After I was satisfied that there wasn’t a direct mapping between the current uses of name-id and House member websites, I started creating such a mapping that you can drop into XQuery as a lookup table and/or use as an external file.

The lookup table should be finished tomorrow so check back.

PS: Yes, I am aware there are tables of contact information for members of Congress but I have yet to see one that lists all their local offices. Moreover, a lookup table for XQuery may encourage people to connect more data to their representatives. Such as articles in local newspapers, property deeds and other such material.

November 4, 2015

Interhacktives

Filed under: Data Mining,Journalism,News,Reporting — Patrick Durusau @ 11:18 am

Interhacktives

I “discovered” Interhactives while following a tweet on “Excel tips for journalists.” I thought it would be a short article saying “don’t” but was mistaken. 😉

Turned out to be basic advice on “using” Excel.

Moving around a bit I found an archive of “how-to” posts and other resources for digital journalists and anyone interested in finding/analyzing content on the Web.

You won’t find discussions of Lamda Architecture here but you will find nuts-an-bolts type information, ready to be put into practice.

Visit Interhacktives and pass it along to others.

I first saw this in a tweet by Journalism Tools.

October 18, 2015

Requirements For A Twitter Client

Filed under: Curation,Data Mining,Twitter — Patrick Durusau @ 2:57 pm

Kurt Cagle writes of needed improvements to Twitter’s “Moments,” in Project Voyager and Moments: Close, but not quite there yet saying:

This week has seen a pair of announcements that are likely to significantly shake up social media as its currently known. Earlier this week, Twitter debuted its Moments, a news service where the highlights of the week are brought together into a curated news aggregator.

However, this is 2015. What is of interest to me – topics such as Data Science, Semantics, Astronomy, Climate Change and so forth, are likely not going to be of interest to others. Similarly, I really have no time for cute pictures of dogs (cats, maybe), the state of the World Series race, the latest political races or other “general” interest topics. In other words, I want to be able to curate content my way, even if the quality is not necessarily the highest, than I do have other people who I do not know decide to curate to the lowest possible denominator.

A very small change, on the other hand, could make a huge difference for Moments for myself and many others. Allow users to aggregate a set of hash tags under a single “Paper section banner” – #datascience, #data, #science, #visualization, #analytics, #stochastics, etc. – could all go under the Data Science banner. Even better yet, throw in a bit of semantics to find every topic within two hops topically to the central terms and use these (with some kind of weighting factor) as well. Rank these tweets according to fitness, then when I come to Twitter I can “read” my twitter paper just by typing in the appropriate headers (or have them auto-populate a list).

My exclusion list would include cats, shootings, bombings, natural disasters, general news and other ephemera that will be replaced by another screaming headline next week, if not tomorrow.

Starting with Kurt’s suggested improvements, a Twitter client should offer:

  • User-based aggregation based upon # tags
  • Learning semantics (Kurt’s two-hop for example)
  • Deduping tweets for user set period, day, week, month, other
  • User determined sorting of tweets by time/date, author, retweets, favorites
  • Exclusion of tweets without URLs
  • Filtering of tweets based on sender (included by # tags), etc. and perhaps regex

I have looked but not found any Twitter client that comes even close.

Other requirements?

October 5, 2015

International Hysteria Over American Gun Violence

Filed under: Data Mining,News,Text Mining — Patrick Durusau @ 7:56 pm

Australia’s call for a boycott on U.S. travel until gun-reform is passed may be the high point of the international hysteria over gun violence in the United States. Or it may not be. Hard to say at this point.

Social media has been flooded with hand wringing over the loss of “innocent” lives, etc., you know the drill.

The victims in Oregon were no doubt “innocent,” but innocence alone isn’t the criteria by which “mass murder” is judged.

At least not according to both the United States government, other Western governments and their affiliated news organizations.

Take the Los Angeles Times for example, which has an updated list of mass shootings, 1984 – 2015.

Or the breathless prose of The Chicagoist in Chicago Dominates The U.S. In Mass Shootings Count.

Based on data compiled by the crowd-sourced Mass Shooting Tracker site, the Guardian discovered that there were 994 mass shootings—defined as an incident in which four or more people are shot—in 1,004 days since Jan. 1, 2013. The Oregon shooting happened on the 274th day of 2015 and was the 294th mass shooting of the year in the U.S.

Some 294 mass shootings since January 1, 2015 in the U.S.?

Chump change my friend, chump change.

No disrespect to the innocent dead, wounded or their grieving families, but as I said, “innocence isn’t the criteria for judging mass violence. Not by Western governments, not by the Western press.

You will have to do a little data mining to come to that conclusion but if you have the time, follow along.

First, of course, we have to find acts of violence with no warning to its innocent victims who were just going about their lives. At least until pain and death came raining out of the sky.

Let’s start with Operation Inherent Resolve: Targeted Operations Against ISIL Terrorists.

If you select a country name, your options are Syria and Iraq, a pop-up will display the latest news briefing on “Airstrikes in Iraq and Syria.” Under the current summary, you will see “View Information on Previous Airstrikes.”

Selecting “View Information on Previous Airstrikes” will give you a very long drop down page with previous air strike reports. It doesn’t list human casualties or the number of bombs dropped, but it does recite the number of airstrikes.

Capture that information down to January 1, 2015 and save it to a text file. I have already captured it and you can download us-airstrikes-iraq-syria.txt.

You will notice that the file has text other than the air strikes, but air strikes are reported in a common format:

 - Near Al Hasakah, three strikes struck three separate ISIL tactical units 
   and destroyed three ISIL structures, two ISIL fighting positions, and an 
   ISIL motorcycle.
 - Near Ar Raqqah, one strike struck an ISIL tactical unit.
 - Near Mar’a, one strike destroyed an ISIL excavator.
 - Near Washiyah, one strike damaged an ISIL excavator.

Your first task is to extract just the lines that start with: “- Near” and save them to a file.

I used: grep '\- Near' us-airstrikes-iraq-syria.txt > us-airstrikes-iraq-syria-strikes.txt

Since I now have all the lines with airstrike count data, how do I add up all the numbers?

I am sure there is an XQuery solution but its throw-away data , so I took the easy way out:

grep 'one airstrike' us-airstrikes-iraq-syria-strikes.txt | wc -l

Which gave me a count of all the lines with “one airstrike,” or 629 if you are interested.

Just work your way up through “ten airstrikes” and after that, nothing but zeroes. Multiple the number of lines times the number in the search expression and you have the number of airstrikes for that number. One I found was 132 for “four airstrikes,” so that was 528 airstrikes for that number.

Oh, I forgot to mention, some of the reports don’t use names for numbers but digits. Yeah, inconsistent data.

The dirty answer to that was:

grep '[0-9] airstrikes' us-airstrikes-iraq-syria-strikes.txt > us-airstrikes-iraq-syria-strikes-digits.txt

The “[0-9]” detects any digit, between zero and nine. Could have made it a two-digit number but any two-digit number starts with one digit so why bother?

Anyway, that found another 305 airstrikes that were reported in digits.

Ah, total number of airstrikes, not bombs but airstrikes since January 1, 2015?

4,207 airstrikes as of today.

That’s four thousand, two hundred and seven (minimum, more than one bomb per airstrike), times that innocent civilians may have been murdered or at least terrorized by violence falling out of the sky.

Those 4,207 events were not the work of marginally functional, disturbed or troubled individuals. No, those events were orchestrated by highly trained, competent personnel, backed by the largest military machine on the planet and a correspondingly large military industrial complex.

I puzzle over the international hysteria over American gun violence when the acts are random, unpredictable and departures from the norm. Think of all the people with access to guns in the United States who didn’t go on violent rampages.

The other puzzlement is that the crude data mining I demonstrated above establishes the practice of violence against innocents is a long standing and respected international practice.

Why stress over 294 mass shootings in the U.S. when 4,207 airstrikes in 2015 have killed or endangered equally innocent civilians who are non-U.S. citizens?

What is fair for citizens of one country should be fair for citizens of every country. The international community seems to be rather selective when applying that principle.
September 7, 2015

DataGraft: Initial Public Release

Filed under: Cloud Computing,Data Conversion,Data Integration,Data Mining — Patrick Durusau @ 3:21 pm

DataGraft: Initial Public Release

As a former resident of Louisiana and given my views on the endemic corruption in government contracts, putting “graft” in the title of anything is like waving a red flag at a bull!

From the webpage:

We are pleased to announce the initial public release of DataGraft – a cloud-based service for data transformation and data access. DataGraft is aimed at data workers and data developers interested in simplified and cost-effective solutions for managing their data. This initial release provides capabilities to:

  • Transform tabular data and share transformations: Interactively edit, host, execute, and share data transformations
  • Publish, share, and access RDF data: Data hosting and reliable RDF data access / data querying

Sign up for an account and try DataGraft now!

You may want to check out our FAQ, documentation, and the APIs. We’d be glad to hear from you – don’t hesitate to get in touch with us!

I followed a tweet from Kirk Borne recently to a demo of Pentaho on data integration. I mention that because Pentaho is a good representative of the commercial end of data integration products.

Oh, the demo was impressive, a visual interface selecting nicely styled icons from different data sources, integration, visualization, etc.

But, the one characteristic it shares with DataGraft is that I would be hard pressed to follow or verify your reasoning for the basis for integrating that particular data.

If it happens that both files have customerID and they both have the same semantic, by some chance, then you can glibly talk about integrating data from diverse resources. If not, well, then your mileage will vary a great deal.

The important point that is dropped by both Pentaho and DataGraft is that data integration isn’t just an issue for today, that same data integration must be robust long after I have moved onto another position.

Like spreadsheets, the next person in my position could just run the process blindly and hope that no one ever asks for a substantive change, but that sounds terribly inefficient.

Why not provide users with the ability to disclose the properties they “see” in the data sources and to indicate why they made the mappings they did?

That is make the mapping process more transparent.

June 26, 2015

Top 10 data mining algorithms in plain R

Filed under: Data Mining,R — Patrick Durusau @ 3:40 pm

Top 10 data mining algorithms in plain R by Raymond Li.

From the post:

Knowing the top 10 most influential data mining algorithms is awesome.

Knowing how to USE the top 10 data mining algorithms in R is even more awesome.

That’s when you can slap a big ol’ “S” on your chest…

…because you’ll be unstoppable!

Today, I’m going to take you step-by-step through how to use each of the top 10 most influential data mining algorithms as voted on by 3 separate panels in this survey paper.

By the end of this post…

You’ll have 10 insanely actionable data mining superpowers that you’ll be able to use right away.

The table of contents follows his Top 10 data mining algorithms in plain English, with additions for R:

I would not be at all surprised to see these top ten (10) algorithms show up in other popular data mining languages.

Enjoy!

May 24, 2015

Summarizing and understanding large graphs

Filed under: Data Mining,Graphs — Patrick Durusau @ 3:26 pm

Summarizing and understanding large graphs by Danai Koutra, U Kang, Jilles Vreeken and Christos Faloutsos. (DOI: 10.1002/sam.11267)

Abstract:

How can we succinctly describe a million-node graph with a few simple sentences? Given a large graph, how can we find its most “important” structures, so that we can summarize it and easily visualize it? How can we measure the “importance” of a set of discovered subgraphs in a large graph? Starting with the observation that real graphs often consist of stars, bipartite cores, cliques, and chains, our main idea is to find the most succinct description of a graph in these “vocabulary” terms. To this end, we first mine candidate subgraphs using one or more graph partitioning algorithms. Next, we identify the optimal summarization using the minimum description length (MDL) principle, picking only those subgraphs from the candidates that together yield the best lossless compression of the graph—or, equivalently, that most succinctly describe its adjacency matrix.

Our contributions are threefold: (i) formulation: we provide a principled encoding scheme to identify the vocabulary type of a given subgraph for six structure types prevalent in real-world graphs, (ii) algorithm: we develop VoG, an efficient method to approximate the MDL-optimal summary of a given graph in terms of local graph structures, and (iii) applicability: we report an extensive empirical evaluation on multimillion-edge real graphs, including Flickr and the Notre Dame web graph.

Use the DOI if you need the official citation, otherwise select the title link and it takes you a non-firewalled copy.

A must read if you are trying to extract useful information out of multimillion-edge graphs.

I first saw this in a tweet by Kirk Borne.

May 21, 2015

Top 10 data mining algorithms in plain English

Filed under: Algorithms,Data Mining — Patrick Durusau @ 1:20 pm

Top 10 data mining algorithms in plain English by Raymond Li.

From the post:

Today, I’m going to explain in plain English the top 10 most influential data mining algorithms as voted on by 3 separate panels in this survey paper.

Once you know what they are, how they work, what they do and where you can find them, my hope is you’ll have this blog post as a springboard to learn even more about data mining.

What are we waiting for? Let’s get started!

Raymond covers:

  1. C4.5
  2. k-means
  3. Support vector machines
  4. Apriori
  5. EM
  6. PageRank
  7. AdaBoost
  8. kNN
  9. Naive Bayes
  10. CART
  11. Interesting Resources
  12. Now it’s your turn…

Would be nice if we all had a similar ability to explain algorithms!

Enjoy!

May 1, 2015

Large-Scale Social Phenomena – Data Mining Demo

Filed under: Data Mining,Python — Patrick Durusau @ 7:48 pm

Large-Scale Social Phenomena – Data Mining Demo by Artemy Kolchinsky.

From the webpage:

For your mid-term hack-a-thons, you will be expected to quickly acquire, analyze and draw conclusion from some real-world datasets. The goal of this tutorial is to provide you with some tools that will hopefully enable you to spend less time debugging and more time generating and testing interesting ideas.

Here, I chose to focus on Python. It is beautiful language that is quickly developing an ecosystem of powerful and free scientific computing and data mining tools (e.g. the Homogenization of scientific computing, or why Python is steadily eating other languages’ lunch). For this reason, as well as my own familiarity with it, I encourage (though certainly not require) you to use it for your mid-term hack-a-thons. From my own experience, getting comfortable with these tools will pay off in terms of making many future data analysis projects (including perhaps your final projects) easier & more enjoyable.

Just in time for the weekend! I first saw this in a tweet by Lynn Cherny.

Suggestions of odd data sources for mining?

April 13, 2015

27 Free Data Mining Books (with comments and a question)

Filed under: Data Mining — Patrick Durusau @ 2:41 pm

27 Free Data Mining Books

From the post:

As you know, here at DataOnFocus we love to share information, specially about data sciences and related subjects. And what is one of the best ways to learn about a specific topic? Reading a book about it, and then practice with the fresh knowledge you acquired.

And what is better than increase your knowledge by studying a high quality book about a subject you like? It’s reading it for free! So we did some work and created an epic list of absolutelly free books on data related subjects, from which you can learn a lot and become an expert. Be aware that these are complex subjects and some require some previous knowledge.

Some comments on the books:

Caution:

Machine Learning – Wikipedia Guide

A great resource provided by Wikipedia assembling a lot of machine learning in a simple, yet very useful and complete guide.

is failing to compile with this message:

Generation of the document file has failed.

Status: Rendering process died with non zero code: 1

One possible source of the error is that the collection is greater than 500 articles (577 to be exact), which no doubt pushes it beyond 800 pages (another rumored limitation).

If I create sub-sections that successfully render I will post a note about it.

Warning:

Mining the Social Web: Data Mining Facebook, Twitter, LinkedIn, Google+, GitHub, and More (link omitted)

The exploration of social web data is explained on this book. Data capture from the social media apps, it’s manipulation and the final visualization tools are the focus of this resource.

This site gives fake virus warnings along with choices. Bail as soon as you see them. Or better yet, miss this site altogether. The materials offered are under copyright.

That’s the thing that government and corporation officials don’t realize about lying. If they are willing to lie for “our” side, then they are most certainly willing to lie to you and me. The same holds true for thieves.

Broken Link:

Data Mining Techniques: For Marketing, Sales, and Customer Relationship Management (This is the broken link, I don’t have a replacement.)

A data mining book oriented specifically to marketing and business management. With great case studies in order to understand how to apply these techniques on the real world.


Assuming you limit yourself to the legally available materials, there are several thousand pages pages of materials, all of which are relevant to some aspect of data mining or another.

Each of these works covers material where new techniques have emerged since their publication.

This isn’t big data, there being only twenty-four (23) volumes if you exclude the three (one noted in the listing) with broken links and the illegal O’Reilly material.

Where would you start with organizing this collection of “small data?”

March 23, 2015

ICDM ’15: The 15th IEEE International Conference on Data Mining

Filed under: Conferences,Data Mining — Patrick Durusau @ 3:08 pm

ICDM ’15: The 15th IEEE International Conference on Data Mining November 14-17, 2015, Atlantic City, NJ, USA

Important dates:

All deadlines are at 11:59PM Pacific Daylight Time
* Workshop notification:                             Mar 29, 2015
* ICDM contest proposals:                            Mar 29, 2015
* Full paper submissions:                            Jun 03, 2015
* Demo proposals:                                    Jul 13, 2015
* Workshop paper submissions:                        Jul 20, 2015
* Tutorial proposals:                                Aug 01, 2015
* Conference paper, tutorial, demo notifications:    Aug 25, 2015
* Workshop paper notifications:                      Sep 01, 2015
* Conference dates:                                  Nov 14-17, 2015

From the post:

The IEEE International Conference on Data Mining series (ICDM) has established itself as the world’s premier research conference in data mining. It provides an international forum for presentation of original research results, as well as exchange and dissemination of innovative, practical development experiences. The conference covers all aspects of data mining, including algorithms, software and systems, and applications. ICDM draws researchers and application developers from a wide range of data mining related areas such as statistics, machine learning, pattern recognition, databases and data warehousing, data visualization, knowledge-based systems, and high performance computing. By promoting novel, high quality research findings, and innovative solutions to challenging data mining problems, the conference seeks to continuously advance the state-of-the-art in data mining. Besides the technical program, the conference features workshops, tutorials, panels and, since 2007, the ICDM data mining contest.

Topics of Interest
******************

Topics of interest include, but are not limited to:

* Foundations, algorithms, models, and theory of data mining
* Machine learning and statistical methods for data mining
* Mining text, semi-structured, spatio-temporal, streaming, graph, web, multimedia data
* Data mining systems and platforms, their efficiency, scalability, and privacy
* Data mining in modeling, visualization, personalization, and recommendation
* Applications of data mining in all domains including social, web, bioinformatics, and finance

An excellent conference but unlikely to be as much fun as Balisage. The IEEE conference will be the pocket protector crowd whereas Balisage features a number of wooly-pated truants (think Hobbits), some of which don’t even wear shoes. Some of them wear hats though. Large colorful hats. Think Mad Hatter and you are close.

If your travel schedule permits do both Balisage and this conference.

Enjoy!

March 2, 2015

Drilling Down: A Quick Guide to Free and Inexpensive Data Tools

Filed under: Data Mining,Journalism,News,Reporting — Patrick Durusau @ 7:35 pm

Drilling Down: A Quick Guide to Free and Inexpensive Data Tools by Nils Mulvad.

From the post:

Newsrooms don’t need large budgets for analyzing data–they can easily access basic data tools that are free or inexpensive. The summary below is based on a five-day training session at Delo, the leading daily newspaper in Slovenia. Anuška Delić, journalist and project leader of DeloData at the paper, initiated the training with the aim of getting her team to work on data stories with easily available tools and a lot of new data.

“At first it seemed that not all of the 11 participants, who had no or almost no prior knowledge of this exciting field of journalism, would ‘catch the bug’ of data-driven thinking about stories, but soon it became obvious” once the training commenced, said Delić.

Encouraging story about data journalism as well as a source for inexpensive tools.

Even knowing the most basic tools will make you standout from people that repeat the government or party line (depending on where you are located).

‘Keep Fear Alive.’ Keep it alive.

Filed under: Data Mining,Security — Patrick Durusau @ 2:50 pm

Why Does the FBI Have To Manufacture Its Own Plots If Terrorism And ISIS Are Such Grave Threats? by Glenn Greenwald.

From the post:

The FBI and major media outlets yesterday trumpeted the agency’s latest counterterrorism triumph: the arrest of three Brooklyn men, ages 19 to 30, on charges of conspiring to travel to Syria to fight for ISIS (photo of joint FBI/NYPD press conference, above). As my colleague Murtaza Hussain ably documents, “it appears that none of the three men was in any condition to travel or support the Islamic State, without help from the FBI informant.” One of the frightening terrorist villains told the FBI informant that, beyond having no money, he had encountered a significant problem in following through on the FBI’s plot: his mom had taken away his passport. Noting the bizarre and unhinged ranting of one of the suspects, Hussain noted on Twitter that this case “sounds like another victory for the FBI over the mentally ill.”

In this regard, this latest arrest appears to be quite similar to the overwhelming majority of terrorism arrests the FBI has proudly touted over the last decade. As my colleague Andrew Fishman and I wrote last month — after the FBI manipulated a 20-year-old loner who lived with his parents into allegedly agreei target=”_blank”ng to join an FBI-created plot to attack the Capitol — these cases follow a very clear pattern:

The known facts from this latest case seem to fit well within a now-familiar FBI pattern whereby the agency does not disrupt planned domestic terror attacks but rather creates them, then publicly praises itself for stopping its own plots.

….

In an update to the post, Greenwald quotes former FBI assistant director Thomas Fuentes as saying:

If you’re submitting budget proposals for a law enforcement agency, for an intelligence agency, you’re not going to submit the proposal that “We won the war on terror and everything’s great,” cuz the first thing that’s gonna happen is your budget’s gonna be cut in half. You know, it’s my opposite of Jesse Jackson’s ‘Keep Hope Alive’—it’s ‘Keep Fear Alive.’ Keep it alive. (emphasis in the original)

The FBI run terror operations give a ring of validity to the imagined plots that the rest of the intelligence and law enforcement community is alleged to be fighting.

It’s unfortunate that the mainstream media can’t divorce itself from the government long enough to notice the shortage of terrorists in the United States. As in zero judging from terrorist attacks on government and many other institutions.

For example, the federal, state and local governments employ 21,831,255 people. Let’s see, how many died last year in terrorist attacks against any level of government? Err, that would the the 0, empty set, nil.

What about all the local, state, federal elected officials? Certainly federal officials would be targets for terrorists. How many died last year in terrorist attacks? Again, 0, empty set, nil.

Or the 900,000 police officers? Again, 0, empty set, nil. (About 150 police officers die every year in the line of duty. Auto accidents, violent encounters with criminals, etc. but no terrorists.)

That covers some of the likely targets for any terrorist and we came up with zero deaths. Either terrorists aren’t in the United States or their mother won’t let them buy a gun.

Either way, you can see why everyone should be rejecting the fear narrative.

PS: Suggestion: Let’s cut all the terrorist related budgets in half and if there are no terrorist attacks within a year, half them again. Then there would be no budget crisis, we could pay down the national debt, save Social Security and not live in fear.

February 17, 2015

Data Mining: Spring 2013 (CMU)

Filed under: Data Mining,R — Patrick Durusau @ 2:33 pm

Data Mining: Spring 2013 (CMU) by Ryan Tibshirani.

Overview and Objectives [from syllabus]

Data mining is the science of discovering structure and making predictions in data sets (typically, large ones). Applications of data mining are happening all around you|and if they are done well, they may sometimes even go unnoticed. How does Google web search work? How does Shazam recognize a song playing in the background? How does Net Flix recommend movies to each of its users? How could we predict whether or not a person will develop breast cancer based on genetic information? How could we search for possible subgroups among breast cancer patients, suggesting diff erent variants of the disease? An expert’s answer to any one of these questions may very well contain enough material to fill its own course, but basic answers stem from the principles of data mining.

Data mining spans the fi elds of statistics and computer science. Since this is a course in statistics, we will adopt a statistical perspective the majority of the course. Data mining also involves a good deal of both applied work (programming, problem solving, data analysis) and theoretical work (learning, understanding, and evaluating methodologies). We will try to maintain a balance between the two.

Upon completing this course, you should be able to tackle new data mining problems, by: (1) selecting the appropriate methods and justifying your choices; (2) implementing these methods programmatically (using, say, the R programming language) and evaluating your results; (3) explaining your results to a researcher outside of statistics or computer science.

Lecture notes, R files, what more could you want? 😉

Enjoy!

February 16, 2015

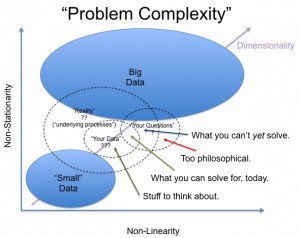
Big Data, or Not Big Data: What is <your> question?

Filed under: BigData,Complexity,Data Mining — Patrick Durusau @ 7:55 pm

Big Data, or Not Big Data: What is <your> question? by Pradyumna S. Upadrashta.

From the post:

Before jumping on the Big Data bandwagon, I think it is important to ask the question of whether the problem you have requires much data. That is, I think its important to determine when Big Data is relevant to the problem at hand.

The question of relevancy is important, for two reasons: (i) if the data are irrelevant, you can’t draw appropriate conclusions (collecting more of the wrong data leads absolutely nowhere), (ii) the mismatch between the problem statement, the underlying process of interest, and the data in question is critical to understand if you are going to distill any great truths from your data.

Big Data is relevant when you see some evidence of a non-linear or non-stationary generative process that varies with time (or at least, collection time), on the spectrum of random drift to full blown chaotic behavior. Non-stationary behaviors can arise from complex (often ‘hidden’) interactions within the underlying process generating your observable data. If you observe non-linear relationships, with underlying stationarity, it reduces to a sampling problem. Big Data implicitly becomes relevant when we are dealing with processes embedded in a high dimensional context (i.e., after dimension reduction). For high embedding dimensions, we need more and more well distributed samples to understand the underlying process. For problems where the underlying process is both linear and stationary, we don’t necessarily need much data

bigdata-complexity

Great post and a graphic that is worthy of being turned into a poster! (Pradyumna asks for suggestions on the graphic so you may want to wait a few days to see if it improves. Plus send suggestions if you have them.)

What is <your> question? wasn’t the starting point for: Dell: Big opportunities missed as Big Data remains big business.

The barriers to big data:

While big data has proven marketing benefits, infrastructure costs (35 per cent) and security (35 per cent) tend to be the primary obstacles for implementing big data initiatives.

Delving deeper, respondents believe analytics/operational costs (34 per cent), lack of management support (22 per cent) and lack of technical skills (21 per cent) are additional barriers in big data strategies.

“So where do the troubles with big data stem from?” asks Jones, citing cost (e.g. price of talent, storage, etc.), security concerns, uncertainty in how to leverage data and a lack of in-house expertise.

“In fact, only 36 percent of organisations globally have in-house big data expertise. Yet, the proven benefits of big data analytics should justify the investment – businesses just have to get started.

Do you see What is <your> question? being answered anywhere?

I didn’t, yet the drum beat for big data continues.

I fully agree that big data techniques and big data are important advances and they should be widely adopted and used, but only when they are appropriate to the question at hand.

Otherwise you will be like a non-profit I know that spent upward of $500,000+ on a CMS system that was fundamentally incompatible with their data. Wasn’t designed for document management. Fine system but not appropriate for the task at hand. It was like a sleeping dog in the middle of the office. No matter what you wanted to do, it was hard to avoid the dog.

Certainly could not admit that the purchasing decision was a mistake because those in charge would lose face.

Don’t find yourself in a similar situation with big data.

Unless and until someone produces an intelligible business plan that identifies the data, the proposed analysis of the data and the benefits of the results, along with cost estimates, etc., keep a big distance from big data. Make business ROI based decisions, not cult ones.

I first saw this in a tweet by Kirk Borne.

Structuredness coefficient to find patterns and associations

Filed under: Data Mining,Visualization — Patrick Durusau @ 5:27 pm

Structuredness coefficient to find patterns and associations by Livan Alonso.

From the post:

The structuredness coefficient, let’s denote it as w, is not yet fully defined – we are working on this right now. You are welcome to help us come up with a great, robust, simple, easy-to-compute, easy-to-understand, easy-to-interpret metric. In a nutshell, we are working under the following framework:

  • We have a data set with n points. For simplicity, let’s consider for now that these n points are n vectors (x, y) where x, y are real numbers.
  • For each pair of points {(x,y), (x’,y’)} we compute a distance d between the two points. In a more general setting, it could be a proximity metric between two keywords.
  • We order all the distances d and compute the distance distribution, based on these n points
  • Leaving-one-out: we remove one point at a time and compute the n new distance distributions, each based on n-1 points
  • We compare the distribution computed on n points, with the n ones computed on n-1 points
  • We repeat this iteration, but this time with n-2, then n-3, n-4 points etc.
  • You would assume that if there is no pattern, these distance distributions (for successive values of n) would have some kind of behavior uniquely characterizing the absence of structure, behavior that can be identified via simulations. Any deviation from this behavior would indicate the presence of a structure. And the pattern-free behavior would be independent of the underlying point distribution or domain – a very important point. All of this would have to be established or tested, of course.
  • It would be interesting to test whether this metric can identify patterns such as fractal distribution / fractal dimension. Would it be able to detect patterns in time series?

Note that this type of structuredness coefficient makes no assumption on the shape of the underlying domains, where the n points are located. These domains could be smooth, bumpy, made up of lines, made up of dual points etc. They might even be non numeric domain at all (e.g. if the data consists of keywords).

fractal

Deeply interesting work and I appreciate the acknowledgement that “structuredness coefficient” isn’t fully defined.

I will be trying to develop more links to resources on this topic. Please chime in if you have some already.

February 13, 2015

An R Client for the Internet Archive API

Filed under: Data Mining,R — Patrick Durusau @ 8:19 pm

An R Client for the Internet Archive API by Lincoln Mullen.

From the webpage:

In support of some of my research projects, I created a simple R package to access the Internet Archive’s API. The package is intended to search for items, to retrieve their metadata in a usable form, and to download the files associated with the items. The package, called internetarchive, is available on GitHub. The README and the vignette have a full explanation, but here is a brief overview.

This is cool!

And a great way to contrast NSA data collection with useful data collection.

If you were the NSA, you would suck down all the new Internet Archive content everyday. Then you would “explore” that plus lots of other content for “relationships.” Which abound in any data set that large.

If you are Lincoln Mullen or someone empowered by his work, you search for items and incrementally build a set of items with context and additional information you add to that set.

If you were paying the bill, which of those approaches seems the most likely to produce useful results?

Information/data/text mining doesn’t change in nature due to size or content or the purpose of the searching or whose paying the bill. The goal is useful (or should be) useful results for some purpose X.

February 9, 2015

Warning High-Performance Data Mining and Big Data Analytics Warning

Filed under: BigData,Data Mining — Patrick Durusau @ 7:38 pm

Warning High-Performance Data Mining and Big Data Analytics Warning by Khosrow Hassibi.

Before you order this book, there are three things you need to take into account.

First, the book claims to target eight (8) separate audiences:

Target Audience: This book is intended for a variety of audiences:

(1) There are many people in the technology, science, and business disciplines who are curious to learn about big data analytics in a broad sense, combined with some historical perspective. They may intend to enter the big data market and play a role. For this group, the book provides an overview of many relevant topics. College and high school students who have interest in science and math, and are contemplating about what to pursue as a career, will also find the book helpful.

(2) For the executives, business managers, and sales staff who also have an interest in technology, believe in the importance of analytics, and want to understand big data analytics beyond the buzzwords, this book provides a good overview and a deeper introduction of the relevant topics.

(3) Those in classic organizations—at any vertical and level— who either manage or consume data find this book helpful in grasping the important topics in big data analytics and its potential impact in their
organizations.

(4) Those in IT benefit from this book by learning about the challenges of the data consumers: data miners/scientists, data analysts, and other business users. Often the perspectives of IT and analytics users are different on how data is to be managed and consumed.

(5) Business analysts can learn about the different big data technologies and how it may impact what they do today.

(6) Statisticians typically use a narrow set of statistical tools and usually work on a narrow set of business problems depending on their industry. This book points to many other frontiers in which statisticians can continue to play important roles.

(7) Since the main focus of the book is high-performance data mining and contrasting it with big data analytics in terms of commonalities and differences, data miners and machine learning practitioners gain a holistic view of how the two relate.

(8) Those interested in data science gain from the historical viewpoint of the book since the practice of data science—as opposed to the name itself—has existed for a long time. Big data revolution has significantly helped create awareness about analytics and increased the need for data science professionals.

Second, are you wondering how a book covers that many audiences and that much technology in a little over 300 pages? Review the Table of Contents. See how in depth the coverage appears to be to you.

Third, you do know that Mining of Massive Datasets by Jure Leskovec, Anand Rajaraman, Jeff Ullman, is available for free (electronic copy) and in hard copy from Cambridge University Press. Yes?

Its prerequisites are:

1. An introduction to database systems, covering SQL and related programming systems.

2. A sophomore-level course in data structures, algorithms, and discrete math.

3. A sophomore-level course in software systems, software engineering, and programming languages.

With one audience, satisfying technical prerequisites, Mining Massive Datasets (MMD) runs over five hundred (500) pages.

Up to you but I prefer narrower in depth coverage of topics.

January 16, 2015

The golden ratio has spawned a beautiful new curve: the Harriss spiral

Filed under: Data Mining,Fractals — Patrick Durusau @ 7:51 pm

The golden ratio has spawned a beautiful new curve: the Harriss spiral by Alex Bellos.

Harriss

Yes, a new fractal!

See Alex’s post for the details.

The important lesson is this fractal has been patiently waiting to be discovered. What patterns are waiting to be discovered in your data?

I first saw this in a tweet by Lars Marius Garshol.

January 12, 2015

Data wrangling, exploration, and analysis with R

Filed under: Data Analysis,Data Mining,R — Patrick Durusau @ 7:17 pm

Data wrangling, exploration, and analysis with R Jennifer (Jenny) Bryan.

Graduate level class that uses R for “data wrangling, exploration and analysis.” If you are self-motivated, you will be hard pressed to find better notes, additional links and resources for an R course anywhere. More difficult on your own but work through this course and you will have some serious R chops to build upon.

It just occurred to me that a requirement for news channels should have sub-titles that list data repositories for each story reported. So you could load of the data while the report in ongoing.

I first saw this in a tweet by Neil Saunders.

January 7, 2015

University Administrations and Data Checking

Filed under: Data Mining,Data Replication,Skepticism — Patrick Durusau @ 7:40 pm

Axel Brennicke and Björn Brembs, posted the following about university administrations in Germany.

Noam Chomsky, writing about the Death of American Universities, recently reminded us that reforming universities using a corporate business model leads to several easy to understand consequences. The increase of the precariat of faculty without benefits or tenure, a growing layer of administration and bureaucracy, or the increase in student debt. In part, this well-known corporate strategy serves to increase labor servility. The student debt problem is particularly obvious in countries with tuition fees, especially in the US where a convincing argument has been made that the tuition system is nearing its breaking point. The decrease in tenured positions is also quite well documented (see e.g., an old post). So far, and perhaps as may have been expected, Chomsky was dead on with his assessment. But how about the administrations?

To my knowledge, nobody has so far checked if there really is any growth in university administration and bureaucracy, apart from everybody complaining about it. So Axel Brennicke and I decided to have a look at the numbers. In Germany, employment statistics can be obtained from the federal statistics registry, Destatis. We sampled data from 2005 (the year before the Excellence Initiative and the Higher Education Pact) and the latest year we were able to obtain, 2012.

I’m sympathetic to the authors and their position, but that doesn’t equal verification of their claims about the data.

They have offered the data to anyone who want to check: Raw Data for Axel Brennicke and Björn Brembs.

Granting the article doesn’t detail their analysis, after downloading the data, what’s next? How would you go about verifying statements made in the article?

If people get in the habit of offering data for verification and no one looks, what guarantee of correctness will that bring?


The data passes the first test, it is actually present at the download site. Don’t laugh, the NSA has trouble making that commitment.

Do note that the files have underscores in their names which makes them appear to have spaces in their names. HINT: Don’t use underscores in file name. Ever.

The files are old style .xls files so just about anything recent should read them. Do be aware the column headers are in German.

The only description reads:

Employment data from DESTATIS about German university employment in 2005 and 2012

My first curiosity is the data being from two years only, 2005 and 2012. Just note that for now. What steps would you take with the data sets as they are?

I first saw this in a tweet by David Colquhoun.

January 6, 2015

Become Data Literate

Filed under: Data Mining — Patrick Durusau @ 7:10 pm

Become Data Literate

From the webpage:

Sign up to receive a new dataset and fun problems every two weeks.

Improving your sense with data is as easy as trying our problems!

The first one is available now!

No endorsement (I haven’t seen the first problem or dataset) but this could be fun.

I will keep you updated on what shows up as datasets and problems.

PS: Not off to a great start because after signing up I get a pop-up window asking me to invite a friend. 🙁 If I had Dick Cheney’s email address I might but I don’t. If and when I am impressed by the datasets/problems, I will mention it here and maybe in email to a friend.

Social networks can be very useful but they also are distractions. I prefer to allow my friends to choose their own distractions.

Parsing fixed-width flat files with Clojure

Filed under: Clojure,Data Mining — Patrick Durusau @ 9:07 am

Parsing fixed-width flat files with Clojure by Fredrik Dyrkell.

From the post:


This particular file is an example file for the Swedish direct debit transaction reports. Each row is fixed 80 characters long. Previously when I’ve worked with application integration between banks and ERP systems, I’ve often encountered these types of files. It is quite handy to be able to parse them, either completely or just extract relevant information, and send on further into another system.

Learn some Clojure and add a tool to parse fixed-width files. Nothing wrong with that!

The example here is a bank file but fixed width reports abound in government repositories.

Enjoy!

I first saw this in a tweet by PlanetClojure.

December 26, 2014

Seldon

Filed under: Data Mining,Open Source,Predictive Analytics — Patrick Durusau @ 1:59 pm

Seldon wants to make life easier for data scientists, with a new open-source platform by Martin Bryant.

From the post:

It feels that these days we live our whole digital lives according mysterious algorithms that predict what we’ll want from apps and websites. A new open-source product could help those building the products we use worry less about writing those algorithms in the first place.

As increasing numbers of companies hire in-house data science teams, there’s a growing need for tools they can work with so they don’t need to build new software from scratch. That’s the gambit behind the launch of Seldon, a new open-source predictions API launching early in the new year.

Seldon is designed to make it easy to plug in the algorithms needed for predictions that can recommend content to customers, offer app personalization features and the like. Aimed primarily at media and e-commerce companies, it will be available both as a free-to-use self-hosted product and a fully hosted, cloud-based version.

If you think Inadvertent Algorithmic Cruelty is a problem, just wait until people who don’t understand the data or the algorithms start using them in prepackaged form.

Packaged predictive analytics are about as safe as arming school crossing guards with .600 Nitro Express rifles to ward off speeders. As attractive as the second suggestion sounds, there would be numerous safety concerns.

Different but no less pressing safety concerns abound with packaged predictive analytics. Being disconnected from the actual algorithms, can enterprises claim immunity for race, gender or sexual orientation based discrimination? Hard to prove “intent” when the answers in question were generated in complete ignorance of the algorithmic choices that drove the results.

At least Seldon is open source and so the algorithms can be examined, should you be interested in how results are calculated. But open source algorithms are but one aspect of the problem. What of the data? Blind application of algorithms, even neutral ones, can lead to any number of results. If you let me supply the data, I can give you a guarantee of the results from any known algorithm. “Untouched by human hands” as they say.

When you are given recommendations based on predictive analytics do you ask for the data and/or algorithms? Who in your enterprise can do due diligence to verify the results? Who is on the line for bad decisions based on poor predictive analytics?

I first saw this in a tweet by Gregory Piatetsky.

December 17, 2014

Tracking Government/Terrorist Financing

Filed under: Data Mining,Finance Services,Government,Security — Patrick Durusau @ 11:04 am

Deep Learning Intelligence Platform – Addressing the KYC AML Terrorism Financing Challenge Dr. Jerry A. Smith.

From the post:

Terrorism impacts our lives each and every day; whether directly through acts of violence by terrorists, reduced liberties from new anti-terrorism laws, or increased taxes to support counter terrorism activities. A vital component of terrorism is the means through which these activities are financed, through legal and illicit financial activities. Recognizing the necessity to limit these financial activities in order to reduce terrorism, many nation states have agreed to a framework of global regulations, some of which have been realized through regulatory programs such as the Bank Secrecy Act (BSA).

As part of the BSA (an other similar regulations), governed financial services institutions are required to determine if the financial transactions of a person or entity is related to financing terrorism. This is a specific report requirement found in Response 30, of Section 2, in the FinCEN Suspicious Activity Report (SAR). For every financial transaction moving through a given banking system, the institution need to determine if it is suspicious and, if so, is it part of a larger terrorist activity. In the event that it is, the financial services institution is required to immediately file a SAR and call FinCEN.

The process of determining if a financial transaction is terrorism related is not merely a compliance issue, but a national security imperative. No solution exist today that adequately addresses this requirement. As such, I was asked to speak on the issue as a data scientist practicing in the private intelligence community. These are some of the relevant points from that discussion.

Jerry has a great outline of the capabilities you will need for tracking government/terrorist financing. Depending upon your client’s interest, you may be required to monitor data flows in order to trigger the filing of a SAR and calling FinCEN or to avoid triggering the filing of a SAR and calling FinCEN. For either goal the tools and techniques are largely the same.

Or for monitoring government funding for torture or groups to carry out atrocities on its behalf. Same data mining techniques apply.

Have you ever noticed that government data leaks rarely involve financial records? Thinking of the consequences of the accounts payable ledger that listed all the organizations and people paid by the Bush administration, sans all the SS and retirement recipients.

That would be near the top of my most wanted data leaks list.

You?

December 15, 2014

Infinit.e Overview

Filed under: Data Analysis,Data Mining,Structured Data,Unstructured Data,Visualization — Patrick Durusau @ 11:04 am

Infinit.e Overview by Alex Piggott.

From the webpage:

Infinit.e is a scalable framework for collecting, storing, processing, retrieving, analyzing, and visualizing unstructured documents and structured records.

[Image omitted. Too small in my theme to be useful.]

Let’s provide some clarification on each of the often overloaded terms used in that previous sentence:

  • It is a "framework" (or "platform") because it is configurable and extensible by configuration (DSLs) or by various plug-ins types – the default configuration is expected to be useful for a range of typical analysis applications but to get the most out of Infinit.e we anticipate it will usually be customized.
    • Another element of being a framework is being designed to integrate with existing infrastructures as well run standalone.
  • By "scalable" we mean that new nodes (or even more granular: new components) can be added to meet increasing workload (either more users or more data), and that provision of new resources are near real-time.
    • Further, the use of fundamentally cloud-based components means that there are no bottlenecks at least to the ~100 node scale.
  • By "unstructured documents" we mean anything from a mostly-textual database record to a multi-page report – but Infinit.e’s "sweet spot" is in the range of database records that would correspond to a paragraph or more of text ("semi-structured records"), through web pages, to reports of 10 pages or less.
    • Smaller "structured records" are better handled by structured analysis tools (a very saturated space), though Infinit.e has the ability to do limited aggregation, processing and integration of such datasets. Larger reports can still be handled by Infinit.e, but will be most effective if broken up first.
  • By "processing" we mean the ability to apply complex logic to the data. Infinit.e provides some standard "enrichment", such as extraction of entities (people/places/organizations.etc) and simple statistics; and also the ability to "plug in" domain specific processing modules using the Hadoop API.
  • By "retrieving" we mean the ability to search documents and return them in ranking order, but also to be able to retrieve "knowledge" aggregated over all documents matching the analyst’s query.
    • By "query"/"search" we mean the ability to form complex "questions about the data" using a DSL (Domain Specific Language).
  • By "analyzing" we mean the ability to apply domain-specific logic (visual/mathematical/heuristic/etc) to "knowledge" returned from a query.

We refer to the processing/retrieval/analysis/visualization chain as document-centric knowledge discovery:

  • "document-centric": means the basic unit of storage is a generically-formatted document (eg useful without knowledge of the specific data format in which it was encoded)
  • "knowledge discovery": means using statistical and text parsing algorithms to extract useful information from a set of documents that a human can interpret in order to understand the most important knowledge contained within that dataset.

One important aspect of the Infinit.e is our generic data model. Data from all sources (from large unstructured documents to small structured records) is transformed into a single, simple. data model that allows common queries, scoring algorithms, and analytics to be applied across the entire dataset. …

I saw this in a tweet by Gregory Piatetsky yesterday and so haven’t had time to download or test any of the features of Infinit.e.

The list of features is a very intriguing one.

Definitely worth the time to throw another VM on the box and try it out with a dataset of interest.

Would appreciate your doing the same and sending comments and/or pointers to posts with your experiences. Suspect we will have different favorite features and hit different limitations.

Thanks!

PS: Downloads.

« Newer PostsOlder Posts »

Powered by WordPress