Another Word For It Patrick Durusau on Topic Maps and Semantic Diversity

May 13, 2014

The Shrinking Big Data MarketPlace

Filed under: BigData,Marketing,VoltDB — Patrick Durusau @ 3:33 pm

VoltDB Survey Finds That Big Data Goes to Waste at Most Organizations

From the post:

VoltDB today announced the findings of an industry survey which reveals that most organizations cannot utilize the vast majority of the Big Data they collect. The study exposes a major Big Data divide: the ability to successfully capture and store huge amounts of data is not translating to improved bottom-line business benefits.

Untapped Data Has Little or No Value

The majority of respondents reveal that their organizations can’t utilize most of their Big Data, despite the fact that doing so would drive real bottom line business benefits.

  • 72 percent of respondents cannot access and/or utilize the majority of the data coming into their organizations.
  • Respondents acknowledge that if they were able to better leverage Big Data their organizations could: deliver a more personalized customer experience (49%); increase revenue growth (48%); and create competitive advantages (47%).

(emphasis added)

News like that makes me wonder how long the market for “big data tools” that can’t produce ROI is going to continue?

I suspect VoltDB has its eyes on addressing the software aspects of the non-utilization problem (more power to them) but that still leaves the usual office politics of who has access to what data and the underlying issues of effectively sharing data across inconsistent semantics.

Topic maps can’t help you address the office politics problem, unless you want to create a map of who is in the way of effective data sharing. Having created such a map, how you resolve personnel issues is your problem.

Topic maps can help with the inconsistent semantics that are going to persist even in the best of organizations. Departments have inconsistent semantics in many cases because their semantics or “silo” if you like, works best for their workflow.

Why not allow the semantics/silo stay in place and map it into other semantics/silos as need be? That way every department gets their familiar semantics and you get the benefit of better workflow.

To put it another way, silos aren’t the problem, it is the opacity of silos that is the problem. Make silos transparent and you have better data interchange and as a consequence, greater access to the data you are collecting.

Improve your information infrastructure on top of improved mapping/access to data and you will start to improve your bottom line. Someday you will get to “big data.” But as the survey says: Using big data tools != improved bottom line.

May 2, 2014

Big Data Report

Filed under: BigData — Patrick Durusau @ 2:24 pm

The Big Data and Privacy Working Group has issued its first report: Findings of the Big Data and Privacy Working Group Review.

John Podesta writes:

Over the past several days, severe storms have battered Arkansas, Oklahoma, Mississippi and other states. Dozens of people have been killed and entire neighborhoods turned to rubble and debris as tornadoes have touched down across the region. Natural disasters like these present a host of challenges for first responders. How many people are affected, injured, or dead? Where can they find food, shelter, and medical attention? What critical infrastructure might have been damaged?

Drawing on open government data sources, including Census demographics and NOAA weather data, along with their own demographic databases, Esri, a geospatial technology company, has created a real-time map showing where the twisters have been spotted and how the storm systems are moving. They have also used these data to show how many people live in the affected area, and summarize potential impacts from the storms. It’s a powerful tool for emergency services and communities. And it’s driven by big data technology.

In January, President Obama asked me to lead a wide-ranging review of “big data” and privacy—to explore how these technologies are changing our economy, our government, and our society, and to consider their implications for our personal privacy. Together with Secretary of Commerce Penny Pritzker, Secretary of Energy Ernest Moniz, the President’s Science Advisor John Holdren, the President’s Economic Advisor Jeff Zients, and other senior officials, our review sought to understand what is genuinely new and different about big data and to consider how best to encourage the potential of these technologies while minimizing risks to privacy and core American values.

The full text of the Big Data Report.

The executive summary seems to shift between “big data” and “not big data.” Maps of where twisters hit recently are hardly the province of “big data.” Every local news program produces similar maps. Even summarizing potential damage isn’t a “big” data issue. Both are data issues but that isn’t the same thing as “big data.”

If we are not careful, “big data” with very soon equal “data” and a useful distinction will have been lost.

Read the report over the weekend and post comments if you see other issues that merit mention.

Thanks!

April 20, 2014

Data Integration: A Proven Need of Big Data

Filed under: BigData,Data Integration — Patrick Durusau @ 3:21 pm

When It Comes to Data Integration Skills, Big Data and Cloud Projects Need the Most Expertise by David Linthicum.

From the post:

Looking for a data integration expert? Join the club. As cloud computing and big data become more desirable within the Global 2000, an abundance of data integration talent is required to make both cloud and big data work properly.

The fact of the matter is that you can’t deploy a cloud-based system without some sort of data integration as part of the solution. Either from on-premise to cloud, cloud-to-cloud, or even intra-company use of private clouds, these projects need someone who knows what they are doing when it comes to data integration.

While many cloud projects were launched without a clear understanding of the role of data integration, most people understand it now. As companies become more familiar with the could, they learn that data integration is key to the solution. For this reason, it’s important for teams to have at least some data integration talent.

The same goes for big data projects. Massive amounts of data need to be loaded into massive databases. You can’t do these projects using ad-hoc technologies anymore. The team needs someone with integration knowledge, including what technologies to bring to the project.

Generally speaking, big data systems are built around data integration solutions. Similar to cloud, the use of data integration architectural expertise should be a core part of the project. I see big data projects succeed and fail, and the biggest cause of failure is the lack of data integration expertise.

Even if not exposed to the client, a topic map based integration analysis of internal and external data records should give you a competitive advantage in future bids. After all you won’t have to re-interpret the data and all its fields, just the new ones or ones that have changed.

April 6, 2014

Eight (No, Nine!) Problems With Big Data

Filed under: BigData — Patrick Durusau @ 7:34 pm

Eight (No, Nine!) Problems With Big Data by Gary Marcus and Ernest Davis.

From the post:

The first thing to note is that although big data is very good at detecting correlations, especially subtle correlations that an analysis of smaller data sets might miss, it never tells us which correlations are meaningful. A big data analysis might reveal, for instance, that from 2006 to 2011 the United States murder rate was well correlated with the market share of Internet Explorer: Both went down sharply. But it’s hard to imagine there is any causal relationship between the two. Likewise, from 1998 to 2007 the number of new cases of autism diagnosed was extremely well correlated with sales of organic food (both went up sharply), but identifying the correlation won’t by itself tell us whether diet has anything to do with autism.

If you or your manager is drinking the “big data” kool-aid you may want to skip this article. Or if you stand to profit for the sale of “big data” appliances and/or services.

No point in getting confused about issues your clients aren’t likely to raise.

On the other hand, if you are a government employee who is tired of seeing the public coffers robbed for less than useful technology, you probably need to print out this article by Marcus and Davis.

Don’t quote from it but ask questions about any proposed “big data” project from each of the nine problem areas.

“Big data” and its tools have a lot of potential.

But consumers are responsible for preventing that potential being their pocketbooks.

Perhaps “caveat emptor” should now be written: “CAVEAT EMPTOR (Big Data).”

What do you think?

March 26, 2014

Big Data: Humans Required

Filed under: BigData,Semantics — Patrick Durusau @ 10:35 am

Big Data: Humans Required by Sherri Hammons.

From the post:

These simple examples outline the heart of the problem with data: interpretation. Data by itself is of little value. It is only when it is interpreted and understood that it begins to become information. GovTech recently wrote an article outlining why search engines will not likely replace actual people in the near future. If it were merely a question of pointing technology at the problem, we could all go home and wait for the Answer to Everything. But, data doesn’t happen that way. Data is very much like a computer: it will do just as it’s told. No more, no less. A human is required to really understand what data makes sense and what doesn’t. But, even then, there are many failed projects.

See Sherri’s post for a conversation overheard and a list of big data fallacies.

The same point has been made before but Sherri’s is a particularly good version of it.

Since it’s not news, at least to anyone who has been paying attention in the 20th – 21st century, the question becomes why do we keep making that same mistake over and over again?

That is relying on computers for “the answer” rather asking humans to setup the problem for a computer and to interpret the results.

Just guessing but I would say it has something to do with our wanting to avoid relying on other people. That in some manner, we are more independent, powerful, etc. if we can rely on machines instead of other people.

Here’s one example: Once upon a time if I wanted to hear Stabat Mater I would have to attend a church service and participate in its singing. In an age of iPods and similar devices, I can enjoy it in a cone of music that isolates me from my physical surrounding and people around me.

Nothing wrong with recorded music, but the transition from a communal, participatory setting to being in a passive, self-chosen sound cocoon seems lossy to me.

Can we say the current fascination with “big data” and the exclusion of people is also lossy?

Yes?

I first saw this in Nat Torkington’s Four short links: 18 March 2014.

March 24, 2014

Cosmology, Computers and the VisIVO package

Filed under: Astroinformatics,BigData — Patrick Durusau @ 7:58 pm

Cosmology, Computers and the VisIVO package by Bruce Berriman.

From the post:

vo

See Bruce’s post for details and resources on the VisIVO software package.

When some people talk about “big data,” they mean large amounts of repetitious log data. Big, but not complex.

Other “big data,” is not only larger, but also more complex. 😉

March 13, 2014

Audit Trails Anyone?

Filed under: Auditing,BigData,Semantics — Patrick Durusau @ 2:44 pm

Instrumenting collaboration tools used in data projects:Built-in audit trails can be useful for reproducing and debugging complex data analysis projects by Ben Lorica.

From the post:

As I noted in a previous post, model building is just one component of the analytic lifecycle. Many analytic projects result in models that get deployed in production environments. Moreover, companies are beginning to treat analytics as mission-critical software and have real-time dashboards to track model performance.

Once a model is deemed to be underperforming or misbehaving, diagnostic tools are needed to help determine appropriate fixes. It could well be models need to be revisited and updated, but there are instances when underlying data sources1 and data pipelines are what need to be fixed. Beyond the formal systems put in place specifically for monitoring analytic products, tools for reproducing data science workflows could come in handy.

Ben goes onto suggest that an “activity log” is a great idea for capturing a work flow for later analysis/debugging. And so it is, but I would go one step further and capture some of the semantics of the work flow.

I knew a manager who had a “cheat sheet” of report writer jobs to run every month. They would pull the cheat sheet, enter the commands and produce the report. They were a roadblock to ever changing the system because then the “cheatsheet” would not work.

I am sure none of you have ever encountered the same situation. But I have seen it in at least one case.

February 25, 2014

NOAA Moves to Unleash “Big Data”…

Filed under: BigData,NOAA — Patrick Durusau @ 3:37 pm

NOAA Moves to Unleash “Big Data” and Calls Upon American Companies to Help by Kathryn Sullivan, Ph.D., Acting Undersecretary of Commerce for Oceans and Atmosphere and Acting NOAA Administrator.

RFI: Deadline March 24, 2014.

From the post:

From the surface of the sun to the depths of the ocean floor, the National Oceanic and Atmospheric Administration (NOAA), part of the Department of Commerce, works to keep citizens informed about the changing environment around them. Our vast network of radars, satellites, buoys, ships, aircraft, tide gauges, and supercomputers keeps tabs on the condition of our planet’s health and provides critical data that are used to predict changes in climate, weather, oceans, and coastlines. As we continue to witness changes on this dynamic planet we call home, the demand for NOAA’s data is only increasing.

Quite simply, NOAA is the quintessential big data agency. Each day, NOAA collects, analyzes, and generates over 20 terabytes of data – twice the amount of data than what is in the United States Library of Congress’ entire printed collection. However, only a small percentage is easily accessible to the public.

NOAA is not the only Commerce agency with a treasure trove of valuable information. The economic and demographic statistics from the Census Bureau, for example, inform business decisions every day. According to a 2013 McKinsey Global Institute Report, open data could add more than $3 trillion in total value annually to the education, transportation, consumer products, electricity, oil and gas, health care, and consumer finance sectors worldwide. That is why U.S. Secretary of Commerce Penny Pritzker has made unleashing the power of Commerce data one of the top priorities of the Department’s “Open for Business Agenda.”

All of that to lead up to:

That’s why we have released a Request for Information (RFI) to help us explore the feasibility of this concept and the range of possibilities to accomplish our goal. At no cost to taxpayers, this RFI calls upon the talents of America’s best minds to help us find the data and IT delivery solutions they need and should have.

This was released on February 21, 2014, so at best, potential responders had a maximum of thirty-two (32) days to respond to an RFI which describes the need and data sets in the broadest possible terms.

The “…no cost to taxpayers…” is particularly ironic, since anyone re-marketing the data to the public isn’t going to do so for free. Some public projects may but not the commercial vendors.

A better strategy would be for NOAA to release 10% of each distinct data set collected over the past two years at a cloud download location along with its documentation. Indicate how much data exists for each data set, the project, contact details.

Let real users and commercial vendors rummage through the 10% data to see what is of interest, how it can be processed, etc.

If NOAA wants real innovation, stop trying to manage it.

Managed innovation gets you Booz Allen type results. Is that what you want?

February 24, 2014

I expected a Model T, but instead I got a loom:…

Filed under: BigData,Marketing — Patrick Durusau @ 2:37 pm

I expected a Model T, but instead I got a loom: Awaiting the second big data revolution by Mark Huberty.

Abstract:

Big data” has been heralded as the agent of a third industrial revolution{one with raw materials measured in bits, rather than tons of steel or barrels of oil. Yet the industrial revolution transformed not just how firms made things, but the fundamental approach to value creation in industrial economies. To date, big data has not achieved this distinction. Instead, today’s successful big data business models largely use data to scale old modes of value creation, rather than invent new ones altogether. Moreover, today’s big data cannot deliver the promised revolution. In this way, today’s big data landscape resembles the early phases of the first industrial revolution, rather than the culmination of the second a century later. Realizing the second big data revolution will require fundamentally di fferent kinds of data, diff erent innovations, and diff erent business models than those seen to date. That fact has profound consequences for the kinds of investments and innovations firms must seek, and the economic, political, and social consequences that those innovations portend.

From the introduction:

Four assumptions need special attention: First, N = all, or the claim that our data allow a clear and unbiased study of humanity; second, that today equals tomorrow, or the claim that understanding online behavior today implies that we will still understand it tomorrow; third, that understanding online behavior off ers a window into offine behavior; and fourth, that complex patterns of social behavior, once understood, will remain stable enough to become the basis of new data-driven, predictive products and services. Each of these has its issues. Taken together, those issues limit the future of a revolution that relies, as today’s does, on the \digital exhaust” of social networks, e-commerce, and other online services. The true revolution must lie elsewhere.

Mark makes a compelling case for most practices with “Big Data” are more of same, writ large, as opposed to something completely different.

Topic mappers can take heart from this passage:

Online behavior is a culmination of culture, language, social norms and other factors that shape both people and how they express their identity. These factors are in constant flux. The controversies and issues of yesterday are not those of tomorrow; the language we used to discuss anger, love, hatred, or envy change. The pathologies that afflict humanity may endure, but the ways we express them do not.

The only place where Mark loses me is in the argument that because our behavior changes, it cannot be predicted. Advertisers have been predicting human behavior long enough that they do miss, still, but they hit more than they miss.

Mark mentions Google but in terms of advertising, Google is the kid with a lemonade stand when compared to traditional advertisers.

One difference between Google advertising and traditional advertising is Google has limited itself to online behavior in constructing a model for its ads. Traditional advertisers measure every aspect of their target audience that is possible to measure.

Not to mention that traditional advertising is non-rational. That is traditional advertising will use whatever images, themes, music, etc., that has been shown to make a difference in sales. How that relates to the product or a rational basis for purchasing, is irrelevant.

If you don’t read any other long papers this week, you need to read this one.

Then ask yourself: What new business, data or technologies are you bringing to the table?

I first saw this in a tweet by Joseph Reisinger.

February 23, 2014

How Companies are Using Spark

Filed under: BigData,Hadoop,Spark — Patrick Durusau @ 7:50 pm

How Companies are Using Spark, and Where the Edge in Big Data Will Be by Matei Zaharia.

Description:

While the first big data systems made a new class of applications possible, organizations must now compete on the speed and sophistication with which they can draw value from data. Future data processing platforms will need to not just scale cost-effectively; but to allow ever more real-time analysis, and to support both simple queries and today’s most sophisticated analytics algorithms. Through the Spark project at Apache and Berkeley, we’ve brought six years research to enable real-time and complex analytics within the Hadoop stack.

At time mark 1:53, Matei says when size of storage is no longer an advantage, you can gain an advantage by:

Speed: how quickly can you go from data to decisions?

Sophistication: can you run the best algorithms on the data?

As you might suspect, I strongly disagree that those are the only two points where you can gain an advantage with Big Data.

How about including:

Data Quality: How do you make data semantics explicit?

Data Management: Can you re-use data by knowing its semantics?

You can run sophisticated algorithms on data and make quick decisions, but if your data is GIGO (garbage in, garbage out), I don’t see the competitive edge.

Nothing against Spark, managing video streams with only 1 second of buffering was quite impressive.

To be fair, Matei does include ClearStoryData as one of his examples and ClearStory says that they merge data based in its semantics. Unfortunately, the website doesn’t mention any details other than there is a “patent pending.”

But in any event, I do think data quality and data management should be explicit items in any big data strategy.

At least so long as you want big data and not big garbage.

February 15, 2014

Creating A Galactic Plane Atlas With Amazon Web Services

Filed under: Amazon Web Services AWS,Astroinformatics,BigData — Patrick Durusau @ 1:59 pm

Creating A Galactic Plane Atlas With Amazon Web Services by Bruce Berriman, el. al.

Abstract:

This paper describes by example how astronomers can use cloud-computing resources offered by Amazon Web Services (AWS) to create new datasets at scale. We have created from existing surveys an atlas of the Galactic Plane at 16 wavelengths from 1 μm to 24 μm with pixels co- registered at spatial sampling of 1 arcsec. We explain how open source tools support management and operation of a virtual cluster on AWS platforms to process data at scale, and describe the technical issues that users will need to consider, such as optimization of resources, resource costs, and management of virtual machine instances.

In case you are interesting in taking your astronomy hobby to the next level with AWS.

And/or gaining experience with AWS and large datasets.

Data-Driven Discovery Initiative

Filed under: BigData,Data Science,Funding — Patrick Durusau @ 10:03 am

Data-Driven Discovery Initiative

Pre-Applications Due February 24, 2014 by 5 pm Pacific Time.

15 Awards at $1,500,000 each, at $200K-$300K/year for five years.

From the post:

Our Data-Driven Discovery Initiative seeks to advance the people and practices of data-intensive science, to take advantage of the increasing volume, velocity, and variety of scientific data to make new discoveries. Within this initiative, we’re supporting data-driven discovery investigators – individuals who exemplify multidisciplinary, data-driven science, coalescing natural sciences with methods from statistics and computer science.

These innovators are striking out in new directions and are willing to take risks with the potential of huge payoffs in some aspect of data-intensive science. Successful applicants must make a strong case for developments in the natural sciences (biology, physics, astronomy, etc.) or science enabling methodologies (statistics, machine learning, scalable algorithms, etc.), and applicants that credibly combine the two are especially encouraged. Note that the Science Program does not fund disease targeted research.

It is anticipated that the DDD initiative will make about 15 awards at ~$1,500,000 each, at $200K-$300K/year for five years.

Pre-applications are due Monday, February 24, 2014 by 5 pm Pacific Time. To begin the pre-application process, click the “Apply Here” button above. We expect to extend invitations for full applications in April 2014. Full applications will be due five weeks after the invitation is sent, currently anticipated for mid-May 2014.

Apply Here

If you are interested in leveraging topic maps in your application, give me a call!

As far as I know, topic maps remain the only technology that documents the basis for merging distinct representations of the same subject.

Mappings, such as you find in Talend and other enterprise data management technologies, is great, so long as you don’t care why a particular mapping was done.

And in many cases, it may not matter. When you are exporting one time mailing list for a media campaign. It’s going to be discarded upon use so who cares?

In other cases, where labor intensive work is required to discover the “why” of a prior mapping, documenting that “why” would be useful.

Topic maps can document as much or as little of the semantics of your data and data processing stack as you desire. Topic maps can’t make legacy data and data semantic issues go away, but they can become manageable.

February 13, 2014

Mining of Massive Datasets 2.0

Filed under: BigData,Data Mining,Graphs,MapReduce — Patrick Durusau @ 3:29 pm

Mining of Massive Datasets 2.0

From the webpage:

The following is the second edition of the book, which we expect to be published soon. We have added Jure Leskovec as a coauthor. There are three new chapters, on mining large graphs, dimensionality reduction, and machine learning.

There is a revised Chapter 2 that treats map-reduce programming in a manner closer to how it is used in practice, rather than how it was described in the original paper. Chapter 2 also has new material on algorithm design techniques for map-reduce.

Aren’t you wishing for more winter now? 😉

I first saw this in a tweet by Gregory Piatetsky.

February 5, 2014

Speeding Up Big Data

Filed under: BigData,Flash Storage — Patrick Durusau @ 1:41 pm

Novel Storage Technique Speeds Big Data Processing by Tiffany Trader.

From the post:

Between the data deluge and the proliferation of uber-connected devices, the amount of data that must be stored and processed has exploded to a mind-boggling degree. One commonly cited statistic from Google Chairman Eric Schmidt holds that every two days humankind creates as much information as it did from the dawn of civilization up until 2003.

“Big data” technologies have evolved to get a handle on this information overload, but in order to be useful, the data must be stored in such a way that it is easily retrieved when needed. Until now, high-capacity, low-latency storage architectures have only been available on very high-end systems, but recently a group of MIT scientists have proposed an alternative approach, a novel high-performance storage architecture they call BlueDB (Blue Database Machine) that aims to accelerate the processing of very large datasets.

The researchers from MIT’s Department of Electrical Engineering and Computer Science have written about their work in a paper titled Scalable Multi-Access Flash Store for Big Data Analytics.
….

See the paper for a low-level view and Tiffany’s post for a high-level one.

BTW, the result of this research, BlueDB, will b e demonstrated at the International Symposium on Field-Programmable Gate Arrays in Monterey, California.

A good time to start thinking about how data structures have been influenced by storage speed.

Is normalization a useful optimization with < 1 billion records? Maybe today, but what about six months from now?

I first saw this in a tweet by Stefano Bertolo.

February 4, 2014

Sex and Big Data

Filed under: BigData,Porn — Patrick Durusau @ 8:31 pm

Sex and Big Data

A project to bring big data techniques to sexuality.

Datasets:

XHamster – approximately 800,000 entries.

Xnxx – approximately 1,200,000 entries.

I may have just missed it but you would expect a set of records from the porn videos on YouTube and Reddit. To say nothing of UseNet in the alt-sex-* groups.

Maybe I should post a note to the NSA. I am sure they have already cleaned and reconciled the data. Maybe they will post it as a public service. 😉

February 3, 2014

Big Data’s Dangerous New Era of Discrimination

Filed under: BigData,Data Analysis — Patrick Durusau @ 3:16 pm

Big Data’s Dangerous New Era of Discrimination by Michael Schrage.

From the post:

Congratulations. You bought into Big Data and it’s paying off Big Time. You slice, dice, parse and process every screen-stroke, clickstream, Like, tweet and touch point that matters to your enterprise. You now know exactly who your best — and worst — customers, clients, employees and partners are. Knowledge is power. But what kind of power does all that knowledge buy?

Big Data creates Big Dilemmas. Greater knowledge of customers creates new potential and power to discriminate. Big Data — and its associated analytics — dramatically increase both the dimensionality and degrees of freedom for detailed discrimination. So where, in your corporate culture and strategy, does value-added personalization and segmentation end and harmful discrimination begin?

If you credit Robert Jackall’s Moral mazes : the world of corporate managers, Oxford, 1988, moral issues are bracketed in favor of pragmatism and group loyalty.

There was no shortage of government or corporate scandals running up to 1988 and there has been no shortage since then that fit well into Jackdall’s framework.

An evil doer may start a wrongful act but a mass scandal requires non-objection if not active assistance from a multitude that knows wrong doing is afoot.

Unlike Michael, I don’t think management will be interested in “fairly transparent” and/or “transparently fair” algorithms and analytics. Unless that serves some other goal or purpose of the organization.

January 27, 2014

The Sonification Handbook

Filed under: BigData,Data Mining,Music,Sonification,Sound — Patrick Durusau @ 5:26 pm

The Sonification Handbook. Edited by Thomas Hermann, Andy Hunt, John G. Neuhoff. (Logos Publishing House, Berlin 2011, 586 pages, 1. edition (11/2011) ISBN 978-3-8325-2819-5)

Summary:

This book is a comprehensive introductory presentation of the key research areas in the interdisciplinary fields of sonification and auditory display. Chapters are written by leading experts, providing a wide-range coverage of the central issues, and can be read from start to finish, or dipped into as required (like a smorgasbord menu).

Sonification conveys information by using non-speech sounds. To listen to data as sound and noise can be a surprising new experience with diverse applications ranging from novel interfaces for visually impaired people to data analysis problems in many scientific fields.

This book gives a solid introduction to the field of auditory display, the techniques for sonification, suitable technologies for developing sonification algorithms, and the most promising application areas. The book is accompanied by the online repository of sound examples.

The text has this advice for readers:

The Sonification Handbook is intended to be a resource for lectures, a textbook, a reference, and an inspiring book. One important objective was to enable a highly vivid experience for the reader, by interleaving as many sound examples and interaction videos as possible. We strongly recommend making use of these media. A text on auditory display without listening to the sounds would resemble a book on visualization without any pictures. When reading the pdf on screen, the sound example names link directly to the corresponding website at http://sonification.de/handbook. The margin symbol is also an active link to the chapter’s main page with supplementary material. Readers of the printed book are asked to check this website manually.

Did I mention the entire text, all 586 pages, can be downloaded for free?

Here’s an interesting idea: What if you had several dozen workers listening to sonofied versions of the same data stream, listening along different dimensions for changes in pitch or tone? When heard, each user signals the change. When some N of the dimensions all have a change at the same time, the data set is pulled at that point for further investigation.

I will regret suggesting that idea. Someone from a leading patent holder will boilerplate an application together tomorrow and file it with the patent office. 😉

January 20, 2014

Lap Dancing With Big Data

Filed under: BigData,Data,Data Analysis — Patrick Durusau @ 4:27 pm

Real scientists make their own data by Sean J. Taylor.

From the first list in the post:

4. If you are the creator of your data set, then you are likely to have a great understanding the data generating process. Blindly downloading someone’s CSV file means you are much more likely to make assumptions which do not hold in the data.

A good point among many good points.

Sean provides guidance on how you can collect data, not just have it dumped on you.

Or as Kaiser Fung says in the post that lead me to Sean’s:

In theory, the availability of data should improve our ability to measure performance. In reality, the measurement revolution has not taken place. It turns out that measuring performance requires careful design and deliberate collection of the right types of data — while Big Data is the processing and analysis of whatever data drops onto our laps. Ergo, we are far from fulfilling the promise.

So, do you make your own data?

Or do you lap dance with data?

I know which one I aspire to.

You?

January 17, 2014

Data-Driven Discovery Initiative

Filed under: BigData,Data Science — Patrick Durusau @ 4:12 pm

Data-Driven Discovery Initiative

Pre-applications due: Monday, February 24, 2014 by 5 pm Pacific Time

From the webpage:

Our Data-Driven Discovery Initiative seeks to advance the people and practices of data-intensive science, to take advantage of the increasing volume, velocity, and variety of scientific data to make new discoveries. Within this initiative, we’re supporting data-driven discovery investigators – individuals who exemplify multidisciplinary, data-driven science, coalescing natural sciences with methods from statistics and computer science.

These innovators are striking out in new directions and are willing to take risks with the potential of huge payoffs in some aspect of data-intensive science. Successful applicants must make a strong case for developments in the natural sciences (biology, physics, astronomy, etc.) or science enabling methodologies (statistics, machine learning, scalable algorithms, etc.), and applicants that credibly combine the two are especially encouraged. Note that the Science Program does not fund disease targeted research.

It is anticipated that the DDD initiative will make about 15 awards at ~$1,500,000 each, at $200K-$300K/year for five years.

Be aware, you must be an employee of a PhD-granting institution or a private research institute in the United States to apply.

Open Educational Resources for Biomedical Big Data

Filed under: BigData,Bioinformatics,Biomedical,Funding — Patrick Durusau @ 3:38 pm

Open Educational Resources for Biomedical Big Data (R25)

Deadline for submission: April 1, 2014

Additional information: bd2k_training@mail.nih.gov

As part of the NIH Big Data to Knowledge (BD2K) project, BD2K R25 FOA will support:

Curriculum or Methods Development of innovative open educational resources that enhance the ability of the workforce to use and analyze biomedical Big Data.

The challenges:

The major challenges to using biomedical Big Data include the following:

Locating data and software tools: Investigators need straightforward means of knowing what datasets and software tools are available and where to obtain them, along with descriptions of each dataset or tool. Ideally, investigators should be able to easily locate all published and resource datasets and software tools, both basic and clinical, and, to the extent possible, unpublished or proprietary data and software.

Gaining access to data and software tools: Investigators need straightforward means of 1) releasing datasets and metadata in standard formats; 2) obtaining access to specific datasets or portions of datasets; 3) studying datasets with the appropriate software tools in suitable environments; and 4) obtaining analyzed datasets.

Standardizing data and metadata: Investigators need data to be in standard formats to facilitate interoperability, data sharing, and the use of tools to manage and analyze the data. The datasets need to be described by standard metadata to allow novel uses as well as reuse and integration.

Sharing data and software: While significant progress has been made in broad and rapid sharing of data and software, it is not yet the norm in all areas of biomedical research. More effective data- and software-sharing would be facilitated by changes in the research culture, recognition of the contributions made by data and software generators, and technical innovations. Validation of software to ensure quality, reproducibility, provenance, and interoperability is a notable goal.

Organizing, managing, and processing biomedical Big Data: Investigators need biomedical data to be organized and managed in a robust way that allows them to be fully used; currently, most data are not sufficiently well organized. Barriers exist to releasing, transferring, storing, and retrieving large amounts of data. Research is needed to design innovative approaches and effective software tools for organizing biomedical Big Data for data integration and sharing while protecting human subject privacy.

Developing new methods for analyzing biomedical Big Data: The size, complexity, and multidimensional nature of many datasets make data analysis extremely challenging. Substantial research is needed to develop new methods and software tools for analyzing such large, complex, and multidimensional datasets. User-friendly data workflow platforms and visualization tools are also needed to facilitate the analysis of Big Data.

Training researchers for analyzing biomedical Big Data: Advances in biomedical sciences using Big Data will require more scientists with the appropriate data science expertise and skills to develop methods and design tools, including those in many quantitative science areas such as computational biology, biomedical informatics, biostatistics, and related areas. In addition, users of Big Data software tools and resources must be trained to utilize them well.

Another big data biomedical data integration funding opportunity!

I do wonder about the suggestion:

The datasets need to be described by standard metadata to allow novel uses as well as reuse and integration.

Do they mean:

“Standard” metadata for a particular academic lab?

“Standard” metadata for a particular industry lab?

“Standard” metadata for either one five (5) years ago?

“Standard” metadata for either one (5) years from now?

The problem being the familiar one that knowledge that isn’t moving forward is outdated.

It’s hard to do good research with outdated information.

Making metadata dynamic, so that it reflects yesterday’s terminology, today’s and someday tomorrow’s, would be far more useful.

The metadata displayed to any user would be their choice of metadata and not the complexities that make the metadata dynamic.

Interested?

January 16, 2014

Courses for Skills Development in Biomedical Big Data Science

Filed under: BigData,Bioinformatics,Biomedical,Funding — Patrick Durusau @ 6:45 pm

Courses for Skills Development in Biomedical Big Data Science

Deadline for submission: April 1, 2014

Additional information: bd2k_training@mail.nih.gov

As part of the NIH Big Data to Knowledge (BD2K) the purpose of BD2K R25 FOA will support:

Courses for Skills Development in topics necessary for the utilization of Big Data, including the computational and statistical sciences in a biomedical context. Courses will equip individuals with additional skills and knowledge to utilize biomedical Big Data.

Challenges in biomedical Big Data?

The major challenges to using biomedical Big Data include the following:

Locating data and software tools: Investigators need straightforward means of knowing what datasets and software tools are available and where to obtain them, along with descriptions of each dataset or tool. Ideally, investigators should be able to easily locate all published and resource datasets and software tools, both basic and clinical, and, to the extent possible, unpublished or proprietary data and software.

Gaining access to data and software tools: Investigators need straightforward means of 1) releasing datasets and metadata in standard formats; 2) obtaining access to specific datasets or portions of datasets; 3) studying datasets with the appropriate software tools in suitable environments; and 4) obtaining analyzed datasets.

Standardizing data and metadata: Investigators need data to be in standard formats to facilitate interoperability, data sharing, and the use of tools to manage and analyze the data. The datasets need to be described by standard metadata to allow novel uses as well as reuse and integration.

Sharing data and software: While significant progress has been made in broad and rapid sharing of data and software, it is not yet the norm in all areas of biomedical research. More effective data- and software-sharing would be facilitated by changes in the research culture, recognition of the contributions made by data and software generators, and technical innovations. Validation of software to ensure quality, reproducibility, provenance, and interoperability is a notable goal.

Organizing, managing, and processing biomedical Big Data: Investigators need biomedical data to be organized and managed in a robust way that allows them to be fully used; currently, most data are not sufficiently well organized. Barriers exist to releasing, transferring, storing, and retrieving large amounts of data. Research is needed to design innovative approaches and effective software tools for organizing biomedical Big Data for data integration and sharing while protecting human subject privacy.

Developing new methods for analyzing biomedical Big Data: The size, complexity, and multidimensional nature of many datasets make data analysis extremely challenging. Substantial research is needed to develop new methods and software tools for analyzing such large, complex, and multidimensional datasets. User-friendly data workflow platforms and visualization tools are also needed to facilitate the analysis of Big Data.

Training researchers for analyzing biomedical Big Data: Advances in biomedical sciences using Big Data will require more scientists with the appropriate data science expertise and skills to develop methods and design tools, including those in many quantitative science areas such as computational biology, biomedical informatics, biostatistics, and related areas. In addition, users of Big Data software tools and resources must be trained to utilize them well.

It’s hard to me to read that list and not see subject identity as playing some role in meeting all of those challenges. Not a complete solution because there are a variety of problems in each challenge. But to preserve access to data sets over time, issues and approaches, subject identity is a necessary component of any solution.

Applicants have to be institutions of higher education but I assume they can hire expertise as required.

January 15, 2014

Vega

Filed under: BigData,Graphics,Visualization,XDATA — Patrick Durusau @ 4:40 pm

Vega

From the webpage:

Vega is a visualization grammar, a declarative format for creating, saving and sharing visualization designs.

With Vega you can describe data visualizations in a JSON format, and generate interactive views using either HTML5 Canvas or SVG.

Read the tutorial, browse the documentation, join the discussion, and explore visualizations using the web-based Vega Editor.

vega.min.js (120K)

Source (GitHub)

Of interest mostly because of its use with XDATA@Kitware for example.

XDATA@Kitware

Filed under: BigData,Data Analysis,Graphs,Vega,Virtualization,XDATA — Patrick Durusau @ 4:21 pm

XDATA@Kitware Big data unlocked, with the power of the Web.

From the webpage:

XDATA@Kitware is the engineering and research effort of a DARPA XDATA visualization team consisting of expertise from Kitware, Inc., Harvard University, University of Utah, Stanford University, Georgia Tech, and KnowledgeVis, LLC. XDATA is a DARPA-funded project to develop big data analysis and visualization solutions through utilizing and expanding open-source frameworks.

We are in the process of developing the Visualization Design Environment (VDE), a powerful yet intuitive user interface that will enable rapid development of visualization solutions with no programming required, using the Vega visualization grammar. The following index of web apps, hosted on the modular and flexible Tangelo web server framework, demonstrates some of the capabilities these tools will provide to solve a wide range of big data problems.

Examples:

Document Entity Relationships: Discover the network of named entities hidden within text documents

SSCI Predictive Database: Explore the progression of table partitioning in a predictive database.

Enron: Enron email visualization.

Flickr Metadata Maps: Explore the locations where millions of Flickr photos were taken

Biofabric Graph Visualization: An implementation of the Biofabric algorithm for visualizing large graphs.

SFC (Safe for c-suite) if you are there to explain them.

Related:

Vega (Trifacta, Inc.) – A visualization grammar, based on JSON, for specifying and representing visualizations.

Hardware for Big Data, Graphs and Large-scale Computation

Filed under: BigData,GPU,Graphs,NVIDIA — Patrick Durusau @ 2:51 pm

Hardware for Big Data, Graphs and Large-scale Computation by Rob Farber.

From the post:

Recent announcements by Intel and NVIDIA indicate that massively parallel computing with GPUs and Intel Xeon Phi will no longer require passing data via the PCIe bus. The bad news is that these standalone devices are still in the design phase and are not yet available for purchase. Instead of residing on the PCIe bus as a second-class system component like a disk or network controller, the new Knights Landing processor announced by Intel at ISC’13 will be able to run as a standalone processor just like a Sandy Bridge or any other multi-core CPU. Meanwhile, NVIDIA’s release of native ARM compilation in CUDA 5.5 provides a necessary next step toward Project Denver, which is NVIDIAs integration of a 64-bit ARM processor and a GPU. This combination, termed a CP-GP (or ceepee-geepee) in the media, can leverage the energy savings and performance of both architectures.

Of course, the NVIDIA strategy also opens the door to the GPU acceleration of mobile phone and other devices in the ARM dominated low-power, consumer and real-time markets. In the near 12- to 24-month timeframe, customers should start seeing big-memory standalone systems based on Intel and NVIDIA technology that only require power and a network connection. The need for a separate x86 computer to host one or more GPU or Intel Xeon Phi coprocessors will no longer be a requirement.

The introduction of standalone GPU and Intel Xeon Phi devices will affect the design decisions made when planning the next generation of leadership class supercomputers, enterprise data center procurements, and teraflop/s workstations. It also will affect the software view in programming these devices, because the performance limitations of the PCIe bus and the need to work with multiple memory spaces will no longer be compulsory.

Ray provides a great peek at hardware that is coming and current high performance computing, in particular, processing graphs.

Resources mentioned in Rob’s post without links:

Rob’s Intel Xeon Phi tutorial at Dr. Dobbs:

Programming Intel’s Xeon Phi: A Jumpstart Introduction

CUDA vs. Phi: Phi Programming for CUDA Developers

Getting to 1 Teraflop on the Intel Phi Coprocessor

Numerical and Computational Optimization on the Intel Phi

Rob’s GPU Technology Conference presentations:

Simplifying Portable Killer Apps with OpenACC and CUDA-5 Concisely and Efficiently.

Clicking GPUs into a Portable, Persistent and Scalable Massive Data Framework.

(The links are correct but put you one presentation below Rob’s. Scroll up one. Sorry. It was that or use an incorrect link to put you at the right location.)

mpgraph (part of XDATA)

Other resources you may find of interest:

Ray Farber – Dr. Dobbs – Current article listing.

Hot-Rodding Windows and Linux App Performance with CUDA-Based Plugins by Rob Farber (with source code for Windows and Linux).

Ray Farber’s wiki: http://gpucomputing.net/ (Warning: The site seems to be flaky. If it doesn’t load, try again.)

OpenCL (Khronos)

Ray Farber’s Code Project tutorials:

(Part 9 was published in February of 2012. Some updating may be necessary.)

January 12, 2014

Sense Preview

Filed under: BigData,Cloud Computing,Collaboration,Sense — Patrick Durusau @ 3:00 pm

Sense is in private beta but you can request an invitation.

Even though the presentation is well rehearsed, this is pretty damned impressive!

The bar for cloud based computing continues to rise.

Follow @senseplatform.

I first saw this at Danny Bickson’s Sense: collaborative data science in the cloud

PS: Learn more about Sense at the 3rd GraphLab Conference.

January 10, 2014

The Cloudera Developer Newsletter: It’s For You!

Filed under: BigData,Cloudera,Hadoop — Patrick Durusau @ 12:01 pm

The Cloudera Developer Newsletter: It’s For You! by Justin Kestelyn.

From the post:

Developers and data scientists, we’re realize you’re special – as are operators and analysts, in their own particular ways.

For that reason, we are very happy to kick off 2014 with a new free service designed for you and other technical end-users in the Cloudera ecosystem: the Cloudera Developer Newsletter.

This new email-based newsletter contains links to a curated list of new how-to’s, docs, tools, engineer and community interviews, training, projects, conversations, videos, and blog posts to help you get a new Apache Hadoop-based enterprise data hub deployment off the ground, or get the most value out of an existing deployment. Look for a new issue every month!

All you have you to do is click the button below, provide your name and email address, tick the “Developer Community” check-box, and submit. Done! (Of course, you can also opt-in to several other communication channels if you wish.)

The first newsletter is due to appear at the end of January, 2014.

Given the quality of other Cloudera resources I look forward to this newsletter with anticipation!

January 8, 2014

BigDataBench:…

Filed under: Benchmarks,BigData — Patrick Durusau @ 11:07 am

BigDataBench: a Big Data Benchmark Suite from Internet Services by Lei Wang, et.al.

Abstract:

As architecture, systems, and data management communities pay greater attention to innovative big data systems and architecture, the pressure of benchmarking and evaluating these systems rises. However, the complexity, diversity, frequently changed workloads, and rapid evolution of big data systems raise great challenges in big data benchmarking. Considering the broad use of big data systems, for the sake of fairness, big data benchmarks must include diversity of data and workloads, which is the prerequisite for evaluating big data systems and architecture. Most of the state-of-the-art big data benchmarking efforts target evaluating specific types of applications or system software stacks, and hence they are not qualified for serving the purposes mentioned above.

This paper presents our joint research efforts on this issue with several industrial partners. Our big data benchmark suite—BigDataBench not only covers broad application scenarios, but also includes diverse and representative data sets. Currently, we choose 19 big data benchmarks from dimensions of application scenarios, operations/ algorithms, data types, data sources, software stacks, and application types, and they are comprehensive for fairly measuring and evaluating big data systems and architecture. BigDataBench is publicly available from the project home page http://prof.ict.ac.cn/BigDataBench.

Also, we comprehensively characterize 19 big data workloads included in BigDataBench with varying data inputs. On a typical state-of-practice processor, Intel Xeon E5645, we have the following observations: First, in comparison with the traditional benchmarks: including PARSEC, HPCC, and SPECCPU, big data applications have very low operation intensity, which measures the ratio of the total number of instructions divided by the total byte number of memory accesses; Second, the volume of data input has non-negligible impact on micro-architecture characteristics, which may impose challenges for simulation-based big data architecture research; Last but not least, corroborating the observations in CloudSuite and DCBench (which use smaller data inputs), we find that the numbers of L1 instruction cache (L1I) misses per 1000 instructions (in short, MPKI) of the big data applications are higher than in the traditional benchmarks; also, we find that L3 caches are effective for the big data applications, corroborating the observation in DCBench.

An excellent summary of current big data benchmarks along with datasets and diverse benchmarks for varying big data inputs.

I emphasize diverse because we have all known “big data” covers a wide variety of data. Unfortunately, that hasn’t always been a point of emphasis. This paper corrects that oversight.

The User_Manual for Big Data Bench 2.1.

Summaries of the data sets and benchmarks:

No. data sets data size

1

Wikipedia Entries

4,300,000 English articles

2

Amazon Movie Reviews

7,911,684 reviews

3

Google Web Graph

875713 nodes, 5105039 edges

4

Facebook Social Network

4039 nodes, 88234 edges

5

E-commerce Transaction Data

table1: 4 columns, 38658 rows.

table2: 6 columns, 242735 rows

6

ProfSearch Person Resumes

278956 resumes


Table 2: The Summary of BigDataBench

Application Scenarios

Operations & Algorithm

Data Type

Data Source

Software stack

Application type

Micro Benchmarks

Sort

Unstructured

Text

MapReduce, Spark, MPI

Offline Analytics

Grep

Unstructured

Text

MapReduce, Spark, MPI

Offline Analytics

WordCount

Unstructured

Text

MapReduce, Spark, MPI

Offline Analytics

BFS

Unstructured

Graph

MapReduce, Spark, MPI

Offline Analytics

Basic Datastore Operations (“Cloud OLTP”)

Read

Semi-structured

Table

Hbase, Cassandra, MongoDB, MySQL

Online Service

Write

Semi-structured

Table

Hbase, Cassandra, MongoDB, MySQL

Online Services

Scan

Semi-structured

Table

Hbase, Cassandra, MongoDB, MySQL

Online Services

Relational Query

Select Query

Structured

Table

Impala, Shark, MySQL, Hive

Realtime Analytics

Aggregate Query

Structured

Table

Impala, Shark, MySQL, Hive

Realtime Analytics

Join Query

Structured

Table

Impala, Shark, MySQL, Hive

Realtime Analytics

Search Engine

Nutch Server

Structured

Table

Hadoop

Online Services

PageRank

Unstructured

Graph

Hadoop, MPI, Spark

Offline Analytics

Index

Unstructured

Text

Hadoop, MPI, Spark

Offline Analytics

Social Network

Olio Server

Structured

Table

MySQL

Online Service

K-means

Unstructured

Graph

Hadoop, MPI, Spark

Offline Analytics

Connected Com-ponents

Unstructured

Graph

Hadoop, MPI, Spark

Offline Analytics

E-commerce

Rubis Server

Structured

Table

MySQL

Online Service

Collaborative Filtering

Unstructured

Text

Hadoop, MPI, Spark

Offline Analytics

Naive Bayes

Unstructrued

Text

Hadoop, MPI, Spark

Offline Analytics

I first saw this in a tweet by Stefano Bertolo.

January 4, 2014

How NetFlix Reverse Engineered Hollywood [+ Perry Mason Mystery]

Filed under: BigData,Data Analysis,Data Mining,Web Scrapers — Patrick Durusau @ 4:47 pm

How NetFlix Reverse Engineered Hollywood by Alexis C. Madrigal.

From the post:

If you use Netflix, you’ve probably wondered about the specific genres that it suggests to you. Some of them just seem so specific that it’s absurd. Emotional Fight-the-System Documentaries? Period Pieces About Royalty Based on Real Life? Foreign Satanic Stories from the 1980s?

If Netflix can show such tiny slices of cinema to any given user, and they have 40 million users, how vast did their set of “personalized genres” need to be to describe the entire Hollywood universe?

This idle wonder turned to rabid fascination when I realized that I could capture each and every microgenre that Netflix’s algorithm has ever created.

Through a combination of elbow grease and spam-level repetition, we discovered that Netflix possesses not several hundred genres, or even several thousand, but 76,897 unique ways to describe types of movies.

There are so many that just loading, copying, and pasting all of them took the little script I wrote more than 20 hours.

We’ve now spent several weeks understanding, analyzing, and reverse-engineering how Netflix’s vocabulary and grammar work. We’ve broken down its most popular descriptions, and counted its most popular actors and directors.

To my (and Netflix’s) knowledge, no one outside the company has ever assembled this data before.

What emerged from the work is this conclusion: Netflix has meticulously analyzed and tagged every movie and TV show imaginable. They possess a stockpile of data about Hollywood entertainment that is absolutely unprecedented. The genres that I scraped and that we caricature above are just the surface manifestation of this deeper database.

If you like data mining war stories in detail, then you will love this post by Alexis.

Along the way you will learn about:

  • Ubot Studio – Web scraping.
  • AntConc – Linguistic software.
  • Exploring other information to infer tagging practices.
  • More details about Netflix genres in general terms.

Be sure to read to the end to pick up on the Perry Mason mystery.

The Perry Mason mystery:

Netflix’s Favorite Actors (by number of genres)

  1. Raymond Burr (who played Perry Mason)
  2. Bruce Willis
  3. George Carlin
  4. Jackie Chan
  5. Andy Lau
  6. Robert De Niro
  7. Barbara Hale (also on Perry Mason)
  8. Clint Eastwood
  9. Elvis Presley
  10. Gene Autry

Question: Why is Raymond Burr in more genres than any other actor?

Some additional reading for this post: Sellling Blue Elephants

Just as a preview, the “Blue Elephants” book/site is about selling what consumers want to buy. Not about selling what you think is a world saving idea. Those are different. Sometimes very different.

I first saw this in a tweet by Gregory Piatetsky.

January 2, 2014

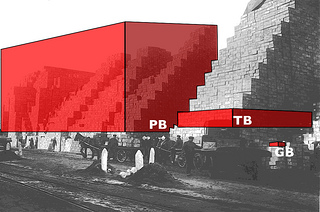
Big Data Illustration

Filed under: BigData,Graphics,Visualization — Patrick Durusau @ 3:55 pm

big data image

An image from Stefano Bertolo (Attribution-NonCommercial-ShareAlike 2.0 Generic) for a presentation on big data.

Stefano notes:

A pictured I edited with Inkscape to illustrate the non-linear effects in process management that result from changes in data volumes. I thank the National Library of Scotland for the original.

This illustrates the “…non-linear effects in process management that result from changes in data volumes” but does it also illustrate the increased demands on third-parties to use data?

I need an illustration for the proposition that if data (and its structures) are annotated at the moment of creation, that reduces the burden on every subsequent user.

Stefano’s image works fine for talking about the increased burden of non-documented data, but it doesn’t add a burden to each user who lacks knowledge of the data nor take it away if the data is properly prepared.

If you start with an unknown 1 GB of data, there is some additional cost for you to acquire knowledge of the data. If someone uses that data set after you, they have to go through the same process. So the cost of unknown data isn’t static but increases with the number of times it is used.

By the same token, properly documented data doesn’t exert a continual drag on its users.

Suggestions on imagery?

Comments/suggestions?

Stefano’s posting.

January 1, 2014

Discovering Big Dark Data in 2014?

Filed under: BigData — Patrick Durusau @ 8:59 pm

I don’t normally attempt to predict the future. If anything, the future is more fluid than either the past and/or the present.

On the other hand, we judge predictions from the vantage point of some future time. If our predictions are vague enough, it is hard to be considered wrong. 😉

I will try to avoid the escape hatch of vagueness but you will have to be the judge of my success. I am too close to the author to be considered an unbiased judge.

My first prediction is that Google’s Hummingbird (How semantic search is killing the keyword) which is a marriage of very coarse annotations (schema.org) to Google’s Knowledge Graph, will demonstrate immediate ROI for low cost semantic annotation.

The ROI that the Semantic Web of the W3C never demonstrated.

Semantic Web ROI awaits a pie in the sky day when all identifiers are replaced by URIs, URIs used consistently by everyone, written to enable machine reasoning, at each author’s expense.

Because of that demonstration of ROI from annotation coupled with the knowledge graph and the Google search engine, my second prediction is that a hue and cry will go out for more simple annotations in along the lines of those found at schema.org.

Commercial, government and NGOs, that supported and waited for the Semantic Web for fifteen (15) years, with so little to show for it, will not be as patient this time.

They will want (demand) the same ROI as Google. Immediately if not sooner, not someday by and by.

The coarse annotations invented by governments, organizations, commercial interests and others will be inconsistent and often contradictory. Not to mention it is hard to apply annotations to data you don’t understand.

You and I recognize the semantic opaqueness of keys and values in unfamiliar data. It goes unnoticed by someone familiar with a data set, much in the same way you can’t look at a page and not read it. (Assuming you know the language.)

Data and their structures are much the same way. We can’t look at data we know (or think we do) and not understand what is meant by the data and its structure.

But the opposite is true for data that is foreign to us. Foreign data is semantically opaque to a visitor.

There is a lot of foreign data in big data.

Enough foreign data that my third prediction is that “Big Dark Data” will be one of the major themes of 2014.

I see topic maps (both theory and practice) as an answer for Big Dark Data.

Do you?


Summarizing my predictions for 2014:

  • Google will demonstrate ROI from the use of coarse annotations (schema.org) and its knowledge graph + search engine.
  • Governments, enterprises, organizations, etc., will seek the same semantic ROI as Google.
  • Big Data will become known as Big Dark Data since most of it is foreign to any given user.
« Newer PostsOlder Posts »

Powered by WordPress