Another Word For It Patrick Durusau on Topic Maps and Semantic Diversity

November 21, 2014

CERN frees LHC data

Filed under: Data,Open Data,Science,Scientific Computing — Patrick Durusau @ 3:55 pm

CERN frees LHC data

From the post:

Today CERN launched its Open Data Portal, which makes data from real collision events produced by LHC experiments available to the public for the first time.

“Data from the LHC program are among the most precious assets of the LHC experiments, that today we start sharing openly with the world,” says CERN Director General Rolf Heuer. “We hope these open data will support and inspire the global research community, including students and citizen scientists.”

The LHC collaborations will continue to release collision data over the coming years.

The first high-level and analyzable collision data openly released come from the CMS experiment and were originally collected in 2010 during the first LHC run. Open source software to read and analyze the data is also available, together with the corresponding documentation. The CMS collaboration is committed to releasing its data three years after collection, after they have been thoroughly studied by the collaboration.

“This is all new and we are curious to see how the data will be re-used,” says CMS data preservation coordinator Kati Lassila-Perini. “We’ve prepared tools and examples of different levels of complexity from simplified analysis to ready-to-use online applications. We hope these examples will stimulate the creativity of external users.”

In parallel, the CERN Open Data Portal gives access to additional event data sets from the ALICE, ATLAS, CMS and LHCb collaborations that have been prepared for educational purposes. These resources are accompanied by visualization tools.

All data on OpenData.cern.ch are shared under a Creative Commons CC0 public domain dedication. Data and software are assigned unique DOI identifiers to make them citable in scientific articles. And software is released under open source licenses. The CERN Open Data Portal is built on the open-source Invenio Digital Library software, which powers other CERN Open Science tools and initiatives.

Awesome is the only term for this data release!

But, when you dig just a little bit further, you discover that embargoes still exist on three (3) out of (4) experiments. Both on data and software.

Disappointing but hopefully a dying practice when it comes to publicly funded data.

I first saw this in a tweet by Ben Evans.

November 20, 2014

Over 1,000 research data repositories indexed in re3data.org

Filed under: Data,Data Repositories — Patrick Durusau @ 7:39 pm

Over 1,000 research data repositories indexed in re3data.org

From the post:

In August 2012 re3data.org – the Registry of Research Data Repositories went online with 23 entries. Two years later the registry provides researchers, funding organisations, libraries and publishers with over 1,000 listed research data repositories from all over the world making it the largest and most comprehensive online catalog of research data repositories on the web. re3data.org provides detailed information about the research data repositories, and its distinctive icons help researchers easily identify relevant repositories for accessing and depositing data sets.

To more than 5,000 unique visitors per month re3data.org offers reliable orientation in the heterogeneous landscape of research data repositories. An average of 10 repositories are added to the registry every week. The latest indexed data infrastructure is the new CERN Open Data Portal.

Add to your short list of major data repositories!

November 19, 2014

Science fiction fanzines to be digitized as part of major UI initiative

Filed under: Data,Texts — Patrick Durusau @ 2:00 pm

Science fiction fanzines to be digitized as part of major UI initiative by Kristi Bontrager.

From the post:

The University of Iowa Libraries has announced a major digitization initiative, in partnership with the UI Office of the Vice President for Research and Economic Development. 10,000 science fiction fanzines will be digitized from the James L. “Rusty” Hevelin Collection, representing the entire history of science fiction as a popular genre and providing the content for a database that documents the development of science fiction fandom.

Hevelin was a fan and a collector for most of his life. He bought pulp magazines from newsstands as a boy in the 1930s, and by the early 1940s began attending some of the first organized science fiction conventions. He remained an active collector, fanzine creator, book dealer, and fan until his death in 2011. Hevelin’s collection came to the UI Libraries in 2012, contributing significantly to the UI Libraries’ reputation as a major international center for science fiction and fandom studies.

Interesting content for many of us but an even more interesting work flow model for the content:

Once digitized, the fanzines will be incorporated into the UI Libraries’ DIY History interface, where a select number of interested fans (up to 30) will be provided with secure access to transcribe, annotate, and index the contents of the fanzines. This group will be modeled on an Amateur Press Association (APA) structure, a fanzine distribution system developed in the early days of the medium that required contributions of content from members in order to qualify for, and maintain, membership in the organization. The transcription will enable the UI Libraries to construct a full-text searchable fanzine resource, with links to authors, editors, and topics, while protecting privacy and copyright by limiting access to the full set of page images.

The similarity between the Amateur Press Association (APA) structure and modern open source projects is interesting. I checked the APA’s homepage, they are have a more traditional membership fee now.

The Hevelin Collection homepage.

November 17, 2014

This is your Brain on Big Data: A Review of “The Organized Mind”

This is your Brain on Big Data: A Review of “The Organized Mind” by Stephen Few.

From the post:

In the past few years, several fine books have been written by neuroscientists. In this blog I’ve reviewed those that are most useful and placed Daniel Kahneman’s Thinking, Fast & Slow at the top of the heap. I’ve now found its worthy companion: The Organized Mind: Thinking Straight in the Age of Information Overload.

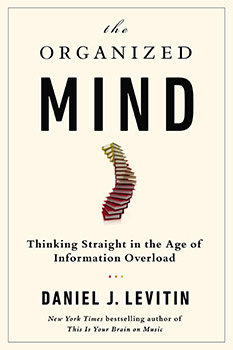
the organized mind - book cover

This new book by Daniel J. Levitin explains how our brains have evolved to process information and he applies this knowledge to several of the most important realms of life: our homes, our social connections, our time, our businesses, our decisions, and the education of our children. Knowing how our minds manage attention and memory, especially their limitations and the ways that we can offload and organize information to work around these limitations, is essential for anyone who works with data.

See Stephen’s review for an excerpt from the introduction and summary comments on the work as a whole.

I am particularly looking forward to reading Levitin’s take on the transfer of information tasks to us and the resulting cognitive overload.

I don’t have the volume, yet, but it occurs to me that the shift from indexes (Readers Guide to Periodical Literature and the like) and librarians to full text search engines, is yet another example of the transfer of information tasks to us.

Indexers and librarians do a better job of finding information than we do because discovery of information is a difficult intellectual task. Well, perhaps, discovering relevant and useful information is a difficult task. Almost without exception, every search produces a result on major search engines. Perhaps not a useful result but a result none the less.

Using indexers and librarians will produce a line item in someone’s budget. What is needed is research on the differential between the results from indexer/librarians versus us and what that translates to as a line item in enterprise budgets.

That type of research could influence university, government and corporate budgets as the information age moves into high gear.

The Organized Mind by Daniel J. Levitin is a must have for the holiday wish list!

November 5, 2014

Data Sources for Cool Data Science Projects: Part 2

Filed under: Data,Data Science — Patrick Durusau @ 5:33 pm

Data Sources for Cool Data Science Projects: Part 2 by Ryan Swanstrom.

From the post:

I am excited for the first ever guest posts on the Data Science 101 blog. Dr. Michael Li, Executive Director of The Data Incubator in New York City, is providing 2 great posts (see Part 1) about finding data for your next data science project.

Nice collection of data sources, some familiar and some unexpected.

Enjoy!

October 21, 2014

The Harvard Classics: Download All 51 Volumes as Free eBooks

Filed under: Data,History — Patrick Durusau @ 7:06 pm

The Harvard Classics: Download All 51 Volumes as Free eBooks by Josh Jones.

From the post:

Every revolutionary age produces its own kind of nostalgia. Faced with the enormous social and economic upheavals at the nineteenth century’s end, learned Victorians like Walter Pater, John Ruskin, and Matthew Arnold looked to High Church models and played the bishops of Western culture, with a monkish devotion to preserving and transmitting old texts and traditions and turning back to simpler ways of life. It was in 1909, the nadir of this milieu, before the advent of modernism and world war, that The Harvard Classics took shape. Compiled by Harvard’s president Charles W. Eliot and called at first Dr. Eliot’s Five Foot Shelf, the compendium of literature, philosophy, and the sciences, writes Adam Kirsch in Harvard Magazine, served as a “monument from a more humane and confident time” (or so its upper classes believed), and a “time capsule…. In 50 volumes.”

What does the massive collection preserve? For one thing, writes Kirsch, it’s “a record of what President Eliot’s America, and his Harvard, thought best in their own heritage.” Eliot’s intentions for his work differed somewhat from those of his English peers. Rather than simply curating for posterity “the best that has been thought and said” (in the words of Matthew Arnold), Eliot meant his anthology as a “portable university”—a pragmatic set of tools, to be sure, and also, of course, a product. He suggested that the full set of texts might be divided into a set of six courses on such conservative themes as “The History of Civilization” and “Religion and Philosophy,” and yet, writes Kirsch, “in a more profound sense, the lesson taught by the Harvard Classics is ‘Progress.’” “Eliot’s [1910] introduction expresses complete faith in the ‘intermittent and irregular progress from barbarism to civilization.’”

Great reading in addition to being a snapshot of a time in history.

Good data set for testing text analysis tools.

For example, Josh mentions “progress” as a point of view in the Harvard Classics, as if that view does not persist today. I would be hard pressed to explain American foreign policy and its posturing about how states should behave aside from “complete faith” in progress.

What text collection would you compare the Harvard Classics to today to arrive at a judgement on their respective views of progress?

I first saw this in a tweet by Open Culture.

October 20, 2014

August 2014 Crawl Data Available

Filed under: Common Crawl,Data — Patrick Durusau @ 3:03 pm

August 2014 Crawl Data Available by Stephen Merity.

From the post:

The August crawl of 2014 is now available! The new dataset is over 200TB in size containing approximately 2.8 billion webpages. The new data is located in the aws-publicdatasets bucket at /common-crawl/crawl-data/CC-MAIN-2014-35/.

To assist with exploring and using the dataset, we’ve provided gzipped files that list:

By simply adding either s3://aws-publicdatasets/ or https://aws-publicdatasets.s3.amazonaws.com/ to each line, you end up with the S3 and HTTP paths respectively.

Thanks again to blekko for their ongoing donation of URLs for our crawl!

Have you considered diffing the same webpages from different crawls?

Just curious. Could be empirical evidence of which websites are stable and those were content could change from under you.

October 18, 2014

Data Sources for Cool Data Science Projects: Part 1

Filed under: Data — Patrick Durusau @ 6:58 pm

Data Sources for Cool Data Science Projects: Part 1

From the post:

At The Data Incubator, we run a free six week data science fellowship to help our Fellows land industry jobs. Our hiring partners love considering Fellows who don’t mind getting their hands dirty with data. That’s why our Fellows work on cool capstone projects that showcase those skills. One of the biggest obstacles to successful projects has been getting access to interesting data. Here are a few cool public data sources you can use for your next project:

Nothing surprising or unfamiliar but at least you know what the folks at Data Incubator think is “cool” and/or important. Intell is never a waste.

Enjoy!

October 3, 2014

Open Sourcing Duckling, our probabilistic (date) parser [Clojure]

Filed under: Data,Parsers,Probalistic Models — Patrick Durusau @ 1:22 pm

Open Sourcing Duckling, our probabilistic (date) parser

From the post:

We’ve previously discussed ambiguity in natural language. What’s really fascinating is that even the simplest, seemingly most structured parts of natural language, like the way we humans describe dates and times, are actually so difficult to turn into structured data.

The wild world of temporal expressions in human language

All the following expressions describe the same point in time (at least in some contexts):

  • “December 30th, at 3 in the afternoon”
  • “The day before New Year’s Eve at 3pm”
  • “At 1500 three weeks from now”
  • “The last Tuesday of December at 3pm”

But wait… is it really equivalent to say 3pm and 1500? In the latter case, it seems that speaker meant to be more precise. Is it OK to drop this information?

And what about “next Tuesday”? If today is Monday, is that tomorrow or in 8 days? When I say “last month”, is it the last full month or the last 30 days?

A last example: “one month” looks like a well defined duration. That is, until you try to normalize durations in seconds, and you realize different months have anywhere between 28 and 31 days! Even “one day” is difficult. Yes, a day can last between 23 and 25 hours, because of daylight savings. Oh, and did I mention that at midnight at the end of 1927 in Shanghai, the clocks went back 5 minutes and 52 seconds? So “1927-12-31 23:54:08” actually happened twice there.

There are hundreds of hard things like these, and the more you dig into this, believe me, the more you’ll encounter. But that’s out of the scope of this post.

An introduction to the vagaries of date statements in natural language, a probabilistic (date) parser in Clojure, and an opportunity to extend said parser to other data types.

Nice way to end the week!

October 2, 2014

Data Blog Aggregation – Coffeehouse

Filed under: Data,Data Management,Digital Library — Patrick Durusau @ 10:43 am

Coffeehouse

From the about page:

Coffeehouse aggregates posts about data management from around the internet.

The idea for this site draws inspiration from other aggregators such as Ecobloggers and R-Bloggers.

Coffeehouse is a project of DataONE, the Data Observation Network for Earth.

Posts are lightly curated. That is, all posts are brought in, but if we see posts that aren’t on topic, we take them down from this blog. They are not of course taken down from the original poster, just this blog.

Recently added data blogs:

Archive and Data Management Training Center

We believe that the character and structure of the social science research environment determines attitudes to re-use.

We also believe a healthy research environment gives researchers incentives to confidently create re-usable data, and for data archives and repositories to commit to supporting data discovery and re-use through data enhancement and long-term preservation.

The purpose of our center is to ensure excellence in the creation, management, and long-term preservation of research data. We promote the adoption of standards in research data management and archiving to support data availability, re-use, and the repurposing of archived data.

Our desire is to see the European research area producing quality data with wide and multipurpose re-use value. By supporting multipurpose re-use, we want to help researchers, archives and repositories realize the intellectual value of public investment in academic research. (From the “about” page for the Archive and Data Management Training Center website but representative of the blog as well)

Data Ab Initio

My name is Kristin Briney and I am interested in all things relating to scientific research data.

I have been in love with research data since working on my PhD in Physical Chemistry, when I preferred modeling and manipulating my data to actually collecting it in the lab (or, heaven forbid, doing actual chemistry). This interest in research data led me to a Master’s degree in Information Studies where I focused on the management of digital data.

This blog is something I wish I had when I was a practicing scientist: a resource to help me manage my data and navigate the changing landscape of research dissemination.

Digital Library Blog (Stanford)

The latest news and milestones in the development of Stanford’s digital library–including content, new services, and infrastructure development.

Dryad News and Views

Welcome to Dryad news and views, a blog about news and events related to the Dryad digital repository. Subscribe, comment, contribute– and be sure to Publish Your Data!

Dryad is a curated general-purpose repository that makes the data underlying scientific publications discoverable, freely reusable, and citable. Any journal or publisher that wishes to encourage data archiving may refer authors to Dryad. Dryad welcomes data submissions related to any published, or accepted, peer reviewed scientific and medical literature, particularly data for which no specialized repository exists.

Journals can support and facilitate their authors’ data archiving by implementing “submission integration,” by which the journal manuscript submission system interfaces with Dryad. In a nutshell: the journal sends automated notifications to Dryad of new manuscripts, which enables Dryad to create a provisional record for the article’s data, thereby streamlining the author’s data upload process. The published article includes a link to the data in Dryad, and Dryad links to the published article.

The Dryad documentation site provides complete information about Dryad and the submission integration process.

Dryad staff welcome all inquiries. Thank you.

<tamingdata/>

The data deluge refers to the increasingly large and complex data sets generated by researchers that must be managed by their creators with “industrial-scale data centres and cutting-edge networking technology” (Nature 455) in order to provide for use and re-use of the data.

The lack of standards and infrastructure to appropriately manage this (often tax-payer funded) data requires data creators, data scientists, data managers, and data librarians to collaborate in order to create and acquire the technology required to provide for data use and re-use.

This blog is my way of sorting through the technology, management, research and development that have come together to successfully solve the data deluge. I will post and discuss both current and past R&D in this area. I welcome any comments.

There are fourteen (14) data blogs to date feeding into Coffeehouse. Unlike some data blog aggregations, ads do not overwhelm content at Coffeehouse.

If you have a data blog, please consider adding it to Coffeehouse. Suggest that other data bloggers do the same.
September 22, 2014

Algorithms and Data – Example

Filed under: Algorithms,Data,Statistics — Patrick Durusau @ 10:41 am

People's Climate

AJ+ was all over the #OurClimate march in New York City.

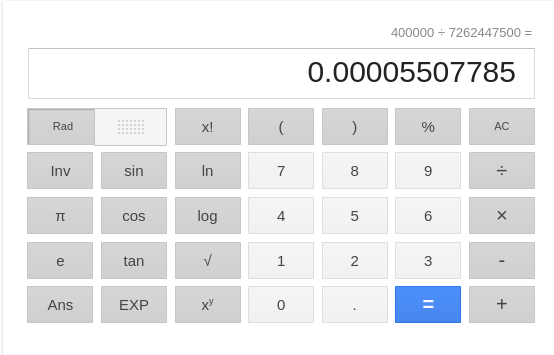
Let’s be generous and say the march attracted 400,000 people.

At approximately 10:16 AM Eastern time this morning, the world population clock reported a population of 7,262,447,500.

0.000550 % of the world’s population expressed an opinion on climate change in New York yesterday.

I mention that calculation, disclosing both data and the algorithm, to point out the distortion between the number of people driving policy versus the number of people impacted.

Other minority opinions promoted by AJ+ include that of the United States (population: 318,776,000) on what role Iran (population: 77,176,930) should play in the Middle East (population: 395,133,109) and the world (population: 7,262,447,500), on issues such as the Islamic State. BBC News: Islamic State crisis: Kerry says Iran can help defeat IS.

Isn’t that “the tail wagging the dog?”

Is there any wonder why international decision making departs from the common interests of the world’s population?

Hopefully AJ+ will stop beating the drum quite so loudly for minority opinions and seek out more representative ones, even if not conveniently located in New York City.

September 21, 2014

Know Your Algorithms and Data!

Filed under: Data,Skepticism — Patrick Durusau @ 4:46 pm

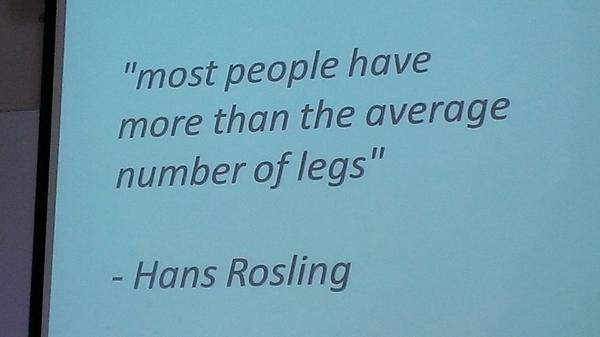
average of legs

If you let me pick the algorithm or the data, I can produce any result you want.

Something to keep in mind when listening to reports of “facts.”

Or as Nietzsche would say:

There are no facts, only interpretations.

There are people who are so naive that they don’t realize interpretations other than their are possible. Avoid them unless you have need of followers for some reason.

I first saw this in a tweet by Chris Arnold.

September 15, 2014

Norwegian Ethnological Research [The Early Years]

Filed under: Data,Data Mining,Ethnological — Patrick Durusau @ 10:49 am

Norwegian Ethnological Research [The Early Years] by Lars Marius Garshol.

From the post:

The definitive book on Norwegian farmhouse ale is Odd Nordland’s “Brewing and beer traditions in Norway,” published in 1969. That book is now sadly totally unavailable, except from libraries. In the foreword Nordland writes that the book is based on a questionnaire issued by Norwegian Ethnological Research in 1952 and 1957. After digging a little I discovered that this material is actually still available at the institute. The questionnaire is number 35, running to 103 questions.

Because the questionnaire responses in general often contain descriptions of quite personal matters, access to the answers is restricted. However, by paying a quite stiff fee, describing the research I wanted to use the material for, and signing a legal agreement, I was sent a CD with all the answers to questionnaire 35. The contents are quite daunting: 1264 numbered JPEG files, with no metadata of any kind. The files are scans of individual pages of responses, plus one cover page for each Norwegian province. Most of the responses are handwritten, and legibility varies dramatically. Some, happily, are typewritten.

I appended “[The Early Years]” to the title because Lars has embarked on an adventure that can last as long as he remains interested.

Sixty-two year old survey results leave Lars wondering exactly what was meant in some cases. Keep that in mind the next time you search for word usage across centuries. Matching exact strings isn’t the same thing as matching the meanings attached to those strings.

You can imagine what gaps and ambiguities might exist when the time period stretches to centuries, if not millennia, and our knowledge of the languages is learned in a modern context.

The understanding we capture is our own, which hopefully has some connection to earlier witnesses. Recording that process is a uniquely human activity and one that I am glad Lars is sharing with a larger audience.

Looking forward to hearing about more results!

PS: Do you have a similar “data mining” story to share? Including the use of command line tool stories but working with non-electronic resources as well.

September 11, 2014

MRAPs And Bayonets: What We Know About The Pentagon’s 1033 Program

Filed under: Data,Data Analysis — Patrick Durusau @ 5:47 pm

MRAPs And Bayonets: What We Know About The Pentagon’s 1033 Program by by Arezou Rezvani, Jessica Pupovac, David Eads, and Tyler Fisher. (NPR)

From the post:

Amid widespread criticism of the deployment of military-grade weapons and vehicles by police officers in Ferguson, Mo., President Obama recently ordered a review of federal efforts supplying equipment to local law enforcement agencies across the country.

So, we decided to take a look at what the president might find.

NPR obtained data from the Pentagon on every military item sent to local, state and federal agencies through the Pentagon’s Law Enforcement Support Office — known as the 1033 program — from 2006 through April 23, 2014. The Department of Defense does not publicly report which agencies receive each piece of equipment, but they have identified the counties that the items were shipped to, a description of each, and the amount the Pentagon initially paid for them.

We took the raw data, analyzed it and have organized it to make it more accessible. We are making that data set available to the public today.

This is a data set that raises more questions than it answers, as the post points out.

The top ten categories of items distributed (valued in the $millions): vehicles, aircraft, comm. & detection, clothing, construction, fire control, weapons, electric wire, medical equipment, and tractors.

Tractors? I can understand the military having tractors since it is entirely self-reliance during military operations. Why any local law enforcement office needs a tractor is less clear. Or bayonets (11,959 of them).

The NPR post does a good job of raising questions but since there are 3,143 counties or their equivalents in the United States, connecting the dots with particular local agencies, uses, etc. falls on your shoulders.

Could be quite interesting. Is your local sheriff “training” on an amphibious vehicle to reach his deer blind during hunting season? (Utter speculation on my part. I don’t know if your local sheriff likes to hunt deer.)

August 29, 2014

National Museum of Denmark – Images

Filed under: Data,Museums — Patrick Durusau @ 1:02 pm

Nationalmuseet frigiver tusindvis af historiske fotos

The National Museum of Denmark has released nearly 50,000 images with a long term goal of 750,000 images, licensed under Creative Commons license BY-SA to the photos where the museum owns the copyright.

Should have an interesting impact on object recognition in images. What objects are “common” in a particular period? What objects are associated with particular artists or themes?

Enjoy!

I first saw this in a tweet by Michael Peter Edson.

August 26, 2014

6,482 Datasets Available

Filed under: Data,Government Data,JSON — Patrick Durusau @ 10:38 am

6,482 Datasets Available Across 22 Federal Agencies In Data.json Files by Kin Lane.

From the post:

It has been a few months since I ran any of my federal government data.json harvesting, so I picked back up my work, and will be doing more work around datasets that federal agnecies have been making available, and telling the stories across my network.

I’m still surprised at how many people are unaware that 22 of the top federal agencies have data inventories of their public data assets, available in the root of their domain as a data.json file. This means you can go to many example.gov/data.json and there is a machine readable list of that agencies current inventory of public datasets.

See Kin’s post for links to the agency data.json files.

You may also want to read: What Happened With Federal Agencies And Their Data.json Files, which details Kin’s earlier efforts with tracking agency data.json files.

Kin points out that these data.json files are governed by: OMB M-13-13 Open Data Policy—Managing Information as an Asset. It’s pretty joyless reading but if you are interested in the the policy details or the requirements agencies must meet, it’s required reading.

If you are looking for datasets to clean up or combine together, it would be hard to imagine a more diverse set to choose from.

August 25, 2014

USDA Nutrient DB (R Data Package)

Filed under: Data,R — Patrick Durusau @ 6:30 pm

USDA Nutrient DB (R Data Package) by Hadley Wickham.

From the webpage:

This package contains all data from the USDA National Nutrient Database, “Composition of Foods Raw, Processed, Prepared”, release 26.

From the data documentation:

The USDA National Nutrient Database for Standard Reference (SR) is the major source of food composition data in the United States. It provides the foundation for most food composition databases in the public and private sectors. As information is updated, new versions of the database are released. This version, Release 26 (SR26), contains data on 8,463 food items and up to 150 food components. It replaces SR25 issued in September 2012.

Updated data have been published electronically on the USDA Nutrient Data Laboratory (NDL) web site since 1992. SR26 includes composition data for all the food groups and nutrients published in the 21 volumes of “Agriculture Handbook 8” (U.S. Department of Agriculture 1976-92), and its four supplements (U.S. Department of Agriculture 1990-93), which superseded the 1963 edition (Watt and Merrill, 1963). SR26 supersedes all previous releases, including the printed versions, in the event of any differences.

The ingredient calculators at most recipe sites are wimpy by comparison. If you really are interested in what you are ingesting on a day to day basis, take a walk through this data set.

Some other links of interest:

Release 26 Web Interface

Release 26 page

Correlating this data with online shopping options could be quite useful.

August 23, 2014

Data + Design

Filed under: Data,Design,Survey,Visualization — Patrick Durusau @ 2:17 pm

Data + Design: A simple introduction to preparing and visualizing information by Trina Chiasson, Dyanna Gregory and others.

From the webpage:

ABOUT

Information design is about understanding data.

Whether you’re writing an article for your newspaper, showing the results of a campaign, introducing your academic research, illustrating your team’s performance metrics, or shedding light on civic issues, you need to know how to present your data so that other people can understand it.

Regardless of what tools you use to collect data and build visualizations, as an author you need to make decisions around your subjects and datasets in order to tell a good story. And for that, you need to understand key topics in collecting, cleaning, and visualizing data.

This free, Creative Commons-licensed e-book explains important data concepts in simple language. Think of it as an in-depth data FAQ for graphic designers, content producers, and less-technical folks who want some extra help knowing where to begin, and what to watch out for when visualizing information.

As of today, the Data + Design is the product of fifty (50) volunteers from fourteen (14) countries. At eighteen (18) chapters and just shy of three-hundred (300) pages, this is a solid introduction to data and its visualization.

The source code is on GitHub, along with information on how you can contribute to this project.

A great starting place but my social science background is responsible for my caution concerning chapters 3 and 4 on survey design and questions.

All of the information and advice in those chapters is good, but it leaves the impression that you (the reader) can design an effective survey instrument. There is a big difference between an “effective” survey instrument and a series of questions pretending to be a survey instrument. Both will measure “something” but the question is whether a survey instrument provides you will actionable intelligence.

For a survey on any remotely mission critical, like user feedback on an interface or service, get as much professional help as you can afford.

When was the last time you heard of a candidate for political office or serious vendor using Survey Monkey? There’s a reason for that lack of reports. Can you guess that reason?

I first saw this in a tweet by Meta Brown.

August 14, 2014

Model building with the iris data set for Big Data

Filed under: BigData,Data — Patrick Durusau @ 7:09 pm

Model building with the iris data set for Big Data by Joseph Rickert.

From the post:

For similar reasons, the airlines data set used in the 2009 ASA Sections on Statistical Computing and Statistical Graphics Data expo has gained a prominent place in the machine learning world and is well on its way to becoming the “iris data set for big data”. It shows up in all kinds of places. (In addition to this blog, it made its way into the RHIPE documentation and figures in several college course modeling efforts.)

Some key features of the airlines data set are:

  • It is big enough to exceed the memory of most desktop machines. (The version of the airlines data set used for the competition contained just over 123 million records with twenty-nine variables.
  • The data set contains several different types of variables. (Some of the categorical variables have hundreds of levels.)
  • There are interesting things to learn from the data set. (This exercise from Kane and Emerson for example)
  • The data set is tidy, but not clean, making it an attractive tool to practice big data wrangling. (The AirTime variable ranges from -3,818 minutes to 3,508 minutes)

Joseph reviews what may become the iris data set of “big data,” airline data.

Its variables:

Name Description
1 Year 1987-2008
2 Month 1-12
3 DayofMonth 1-31
4 DayOfWeek 1 (Monday) – 7 (Sunday)
5 DepTime actual departure time (local, hhmm)
6 CRSDepTime scheduled departure time (local, hhmm)
7 ArrTime actual arrival time (local, hhmm)
8 CRSArrTime scheduled arrival time (local, hhmm)
9 UniqueCarrier unique carrier code
10 FlightNum flight number
11 TailNum plane tail number
12 ActualElapsedTime in minutes
13 CRSElapsedTime in minutes
14 AirTime in minutes
15 ArrDelay arrival delay, in minutes
16 DepDelay departure delay, in minutes
17 Origin origin IATA airport code
18 Dest destination IATA airport code
19 Distance in miles
20 TaxiIn taxi in time, in minutes
21 TaxiOut taxi out time in minutes
22 Cancelled was the flight cancelled?
23 CancellationCode reason for cancellation (A = carrier, B = weather, C = NAS, D = security)
24 Diverted 1 = yes, 0 = no
25 CarrierDelay in minutes
26 WeatherDelay in minutes
27 NASDelay in minutes
28 SecurityDelay in minutes
29 LateAircraftDelay in minutes

Source: http://stat-computing.org/dataexpo/2009/the-data.html

Waiting for the data set to download. Lots of questions suggest themselves. For example, variation or lack thereof in the use of fields 25-29.

Enjoy!

I first saw this in a tweet by David Smith.

August 8, 2014

Rent Data – USA

Filed under: Data,Politics — Patrick Durusau @ 3:46 pm

These 7 Charts Show Why the Rent Is Too Damn High…and what can be done about it. by Erika Eichelberger and AJ Vicens.

Nothing really compares to a Mother Jones article when they get into full voice. 😉

For example:

More Americans than ever before are unable to afford rent. Here’s a look at why the rent is too damn high and what can be done about it.

Part of the problem has to do with simple supply and demand. Millions of Americans lost their homes during the foreclosure crisis, and many of those folks flooded into the rental market. In 2004, 31 percent of US households were renters, according to HUD. Today that number is 35 percent. “With more people trying to get into same number of units you get an incredible pressure on prices,” says Shaun Donovan*, the former secretary of housing and urban development for the Obama administration.

If you are interested in a data set to crunch on a current public policy issue, the problem of affordable housing is a good as any. All the data cited in this article is available for downloading.

It would take more data mining but identifying those who benefit from a tight rental market versus those who will profit from public housing assistance, such as construction and rental management agencies would make an interesting exercise when compared to political donations and support.

Housing assistance does benefit people being oppressed by high rent but others benefit as well. If you would like to pursue that question, ping me. I have some ideas on where to look for evidence.

August 5, 2014

Dangerous Data Democracy

Filed under: Data,Data Science — Patrick Durusau @ 7:03 pm

K-Nearest Neighbors: dangerously simple by Cathy O’Neil (aka mathbabe).

From the post:

I spend my time at work nowadays thinking about how to start a company in data science. Since there are tons of companies now collecting tons of data, and they don’t know what do to do with it, nor who to ask, part of me wants to design (yet another) dumbed-down “analytics platform” so that business people can import their data onto the platform, and then perform simple algorithms themselves, without even having a data scientist to supervise.

After all, a good data scientist is hard to find. Sometimes you don’t even know if you want to invest in this whole big data thing, you’re not sure the data you’re collecting is all that great or whether the whole thing is just a bunch of hype. It’s tempting to bypass professional data scientists altogether and try to replace them with software.

I’m here to say, it’s not clear that’s possible. Even the simplest algorithm, like k-Nearest Neighbor (k-NN), can be naively misused by someone who doesn’t understand it well. Let me explain.

Cathy’s post is a real hoot! You may not roll out of your chair but memories of prior similar episodes will flash by.

She makes a compelling case that the “democratization of data science” effort is not only mis-guided, it is dangerous to boot. Dangerous at least to users who take advantage of data democracy services.

Or should I say that data democracy services are taking advantage of users? 😉

The only reason to be concerned is that users may blame data science rather than their own incompetence with data tools for their disasters. (That seems like the most likely outcome.)

Suggested counters to the “data democracy for everyone” rhetoric?

PS: Sam Hunting reminded me of this post from Cathy O’Neil.

July 28, 2014

Cat Dataset

Filed under: Data,Image Processing,Image Recognition,Image Understanding — Patrick Durusau @ 12:14 pm

Cat Dataset

cat

From the description:

The CAT dataset includes 10,000 cat images. For each image, we annotate the head of cat with nine points, two for eyes, one for mouth, and six for ears. The detail configuration of the annotation was shown in Figure 6 of the original paper:

Weiwei Zhang, Jian Sun, and Xiaoou Tang, “Cat Head Detection – How to Effectively Exploit Shape and Texture Features”, Proc. of European Conf. Computer Vision, vol. 4, pp.802-816, 2008.

A more accessible copy: Cat Head Detection – How to Effectively Exploit Shape and Texture Features

Prelude to a cat filter for Twitter feeds? 😉

I first saw this in a tweet by Basile Simon.

July 26, 2014

Stanford Large Network Dataset Collection

Filed under: Data,Graphs,Networks — Patrick Durusau @ 8:27 pm

Stanford Large Network Dataset Collection by Jure Leskovec.

From the webpage:

SNAP networks are also availalbe from UF Sparse Matrix collection. Visualizations of SNAP networks by Tim Davis.

If you need software to go with these datasets, consider Stanford Network Analysis Platform (SNAP)

Stanford Network Analysis Platform (SNAP) is a general purpose, high performance system for analysis and manipulation of large networks. Graphs consists of nodes and directed/undirected/multiple edges between the graph nodes. Networks are graphs with data on nodes and/or edges of the network.

The core SNAP library is written in C++ and optimized for maximum performance and compact graph representation. It easily scales to massive networks with hundreds of millions of nodes, and billions of edges. It efficiently manipulates large graphs, calculates structural properties, generates regular and random graphs, and supports attributes on nodes and edges. Besides scalability to large graphs, an additional strength of SNAP is that nodes, edges and attributes in a graph or a network can be changed dynamically during the computation.

A Python interface is available for SNAP.

I first saw this at: Stanford Releases Large Network Datasets by Ryan Swanstrom.

July 18, 2014

Build Roads not Stagecoaches

Filed under: Data,Integration,Subject Identity — Patrick Durusau @ 3:40 pm

Build Roads not Stagecoaches by Martin Fenner.

Describing Eric Hysen’s keynote, Martin says:

In his keynote he described how travel from Cambridge to London in the 18th and early 19th century improved mainly as a result of better roads, made possible by changes in how these roads are financed. Translated to today, he urged the audience to think more about the infrastructure and less about the end products:

Ecosystems, not apps

— Eric Hysen

On Tuesday at csv,conf, Nick Stenning – Technical Director of the Open Knowledge Foundation – talked about data packages, an evolving standard to describe data that are passed around betwen different systems. He used the metaphor of containers, and how they have dramatically changed the transportation of goods in the last 50 years. He argued that the cost of shipping was in large part determined by the cost of loading and unloading, and the container has dramatically changed that equation. We are in a very similar situation with datasets, where most of the time is spent translating between different formats, joining things together that use different names for the same thing [emphasis added], etc.

…different names for the same thing.

Have you heard that before? 😉

But here is the irony:

When I thought more about this I realized that these building blocks are exactly the projects I get most excited about, i.e. projects that develop standards or provide APIs or libraries. Some examples would be

  • ORCID: unique identifiers for scholarly authors

OK, but many authors already have unique identifiers in DBLP, Library of Congress, Twitter, and at places I have not listed.

Nothing against ORCID, but adding yet another identifier isn’t all that helpful.

A mapping between identifiers, so having one means I can leverage the others, now that is what I call infrastructure.

You?

July 15, 2014

CSV validator – a new digital preservation tool

Filed under: CSV,Data — Patrick Durusau @ 3:19 pm

CSV validator – a new digital preservation tool by David Underdown.

From the post:

Today marks the official release of a new digital preservation tool developed by The National Archives, CSV Validator version 1.0. This follows on from well known tools such as DROID and PRONOM database used in file identification (discussed in several previous blog posts). The release comprises the validator itself, but perhaps more importantly, it also includes the formal specification of a CSV schema language for describing the allowable content of fields within CSV (Comma Separated Value) files, which gives something to validate against.

Odd to find two presentations about CSV on the same day!

Adam Retter presented on this project today. slides.

It will be interesting to see how much cross-pollination occurs with the CSV on the Web Working Group.

Suggest you follow both groups.

July 1, 2014

The WORD on the STREET

Filed under: Data,History,News — Patrick Durusau @ 3:31 pm

The WORD on the STREET

From the webpage:

In the centuries before there were newspapers and 24-hour news channels, the general public had to rely on street literature to find out what was going on. The most popular form of this for nearly 300 years was ‘broadsides’ – the tabloids of their day. Sometimes pinned up on walls in houses and ale-houses, these single sheets carried public notices, news, speeches and songs that could be read (or sung) aloud.

The National Library of Scotland’s online collection of nearly 1,800 broadsides lets you see for yourself what ‘the word on the street’ was in Scotland between 1650 and 1910. Crime, politics, romance, emigration, humour, tragedy, royalty and superstitions – all these and more are here.

Each broadside comes with a detailed commentary and most also have a full transcription of the text, plus a downloadable PDF facsimile. You can search by keyword, browse by title or browse by subject.

Take a look, and discover what fascinated our ancestors!

An excellent resource for examples of the changing meanings of words over time.

For example, what do you think “sporting” means?

Ready? Try A List of Sporting Ladies…to that their Pleasure at Kelso Races to see if your answer matches that given by the collectors.

BTW, the browsing index will remind you of modern news casts, covering accidents, crime, executions, politics, transvestites, war and other staples of the news industry.

June 25, 2014

One Hundred Million…

Filed under: Data,Image Processing,Image Understanding,Yahoo! — Patrick Durusau @ 7:29 pm

One Hundred Million Creative Commons Flickr Images for Research by David A. Shamma.

From the post:

Today the photograph has transformed again. From the old world of unprocessed rolls of C-41 sitting in a fridge 20 years ago to sharing photos on the 1.5” screen of a point and shoot camera 10 years back. Today the photograph is something different. Photos automatically leave their capture (and formerly captive) devices to many sharing services. There are a lot of photos. A back of the envelope estimation reports 10% of all photos in the world were taken in the last 12 months, and that was calculated three years ago. And of these services, Flickr has been a great repository of images that are free to share via Creative Commons.

On Flickr, photos, their metadata, their social ecosystem, and the pixels themselves make for a vibrant environment for answering many research questions at scale. However, scientific efforts outside of industry have relied on various sized efforts of one-off datasets for research. At Flickr and at Yahoo Labs, we set out to provide something more substantial for researchers around the globe.

[image omitted]

Today, we are announcing the Flickr Creative Commons dataset as part of Yahoo Webscope’s datasets for researchers. The dataset, we believe, is one of the largest public multimedia datasets that has ever been released—99.3 million images and 0.7 million videos, all from Flickr and all under Creative Commons licensing.

The dataset (about 12GB) consists of a photo_id, a jpeg url or video url, and some corresponding metadata such as the title, description, title, camera type, title, and tags. Plus about 49 million of the photos are geotagged! What’s not there, like comments, favorites, and social network data, can be queried from the Flickr API.

The good news doesn’t stop there, the 100 million photos have been analyzed for standard features as well!

Enjoy!

On Taxis and Rainbows

Filed under: Data,Privacy — Patrick Durusau @ 4:06 pm

On Taxis and Rainbows: Lessons from NYC’s improperly anonymized taxis logs by Vijay Pandurangan.

From the post:

Recently, thanks to a Freedom of Information request, Chris Whong received and made public a complete dump of historical trip and fare logs from NYC taxis. It’s pretty incredible: there are over 20GB of uncompressed data comprising more than 173 million individual trips. Each trip record includes the pickup and dropoff location and time, anonymized hack licence number and medallion number (i.e. the taxi’s unique id number, 3F38, in my photo above), and other metadata.

These data are a veritable trove for people who love cities, transit, and data visualization. But there’s a big problem: the personally identifiable information (the driver’s licence number and taxi number) hasn’t been anonymized properly — what’s worse, it’s trivial to undo, and with other publicly available data, one can even figure out which person drove each trip. In the rest of this post, I’ll describe the structure of the data, what the person/people who released the data did wrong, how easy it is to deanonymize, and the lessons other agencies should learn from this. (And yes, I’ll also explain how rainbows fit in).

I mention this because you may be interested in the data in large chunks or small chunks.

The other reason to mention this data set is the concern over “proper” anonymization of the data. As if failing to do that, resulted in a loss of privacy for the drivers.

I see no loss of privacy for the drivers.

I say that because the New York City Taxi and Limousine Commission already had the data. The question was: Will members of the public have access to the same data? Whatever privacy a taxi driver had was breached when the data went to the NYC Taxi and Limousine Commission.

That’s an important distinction. “Privacy” will be a regular stick the government trots out to defend its possessing data and not sharing it with you.

The government has no real interest in your privacy. Witness the rogue intelligence agencies in Washington if you have any doubts on that issue. The government wants to conceal your information, which it gained by fair and/or foul methods, from both you and the rest of us.

Why? I don’t know with any certainly. But based on my observations in both the “real world” and academia, most of it stems from “I know something you don’t,” and that makes them feel important.

I can’t imagine any sadder basis for feeling important. The NSA could print out a million pages of its most secret files and stack them outside my office. I doubt I would be curious enough to turn over the first page.

The history of speculation, petty office rivalries, snide remarks about foreign government officials, etc. are of no interest to me. I already assumed they were spying on everyone so having “proof” of that is hardly a big whoop.

But we should not be deterred by calls for privacy as we force government to disgorge data it has collected, including that of the NSA. Perhaps even licensing chunks of the NSA data for use in spy novels. That offers some potential for return on the investment in the NSA.

June 22, 2014

Wikipedia Usage Statistics

Filed under: Amazon Web Services AWS,Data,Wikipedia — Patrick Durusau @ 4:57 pm

Wikipedia Usage Statistics by Paul Houle.

From the post:

The Wikimedia Foundation publishes page view statistics for Wikimedia projects here; this serveris rate-limited so it took roughly a month to transfer this 4 TB data set into S3 Storage in the AWS cloud. The photo on the left is of a hard drive containing a copy of the data that was produced with AWS Import/Export.

Once in S3, it is easy to process this data with Amazon Map/Reduce using the Open Source telepath software.

The first product developed from this is SubjectiveEye3D.

It’s your turn

Future projects require that this data be integrated with semantic data from :BaseKB and that has me working on tools such as RDFeasy. In the meantime, a mirror of the Wikipedia pagecounts from Jan 2008 to Feb 2014 is available in a requester pays bucket in S3 , which means you can use it in the Amazon Cloud for free and download data elsewhere for the cost of bulk network transfer.

Interesting isn’t it?

That “open” data can be so difficult to obtain and manipulate that it may as well not be “open” at all for the average user.

Something to keep in mind when big players talk about privacy. Do they mean private from their prying eyes or yours?

I think you will find in most cases that “privacy” means private from you and not the big players.

If you want to do a good deed for this week, support this data set at Gittip.

I first saw this in a tweet by Gregory Piatetsky.

June 11, 2014

Network Data (And Merging Graphs)

Filed under: Data,Graphs,Networks — Patrick Durusau @ 7:20 pm

Network Data by Mark Newman.

From the webpage:

This page contains links to some network data sets I’ve compiled over the years. All of these are free for scientific use to the best of my knowledge, meaning that the original authors have already made the data freely available, or that I have consulted the authors and received permission to the post the data here, or that the data are mine. If you make use of any of these data, please cite the original sources.

The data sets are in GML format. For a description of GML see here. GML can be read by many network analysis packages, including Gephi and Cytoscape. I’ve written a simple parser in C that will read the files into a data structure. It’s available here. There are many features of GML not supported by this parser, but it will read the files in this repository just fine. There is a Python parser for GML available as part of the NetworkX package here and another in the igraph package, which can be used from C, Python, or R. If you know of or develop other software (Java, C++, Perl, R, Matlab, etc.) that reads GML, let me know.

I count sixteen (16) data sets and seven (7) collections of data sets.

Reminded me of a tweet I saw today:

Glimpse Conference

It’s used to be the social graph, then the interest-graph. Now, w/ social shopping it’s all about the taste graph. (emphasis added)

That’s three very common graphs and we all belong to networks or have interests that could be represented as still others.

After all the labor that goes into the composition of a graph, Mr. Normalization Graph would say we have to re-normalize these graphs to use them together.

That sounds like a bad plan. To me, reduplicating work that has already been done is always a bad plan.

If we could merge nodes and edges of two or more graphs together, then we can leverage the prior work on both graphs.

Not to mention that after merging, the unified graph could be searched, visualized and explored with less capable graph software and techniques.

Something to keep in mind.

I first saw this in a tweet by Steven Strogatz.

« Newer PostsOlder Posts »

Powered by WordPress