Another Word For It Patrick Durusau on Topic Maps and Semantic Diversity

January 28, 2011

Unified Intelligence: Completing the Mosaic of Analytics

Filed under: Analytics,Data Analysis — Patrick Durusau @ 10:15 am

Unified Intelligence: Completing the Mosaic of Analytics

Tuesday, Feb. 15 @ 4 ET

From the announcement:

Seeing the big picture requires a convergence of both structured and unstructured data. While each side of that puzzle presents challenges, the unstructured world poses a wider range of issues that must be resolved before meaningful analysis can be done. However, many organizations are discovering that new technologies can be employed to process and transform this unwieldy data, such that it can be united with the traditional realm of business intelligence to bring new meaning and context to analytics.

Register for this episode of The Briefing Room to learn from veteran Analyst James Taylor about how companies can incorporate unstructured data into their decision systems and processes. Taylor will be briefed by Sid Probstein of Attivio, who will tout his company’s patented technology, the Active Intelligence Engine, which uses inverted indexing and a mathematical graph engine to extract, process and align unstructured data. A host of Attivio connectors allow integration with most analytical and many operational systems, including the capability for hierarchical XML data.

I am not real sure what a non-mathematical graph engine would look like but this could be fun.

It is also an opportunity to learn something about how others view the world.
Sho: the .NET Playground for Data

Filed under: Data Analysis,Visualization — Patrick Durusau @ 7:37 am

Sho: the .NET Playground for Data

Since we are talking about data analysis and display tools.

From the website:

Sho is an interactive environment for data analysis and scientific computing that lets you seamlessly connect scripts (in IronPython) with compiled code (in .NET) to enable fast and flexible prototyping. The environment includes powerful and efficient libraries for linear algebra as well as data visualization that can be used from any .NET language, as well as a feature-rich interactive shell for rapid development.

January 11, 2011

Banned in China!

Filed under: Data Analysis — Patrick Durusau @ 7:21 am

Data Analysis Using Regression and Multilevel/Hierarchical Models (ISBN-13: 9780521686891) has been banned in China due to politically sensitive materials in the text.

What politically sensitive materials in the text set off the censors is unknown at this point but apparently queries are pending.

There is only one response to censorship or attempts at censorship:

Order a copy of the work in question and urge others to do so as well. (Or assist in the dissemination of the materials.)

I say that without qualification or limitation.

Censorship, whether political (insulting the government), national security (diplomatic cables for example), religious (cartoons), or otherwise, is the refuge of the insecure.

If something bothers you, don’t look.

*****
PS: I just ordered my copy, how about you?

January 9, 2011

Apache UIMA

Apache UIMA

From the website:

Unstructured Information Management applications are software systems that analyze large volumes of unstructured information in order to discover knowledge that is relevant to an end user. An example UIM application might ingest plain text and identify entities, such as persons, places, organizations; or relations, such as works-for or located-at.

UIMA enables applications to be decomposed into components, for example “language identification” => “language specific segmentation” => “sentence boundary detection” => “entity detection (person/place names etc.)”. Each component implements interfaces defined by the framework and provides self-describing metadata via XML descriptor files. The framework manages these components and the data flow between them. Components are written in Java or C++; the data that flows between components is designed for efficient mapping between these languages.

UIMA additionally provides capabilities to wrap components as network services, and can scale to very large volumes by replicating processing pipelines over a cluster of networked nodes.

The UIMA project offers a number of annotators that produce structured information from unstructured texts.

If you are using UIMA as a framework for development of topic maps, please post concerning your experiences with UIMA. What works, what doesn’t, etc.

January 7, 2011

Win: Data Analysis with Open Source Tools

Filed under: Data Analysis — Patrick Durusau @ 6:20 am

Comment to win a copy of Data Analysis with Open Source Tools

From the blog:

Want to win a copy? I have five of them up for grabs. For a chance to win, leave a comment below by January 9, 2011, 10:00pm PST. Tell us what you used to make your very first graph. Pencil and graph paper? Excel? R? Jelly beans?

I have entered a comment. Thought I should pass the opportunity along.

December 30, 2010

Data Diligence: More Thoughts on Google Books’ Ngrams – Post

Filed under: Data Analysis,Data Source — Patrick Durusau @ 4:56 pm

Data Diligence: More Thoughts on Google Books’ Ngrams

Matthew Hurst asks a number of interesting questions about the underlying data for Google Book’s Ngrams.

He illustrates that large amounts of data have the potential to be useful, but divorced from any context or at least limited in terms of the context that is known, it can be of limited utility.

Questions:

  1. Spend at least 4-6 hours exploring (ok, playing) with Google Books’ Ngrams.
  2. Develop 3 or 4 questions you would like to answer with this data source.
  3. What additional information or context would you need to answer your questions in #2?

The Joy of Stats

Filed under: Data Analysis,Statistics,Visualization — Patrick Durusau @ 7:56 am

The Joy Of Stats Available In Its Entirety

I am not sure that “…statistics are the sexiest subject around…” but if anyone could make it appear to be so, it would be Rosling.

Highly recommended for an entertaining account of statistics and data visualization.

You won’t learn the latest details but you will be left with an enthusiasm for incorporating such techniques in your next topic map.

BTW, does anyone know of a video editor/producer who would be interested in volunteering to film/produce The Joy of Topic Maps?

(I suppose the script would have to be written first. 😉 )

December 27, 2010

Python Text Processing with NLTK2.0 Cookbook – Review Forthcoming!

Filed under: Classification,Data Analysis,Data Mining,Natural Language Processing — Patrick Durusau @ 2:25 pm

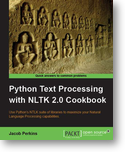
Just a quick placeholder to say that I am reviewing Python Text Processing with NLTK2.0 Cookbook

Python Text Processing

I should have the review done in the next couple of weeks.

In the longer term I will be developing a set of notes on the construction of topic maps using this toolkit.

While you wait for the review, you might enjoy reading: Chapter No.3 – Creating Custom Corpora (free download).

Orange

Filed under: Data Analysis,Inference,Random Forests,Visualization — Patrick Durusau @ 2:23 pm

Orange

From the website:

Open source data visualization and analysis for novice and experts. Data mining through visual programming or Python scripting. Components for machine learning. Extensions for bioinformatics and text mining. Packed with features for data analytics.

I had to look at the merge data widget.

Which is said to: Merges two data sets based on the values of selected attributes.

According to the documentation:

Merge Data widget is used to horizontally merge two data sets based on the values of selected attributes. On input, two data sets are required, A and B. The widget allows for selection of an attribute from each domain which will be used to perform the merging. When selected, the widget produces two outputs, A+B and B+A. The first output (A+B) corresponds to instances from input data A which are appended attributes from B, and the second output (B+A) to instances from B which are appended attributes from A.

The merging is done by the values of the selected (merging) attributes. For example, instances from from A+B are constructed in the following way. First, the value of the merging attribute from A is taken and instances from B are searched with matching values of the merging attributes. If more than a single instance from B is found, the first one is taken and horizontally merged with the instance from A. If no instance from B match the criterium, the unknown values are assigned to the appended attributes. Similarly, B+A is constructed.

Which illustrates the problem that topic maps solves rather neatly:

  1. How does a subsequent researcher reliably duplicate such a merger?
  2. How does a subsequent researcher reliably merge that data with other data?
  3. How do other researchers reliably merge that data with their own data?

Answer is: They can’t. Not enough information.

Question: How would you change the outcome for those three questions? In detail. (5-7 pages, citations)

ROOT

Filed under: Data Analysis,HEP - High Energy Physics,Visualization — Patrick Durusau @ 2:21 pm

ROOT

From the website:

ROOT is a framework for data processing, born at CERN, at the heart of the research on high-energy physics.  Every day, thousands of physicists use ROOT applications to analyze their data or to perform simulations.

….

  • Save data. You can save your data (and any C++ object) in a compressed binary form in a ROOT file.  The object format is also saved in the same file.  ROOT provides a data structure that is extremely powerful for fast access of huge amounts of data – orders of magnitude faster than any database.
  • Access data. Data saved into one or several ROOT files can be accessed from your PC, from the web and from large-scale file delivery systems used e.g. in the GRID.  ROOT trees spread over several files can be chained and accessed as a unique object, allowing for loops over huge amounts of data.
  • Process data. Powerful mathematical and statistical tools are provided to operate on your data.  The full power of a C++ application and of parallel processing is available for any kind of data manipulation.  Data can also be generated following any statistical distribution, making it possible to simulate complex systems.
  • Show results. Results are best shown with histograms, scatter plots, fitting functions, etc.  ROOT graphics may be adjusted real-time by few mouse clicks.  High-quality plots can be saved in PDF or other format.
  • Interactive or built application. You can use the CINT C++ interpreter or Python for your interactive sessions and to write macros, or compile your program to run at full speed. In both cases, you can also create a GUI.

Effective deployment of topic maps requires an understanding of how others identify their subjects.

Noting that subjects in this context includes not only subject in experimental data but the detectors and programs used to analyze that data. (Think data preservation.)

Questions:

  1. Review the documentation browser for ROOT.
  2. How would you integrate one or more of the years of RootTalk Digest into that documentation?
  3. What scopes would you create and how would you use them?
  4. How would you use a topic map to integrate subject specific content for data or analysis in ROOT?
« Newer Posts

Powered by WordPress