Another Word For It Patrick Durusau on Topic Maps and Semantic Diversity

January 28, 2015

WorldWideScience.org (Update)

Filed under: Indexing,Language,Science,Translation — Patrick Durusau @ 2:47 pm

I first wrote about WorldWideScience.org in a post dated October 17, 2011.

A customer story from Microsoft: WorldWide Science Alliance and Deep Web Technologies made me revisit the site.

My original test query was “partially observable Markov processes” which resulted in 453 “hits” from at least 3266 found (2011 results). Today, running the same query resulted in “…1,342 top results from at least 25,710 found.” The top ninety-seven (97) were displayed.

A current description of the system from the customer story:


In June 2010, Deep Web Technologies and the Alliance launched multilingual search and translation capabilities with WorldWideScience.org, which today searches across more than 100 databases in more than 70 countries. Users worldwide can search databases and translate results in 10 languages: Arabic, Chinese, English, French, German, Japanese, Korean, Portuguese, Russian, and Spanish. The solution also takes advantage of the Microsoft Audio Video Indexing Service (MAVIS). In 2011, multimedia search capabilities were added so that users could retrieve speech-indexed content as well as text.

The site handles approximately 70,000 queries and 1 million page views each month, and all traffic, including that from automated crawlers and search engines, amounts to approximately 70 million transactions per year. When a user enters a search term, WorldWideScience.org instantly provides results clustered by topic, country, author, date, and more. Results are ranked by relevance, and users can choose to look at papers, multimedia, or research data. Divided into tabs for easy usability, the interface also provides details about each result, including a summary, date, author, location, and whether the full text is available. Users can print the search results or attach them to an email. They can also set up an alert that notifies them when new material is available.

Automated searching and translation can’t give you the semantic nuances possible by human authoring but it certainly can provide you with the source materials to build a specialized information resource with such semantics.

Very much a site to bookmark and use on a regular basis.

Links for subjects without them otherwise:

Deep Web Technologies

Microsoft Translator

January 26, 2015

Chandra Celebrates the International Year of Light

Filed under: Astroinformatics,News,Science — Patrick Durusau @ 8:53 pm

Chandra Celebrates the International Year of Light by Janet Anderson and Megan Watzke.

From the webpage:

The year of 2015 has been declared the International Year of Light (IYL) by the United Nations. Organizations, institutions, and individuals involved in the science and applications of light will be joining together for this yearlong celebration to help spread the word about the wonders of light.

In many ways, astronomy uses the science of light. By building telescopes that can detect light in its many forms, from radio waves on one end of the “electromagnetic spectrum” to gamma rays on the other, scientists can get a better understanding of the processes at work in the Universe.

NASA’s Chandra X-ray Observatory explores the Universe in X-rays, a high-energy form of light. By studying X-ray data and comparing them with observations in other types of light, scientists can develop a better understanding of objects likes stars and galaxies that generate temperatures of millions of degrees and produce X-rays.

To recognize the start of IYL, the Chandra X-ray Center is releasing a set of images that combine data from telescopes tuned to different wavelengths of light. From a distant galaxy to the relatively nearby debris field of an exploded star, these images demonstrate the myriad ways that information about the Universe is communicated to us through light.

Five objects at various distances that have been observed by Chandra

SNR 0519-69.0: When a massive star exploded in the Large Magellanic Cloud, a satellite galaxy to the Milky Way, it left behind an expanding shell of debris called SNR 0519-69.0. Here, multimillion degree gas is seen in X-rays from Chandra (blue). The outer edge of the explosion (red) and stars in the field of view are seen in visible light from Hubble.

Five objects at various distances that have been observed by Chandra

Cygnus A: This galaxy, at a distance of some 700 million light years, contains a giant bubble filled with hot, X-ray emitting gas detected by Chandra (blue). Radio data from the NSF’s Very Large Array (red) reveal “hot spots” about 300,000 light years out from the center of the galaxy where powerful jets emanating from the galaxy’s supermassive black hole end. Visible light data (yellow) from both Hubble and the DSS complete this view.

There are more images but one of the reasons I posted about Chandra is that the online news reports I have seen all omitted the most important information of all: Where to find more information!

At the bottom of this excellent article on Chandra (which also doesn’t appear as a link in the news stories I have read), you will find:

For more information on “Light: Beyond the Bulb,” visit the website at http://lightexhibit.org

For more information on the International Year of Light, go to http://www.light2015.org/Home.html

For more information and related materials, visit: http://chandra.si.edu

For more Chandra images, multimedia and related materials, visit: http://www.nasa.gov/chandra

Granted it took a moment or two to insert the hyperlinks but now any child or teacher or anyone else who wants more information can avoid the churn and chum of searching and go directly to the sources for more information.

That doesn’t detract from my post. On the contrary, I hope that readers find that sort of direct linking to more resources helpful and a reason to return to my site.

Granted I don’t have advertising and won’t so keeping people at my site is no financial advantage to me. But if I have to trap people into remaining at my site, it must not be a very interesting one. Yes?

January 6, 2015

Scientific Computing on the Erlang VM

Filed under: Erlang,Programming,Science,Scientific Computing — Patrick Durusau @ 6:48 pm

Scientific Computing on the Erlang VM by Duncan McGreggor.

From the post:

This tutorial brings in the New Year by introducing the Erlang/LFE scientific computing library lsci – a ports wrapper of NumPy and SciPy (among others) for the Erlang ecosystem. The topic of the tutorial is polynomial curve-fitting for a given data set. Additionally, this post further demonstrates py usage, the previously discussed Erlang/LFE library for running Python code from the Erlang VM.

Background

The content of this post was taken from a similar tutorial done by the same author for the Python Lisp Hy in an IPython notebook. It, in turn, was completely inspired by the Clojure Incantor tutorial on the same subject, by David Edgar Liebke.

This content is also available in the lsci examples directory.

Introduction

The lsci library (pronounced “Elsie”) provides access to the fast numerical processing libraries that have become so popular in the scientific computing community. lsci is written in LFE but can be used just as easily from Erlang.

Just in case Erlang was among your New Year’s Resolutions. 😉

Well, that’s not the only reason. You are going to encounter data processing that was performed in systems or languages that are strange to you. Assuming access to the data and a sufficient explanation of what was done, you need to be able to verify analysis in a language comfortable to you.

There isn’t now nor is there likely to be a shortage of languages and applications for data processing. Apologies to the various evangelists who dream of world domination for their favorite. Unless and until that happy day for someone arrives, the rest of us need to survive in a multilingual and multi-application space.

Which means having the necessary tools for data analysis/verification in your favorite tool suite counts for a lot. It is the difference in taking someone’s word for analysis and verifying the analysis for yourself. There is a world of difference between those two positions.

NASA’s Kepler Marks 1,000th Exoplanet Discovery…

Filed under: Astroinformatics,Humor,Science — Patrick Durusau @ 3:00 pm

NASA’s Kepler Marks 1,000th Exoplanet Discovery, Uncovers More Small Worlds in Habitable Zones by Felicia Chou and Michele Johnson.

From the post:

15-004_0

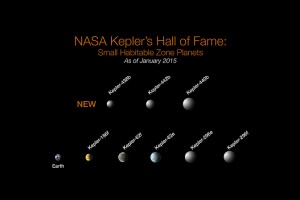
NASA Kepler’s Hall of Fame: Of the more than 1,000 verified planets found by NASA’s Kepler Space Telescope, eight are less than twice Earth-size and in their stars’ habitable zone. All eight orbit stars cooler and smaller than our sun. The search continues for Earth-size habitable zone worlds around sun-like stars.

How many stars like our sun host planets like our Earth? NASA’s Kepler Space Telescope continuously monitored more than 150,000 stars beyond our solar system, and to date has offered scientists an assortment of more than 4,000 candidate planets for further study — the 1,000th of which was recently verified.

Using Kepler data, scientists reached this millenary milestone after validating that eight more candidates spotted by the planet-hunting telescope are, in fact, planets. The Kepler team also has added another 554 candidates to the roll of potential planets, six of which are near-Earth-size and orbit in the habitable zone of stars similar to our sun.

Three of the newly-validated planets are located in their distant suns’ habitable zone, the range of distances from the host star where liquid water might exist on the surface of an orbiting planet. Of the three, two are likely made of rock, like Earth.

“Each result from the planet-hunting Kepler mission’s treasure trove of data takes us another step closer to answering the question of whether we are alone in the Universe,” said John Grunsfeld, associate administrator of NASA’s Science Mission Directorate at the agency’s headquarters in Washington. “The Kepler team and its science community continue to produce impressive results with the data from this venerable explorer.”

To determine whether a planet is made of rock, water or gas, scientists must know its size and mass. When its mass can’t be directly determined, scientists can infer what the planet is made of based on its size.

Two of the newly validated planets, Kepler-438b and Kepler-442b, are less than 1.5 times the diameter of Earth. Kepler-438b, 475 light-years away, is 12 percent bigger than Earth and orbits its star once every 35.2 days. Kepler-442b, 1,100 light-years away, is 33 percent bigger than Earth and orbits its star once every 112 days.

Given the distances involved, Kepler-438b and Kepler-442b, at 475 light years and 1,100 light years, respectively, the EU has delayed work on formulating conditions for their admission into the EU until after resolution of the current uncertainty over the Greek bailout agreement. Germany is already circulating draft admission proposals.

January 3, 2015

Astrostatistics and Astroinformatics Portal (ASAIP)

Filed under: Astroinformatics,Science,Statistics — Patrick Durusau @ 7:35 pm

Astrostatistics and Astroinformatics Portal (ASAIP)

From the webpage:

The ASAIP provides searchable abstracts to Recent Papers in the field, several discussion Forums, various resources for researchers, brief Articles by experts, lists of Meetings, and access to various Web resources such as on-line courses, books, jobs and blogs. The site will be used for public outreach by five organizations: International Astrostatistics Association (IAA, to be affiliated with the International Statistical Institute), American Astronomical Society Working Group in Astroinformatics and Astrostatistics (AAS/WGAA), International Astronomical Union Working Group in Astrostatistics and Astroinformatics (IAU/WGAA), Information and Statistical Sciences Consortium of the planned Large Synoptic Survey Telescope (LSST/ISSC), and the American Statistical Association Interest Group in Astrostatistics (ASA/IGA).

Join the ASAIP! Members of ASAIP — researchers and students in astronomy, statistics, computer science and related fields — can contribute to the discussion Forums, submit Recent Papers, Research Group links, and announcements of Meetings. Members login using the box at the upper right; typical login names have the form `jsmith’. To become a member, please email the ASAIP editors.

Optical and radio astronomy had “big data” before “big data” was sexy! If you are looking for data sets to stretch your software, you are in the right place.

Enjoy!

December 26, 2014

How to Win at Rock-Paper-Scissors

Filed under: Game Theory,Games,Science,Social Sciences — Patrick Durusau @ 4:40 pm

How to Win at Rock-Paper-Scissors

From the post:

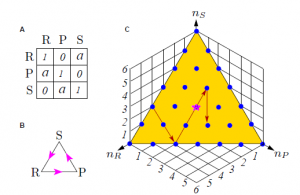
The first large-scale measurements of the way humans play Rock-Paper-Scissors reveal a hidden pattern of play that opponents can exploit to gain a vital edge.

RPSgame

If you’ve ever played Rock-Paper-Scissors, you’ll have wondered about the strategy that is most likely to beat your opponent. And you’re not alone. Game theorists have long puzzled over this and other similar games in the hope of finding the ultimate approach.

It turns out that the best strategy is to choose your weapon at random. Over the long run, that makes it equally likely that you will win, tie, or lose. This is known as the mixed strategy Nash equilibrium in which every player chooses the three actions with equal probability in each round.

And that’s how the game is usually played. Various small-scale experiments that record the way real people play Rock-Paper-Scissors show that this is indeed the strategy that eventually evolves.

Or so game theorists had thought… (emphasis added)

No, I’m not going to give away the answer!

I will only say the answer isn’t what has been previously thought.

Why the different answer? Well, the authors speculate (with some justification) that the smallness of prior experiments resulted in the non-exhibition of a data pattern that was quite obvious when done on a larger scale.

Given that N < 100 in so many sociology, psychology, and other social science experiments, the existing literature offers a vast number of opportunities where repeating small experiments on large scale could produce different results. If you have any friends in a local social science department, you might want to suggest this to them as a way to be on the front end of big data in social science. PS: If you have access to a social science index, please search and post a rough count of participants < 100 in some subset of social science journals. Say since 1970. Thanks!

Big Data – The New Science of Complexity

Filed under: BigData,Philosophy of Science,Science — Patrick Durusau @ 4:17 pm

Big Data – The New Science of Complexity by Wolfgang Pietsch.

Abstract:

Data-intensive techniques, now widely referred to as ‘big data’, allow for novel ways to address complexity in science. I assess their impact on the scientific method. First, big-data science is distinguished from other scientific uses of information technologies, in particular from computer simulations. Then, I sketch the complex and contextual nature of the laws established by data-intensive methods and relate them to a specific concept of causality, thereby dispelling the popular myth that big data is only concerned with correlations. The modeling in data-intensive science is characterized as ‘horizontal’—lacking the hierarchical, nested structure familiar from more conventional approaches. The significance of the transition from hierarchical to horizontal modeling is underlined by a concurrent paradigm shift in statistics from parametric to non-parametric methods.

A serious investigation of the “science” of big data, which I noted was needed in: Underhyped – Big Data as an Advance in the Scientific Method.

From the conclusion:

The knowledge established by big-data methods will consist in a large number of causal laws that generally involve numerous parameters and that are highly context-specific, i.e. instantiated only in a small number of cases. The complexity of these laws and the lack of a hierarchy into which they could be integrated prevent a deeper understanding, while allowing for predictions and interventions. Almost certainly, we will experience the rise of entire sciences that cannot leave the computers and do not fit into textbooks.

This essay and the references therein are a good vantage point from which to observe the development of a new science and its philosophy of science.

December 25, 2014

Christmas Day: 1833

Filed under: History,Science,Skepticism — Patrick Durusau @ 2:31 pm

Charles Darwin’s voyage on Beagle unfolds online in works by ship’s artist by Maev Kennedy.

darwin-slinging-the-monkey

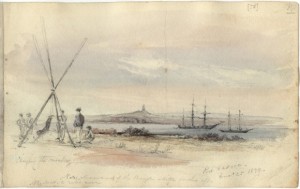
Slinging the monkey, Port Desire sketch by Conrad Martens on Christmas Day 1833 from Sketchbook III Photograph: Cambridge University Library

From the post:

On Christmas Day 1833, Charles Darwin and the crew of HMS Beagle were larking about at Port Desire in Patagonia, under the keen gaze of the ship’s artist, Conrad Martens.

The crew were mostly young men – Darwin himself, a recent graduate from Cambridge University, was only 22 – and had been given shore leave. Martens recorded them playing a naval game called Slinging the Monkey, which looks much more fun for the observers than the main participant. It involved a man being tied by his feet from a frame, swung about and jeered by his shipmates, until he manages to hit one of them with a stick, whereupon they change places.

Alison Pearn, of the Darwin Correspondence Project – which is seeking to assemble every surviving letter from and to the naturalist into a digital archive – said the drawings vividly brought to life one of the most famous voyages in the world. “It’s wonderful that everyone has the chance now to flick through these sketch books, in their virtual representation at the Cambridge digital library, and to follow the journey as Martens and Darwin actually saw it unfold.”

It would be a further 26 years before Darwin published his theory of evolution, On the Origin of Species by Means of Natural Selection, based partly on wildlife observations he made on board the Beagle. The voyage, and many of the people he met and the places he saw can be traced in scores of tiny lightning sketches made in pencil and watercolour by Martens – although unfortunately he joined the ship too late to record the weeping and hungover sailors in their chains – which have been placed online by Cambridge University library.

Anyone playing “slinging the monkey” at your house today?

If captured today, there would be megabytes if not gigabytes of cellphone video. But cellphone video would lack the perspective of the artist that captured a much broader scene than simply the game itself.

Video would give us greater detail about the game but at the loss of the larger context. What does that say about how to interpret body camera video? Does video capture “…what really happened?”

I first saw this in a tweet by the IHR, U. of London.

December 22, 2014

Underhyped – Big Data as an Advance in the Scientific Method

Filed under: BigData,Science — Patrick Durusau @ 6:26 pm

Underhyped – Big Data as an Advance in the Scientific Method by Yanpei Chen.

From the post:

Big data is underhyped. That’s right. Underhyped. The steady drumbeat of news and press talk about big data only as a transformative technology trend. It is as if big data’s impact goes only as far as creating tremendous commercial value for a selected few vendors and their customers. This view could not be further from the truth.

Big data represents a major advance in the scientific method. Its impact will be felt long after the technology trade press turns its attention to the next wave of buzzwords.

I am fortunate to work at a leading data management vendor as a big data performance specialist. My job requires me to “make things go fast” by observing, understanding, and improving big data systems. Specifically, I am expected to assess whether the insights I find represent solid information or partial knowledge. These processes of “finding out about things”, more formally known as empirical observation, hypothesis testing, and causal analysis, lie at the heart of the scientific method.

My work gives me some perspective on an under-appreciated aspect of big data that I will share in the rest of the article.

Searching for “big data” and “philosophy of science” returns almost 80,000 “hits” today. It is a connection I have not considered and if you know of any survey papers on the literature I would appreciate a pointer.

I enjoyed reading this essay but I don’t consider tracking medical treatment results and managing residential heating costs as examples of the scientific method. Both are examples of observation and analysis that is made easier by big data techniques but they don’t involve testing any hypotheses, prediction, testing, causal analysis.

Big data techniques are useful for such cases. But the use of big data techniques for all the steps of the scientific method, observation, formulation of hypotheses, prediction, testing and casual analysis, would be far more exciting.

Any pointers to use uses?

December 17, 2014

Learn Physics by Programming in Haskell

Filed under: Functional Programming,Haskell,Physics,Programming,Science — Patrick Durusau @ 7:55 pm

Learn Physics by Programming in Haskell by Scott N. Walck.

Abstract:

We describe a method for deepening a student’s understanding of basic physics by asking the student to express physical ideas in a functional programming language. The method is implemented in a second-year course in computational physics at Lebanon Valley College. We argue that the structure of Newtonian mechanics is clarified by its expression in a language (Haskell) that supports higher-order functions, types, and type classes. In electromagnetic theory, the type signatures of functions that calculate electric and magnetic fields clearly express the functional dependency on the charge and current distributions that produce the fields. Many of the ideas in basic physics are well-captured by a type or a function.

A nice combination of two subjects of academic importance!

Anyone working on the use of the NLTK to teach David Copperfield or Great Expectations? 😉

I first saw this in a tweet by José A. Alonso.

December 15, 2014

American Institute of Physics: Oral Histories

Filed under: Archives,Audio,Physics,Science — Patrick Durusau @ 9:56 am

American Institute of Physics: Oral Histories

From the webpage:

The Niels Bohr Library & Archives holds a collection of over 1,500 oral history interviews. These range in date from the early 1960s to the present and cover the major areas and discoveries of physics from the past 100 years. The interviews are conducted by members of the staff of the AIP Center for History of Physics as well as other historians and offer unique insights into the lives, work, and personalities of modern physicists.

Read digitized oral history transcripts online

I don’t have a large collection audio data-set (see: Shining a light into the BBC Radio archives) but there are lots of other people who do.

If you are teaching or researching physics for the last 100 years, this is a resource you should not miss.

Integrating audio resources such as this one, at less than the full recording level (think of it as audio transclusion), into teaching materials would be a great step forward. To say nothing of being about to incorporate such granular resources into a library catalog.

I did not find an interview with Edward Teller but a search of the transcripts turned up three hundred and five (305) “hits” where he is mentioned in interviews. A search for J. Robert Oppenheimer netted four hundred and thirty-six (436) results.

If you know your atomic bomb history, you can guess between Teller and Oppenheimer which one would support the “necessity” defense for the use of torture. It would be an interesting study to see how the interviewees saw these two very different men.

December 13, 2014

Every time you cite a paper w/o reading it,

Filed under: Bibliography,Science — Patrick Durusau @ 9:51 am

Every time you cite a paper w/o reading it, b/c someone else cited it, a science fairy dies. (A tweet by realscientists.)

The tweet points to the paper, Mother’s Milk, Literature Sleuths, and Science Fairies by Katie Hinde.

Katie encountered an article that offered a model that was right on point for a chapter she was writing. But rather than simply citing that article, Katie started backtracking from that article to the articles it cited. After quite a bit of due diligence, Katie discovered that the cited articles did not make the claims for which they were cited. Not no way, not no how.

Some of the comments to Katie’s post suggest that students in biological sciences should learn from her example.

I would go further than that and say that all students, biological sciences, physical sciences, computer sciences, the humanities, etc., should all learn from Katie’s example.

If you can’t or don’t verify cited work, don’t cite it. (full stop)

I haven’t kept statistics on it but it isn’t uncommon to find citations in computer science work that don’t exist, are cited incorrectly and/or don’t support the claims made for them. Most of the “don’t exist” class appear to be conference papers that weren’t accepted or were never completed. But were cited as “going to appear…”

Someday soon linking of articles will make verification of references much easier than it is today. How will your publications fare on that day?

December 3, 2014

Periodic Table of Elements

Filed under: Maps,Science,Visualization — Patrick Durusau @ 8:17 pm

Periodic Table of Elements

You will have to follow the link to get anything approaching the full impact of this interactive graphic.

Would be even more impressive if elements linked to locations with raw resources and current futures markets.

I first saw this in a tweet by Lauren Wolf.

PS: You could even say that each element symbol is a locus for gathering all available information about that element.

November 23, 2014

The Debunking Handbook

Filed under: Rhetoric,Science — Patrick Durusau @ 7:52 pm

The Debunking Handbook by John Cook, Stephan Lewandowsky.

From the post:

The Debunking Handbook, a guide to debunking misinformation, is now freely available to download. Although there is a great deal of psychological research on misinformation, there’s no summary of the literature that offers practical guidelines on the most effective ways of reducing the influence of myths. The Debunking Handbook boils the research down into a short, simple summary, intended as a guide for communicators in all areas (not just climate) who encounter misinformation.

The Handbook explores the surprising fact that debunking myths can sometimes reinforce the myth in peoples’ minds. Communicators need to be aware of the various backfire effects and how to avoid them, such as:

It also looks at a key element to successful debunking: providing an alternative explanation. The Handbook is designed to be useful to all communicators who have to deal with misinformation (eg – not just climate myths).

I think you will find this a delightful read! From the first section, titled: Debunking the first myth about debunking,

It’s self-evident that democratic societies should base their decisions on accurate information. On many issues, however, misinformation can become entrenched in parts of the community, particularly when vested interests are involved.1,2 Reducing the influence of misinformation is a difficult and complex challenge.

A common misconception about myths is the notion that removing its influence is as simple as packing more information into people’s heads. This approach assumes that public misperceptions are due to a lack of knowledge and that the solution is more information – in science communication, it’s known as the “information deficit model”. But that model is wrong: people don’t process information as simply as a hard drive downloading data.

Refuting misinformation involves dealing with complex cognitive processes. To successfully impart knowledge, communicators need to understand how people process information, how they modify
their existing knowledge and how worldviews affect their ability to think rationally. It’s not just what people think that matters, but how they think.

I would have accepted the first sentence had it read: It’s self-evident that democratic societies don’t base their decisions on accurate information.

😉

I don’t know of any historical examples of democracies making decisions on accurate information.

For example, there are any number of “rational” and well-meaning people who have signed off on the “war on terrorism” as though the United States is in any danger.

Deaths from terrorism in the United States since 2001 – fourteen (14).

Deaths by entanglement in bed sheets between 2001-2009 – five thousand five hundred and sixty-one (5561).

From: How Scared of Terrorism Should You Be? and Number of people who died by becoming tangled in their bedsheets.

Despite being a great read, Debunking has a problem, it presumes you are dealing with a “rational” person. Rational as defined by…, as defined by what? Hard to say. It is only mentioned once and I suspect “rational” means that you agree with debunking the climate “myth.” I do as well but that’s happenstance and not because I am “rational” in some undefined way.

Realize that “rational” is a favorable label people apply to themselves and little more than that. It rather conveniently makes anyone who disagrees with you “irrational.”

I prefer to use “persuasion” on topics like global warming. You can use “facts” for people who are amenable to that approach but also religion (stewarts of the environment), greed (exploitation of the Third World for carbon credits), financial interest in government funded programs, or whatever works to persuade enough people to support your climate change program. Being aware that other people with other agendas are going to be playing the same game. The question is whether you want to be “rational” or do you want to win?

Personally I am convinced of climate change and our role in causing it. I am also aware of the difficulty of sustaining action by people with an average attention span of fifteen (15) seconds over the period of the fifty (50) years it will take for the environment to stabilize if all human inputs stopped tomorrow. It’s going to take far more than “facts” to obtain a better result.

November 21, 2014

CERN frees LHC data

Filed under: Data,Open Data,Science,Scientific Computing — Patrick Durusau @ 3:55 pm

CERN frees LHC data

From the post:

Today CERN launched its Open Data Portal, which makes data from real collision events produced by LHC experiments available to the public for the first time.

“Data from the LHC program are among the most precious assets of the LHC experiments, that today we start sharing openly with the world,” says CERN Director General Rolf Heuer. “We hope these open data will support and inspire the global research community, including students and citizen scientists.”

The LHC collaborations will continue to release collision data over the coming years.

The first high-level and analyzable collision data openly released come from the CMS experiment and were originally collected in 2010 during the first LHC run. Open source software to read and analyze the data is also available, together with the corresponding documentation. The CMS collaboration is committed to releasing its data three years after collection, after they have been thoroughly studied by the collaboration.

“This is all new and we are curious to see how the data will be re-used,” says CMS data preservation coordinator Kati Lassila-Perini. “We’ve prepared tools and examples of different levels of complexity from simplified analysis to ready-to-use online applications. We hope these examples will stimulate the creativity of external users.”

In parallel, the CERN Open Data Portal gives access to additional event data sets from the ALICE, ATLAS, CMS and LHCb collaborations that have been prepared for educational purposes. These resources are accompanied by visualization tools.

All data on OpenData.cern.ch are shared under a Creative Commons CC0 public domain dedication. Data and software are assigned unique DOI identifiers to make them citable in scientific articles. And software is released under open source licenses. The CERN Open Data Portal is built on the open-source Invenio Digital Library software, which powers other CERN Open Science tools and initiatives.

Awesome is the only term for this data release!

But, when you dig just a little bit further, you discover that embargoes still exist on three (3) out of (4) experiments. Both on data and software.

Disappointing but hopefully a dying practice when it comes to publicly funded data.

I first saw this in a tweet by Ben Evans.

November 18, 2014

#shirtgate, #shirtstorm, and the rhetoric of science

Filed under: Rhetoric,Science — Patrick Durusau @ 7:31 pm

Unless you have been in a coma or just arrived from off-world, you have probably heard about #shirtgate/#shirtstorm. If not, take a minute to search on those hash tags to come up to speed.

During the ensuing flood of posts, tweets, etc., I happened to stumble upon To the science guys who want to understand #shirtstorm by Janet D. Stemwedel.

It is impressive because despite the inability of men and women to fully appreciate the rhetoric of the other gender, Stemwedel finds a third rhetoric, that of science, in which to conduct her argument.

Not that the rhetoric of science is a perfect fit for either gender but it is a rhetoric in which both genders share some assumptions and methods of reasoning. Those partially shared assumptions and methods make Stemwedel’s argument effective.

Take her comments on data gathering (formatted on her blog as tweets):


So, first big point: women’s accounts of their own experiences are better data than your preexisting hunches about their experiences.

Another thing you science guys know: sometimes we observe unexpected outcomes. We don’t say, That SHOULDN’T happen! but, WHY did it happen?

Imagine, for sake of arg, that women’s rxn to @mggtTaylor’s porny shirt was a TOTAL surprise. Do you claim that rxn shouldn’t hv happened?

Or, do you think like a scientist & try to understand WHY it happened? Do you stay stuck in your hunches or get some relevant data?

Do you recognize that women’s experiences in & with science (plus larger society) may make effect of porny shirt on #Rosetta publicity…

…on those women different than effect of porny shirt was on y’all science guys? Or that women KNOW how they feel about it better than you?

Science guys telling women “You shouldn’t be mad about porny shirt on #Rosetta video because…” is modeling bad scientific method!

Finding a common rhetoric is at the core of creating sustainable mappings between differing semantics. Stemwedel illustrates the potential for such a rhetoric even in a highly charged situation.

PS: You need to read Stemwedel’s post in the original.

November 17, 2014

Programming in the Life Sciences

Filed under: Bioinformatics,Life Sciences,Medical Informatics,Programming,Science — Patrick Durusau @ 4:06 pm

Programming in the Life Sciences by Egon Willighagen.

From the first post in this series, Programming in the Life Sciences #1: a six day course (October, 2013):

Our department will soon start the course Programming in the Life Sciences for a group of some 10 students from the Maastricht Science Programme. This is the first time we give this course, and over the next weeks I will be blogging about this course. First, some information. These are the goals, to use programming to:

  • have the ability to recognize various classes of chemical entities in pharmacology and to understand the basic physical and chemical interactions.
  • be familiar with technologies for web services in the life sciences.
  • obtain experience in using such web services with a programming language.
  • be able to select web services for a particular pharmacological question.
  • have sufficient background for further, more advanced, bioinformatics data analyses.

So, this course will be a mix of things. I will likely start with a lecture or too about scientific programming, such as the importance of reproducibility, licensing, documentation, and (unit) testing. To achieve these learning goals we have set a problem. The description is:


    In the life sciences the interactions between chemical entities is of key interest. Not only do these play an important role in the regulation of gene expression, and therefore all cellular processes, they are also one of the primary approaches in drug discovery. Pharmacology is the science studies the action of drugs, and for many common drugs, this is studying the interaction of small organic molecules and protein targets.
    And with the increasing information in the life sciences, automation becomes increasingly important. Big data and small data alike, provide challenges to integrate data from different experiments. The Open PHACTS platform provides web services to support pharmacological research and in this course you will learn how to use such web services from programming languages, allowing you to link data from such knowledge bases to other platforms, such as those for data analysis.

So, it becomes pretty clear what the students will be doing. They only have six days, so it won’t be much. It’s just to learn them the basic skills. The students are in their 3rd year at the university, and because of the nature of the programme they follow, a mixed background in biology, mathematics, chemistry, and physics. So, I have a good hope they will surprise me in what they will get done.

Pharmacology is the basic topic: drug-protein interaction, but the students are free to select a research question. In fact, I will not care that much what they like to study, as long as they do it properly. They will start with Open PHACTS’ Linked Data API, but here too, they are free to complement data from the OPS cache with additional information. I hope they do.

Now, regarding the technology they will use. The default will be JavaScript, and in the next week I will hack up demo code showing the integration of ops.js and d3.js. Let’s see how hard it will be; it’s new to me too. But, if the students already are familiar with another programming language and prefer to use that, I won’t stop them.

(For the Dutch readers, would #mscpils be a good tag?)

For quite a few “next weeks,” Egon’s blogging has gone on and life sciences, to say nothing of his readers, are all better off for it! His most recent post is titled: Programming in the Life Sciences #20: extracting data from JSON.

Definitely a series to catch or to pass along for anyone involved in life sciences.

Enjoy!

October 21, 2014

How to Make More Published Research True

Filed under: Research Methods,Researchers,Science — Patrick Durusau @ 3:03 pm

How to Make More Published Research True by John P. A. Ioannidis. (DOI: 10.1371/journal.pmed.1001747)

If you think the title is provocative, check out the first paragraph:

The achievements of scientific research are amazing. Science has grown from the occupation of a few dilettanti into a vibrant global industry with more than 15,000,000 people authoring more than 25,000,000 scientific papers in 1996–2011 alone [1]. However, true and readily applicable major discoveries are far fewer. Many new proposed associations and/or effects are false or grossly exaggerated [2],[3], and translation of knowledge into useful applications is often slow and potentially inefficient [4]. Given the abundance of data, research on research (i.e., meta-research) can derive empirical estimates of the prevalence of risk factors for high false-positive rates (underpowered studies; small effect sizes; low pre-study odds; flexibility in designs, definitions, outcomes, analyses; biases and conflicts of interest; bandwagon patterns; and lack of collaboration) [3]. Currently, an estimated 85% of research resources are wasted [5]. (footnote links omitted, emphasis added)

I doubt anyone can disagree with the need for reform in scientific research, but it is one thing to call for reform in general versus the specific.

The following story depends a great deal on cultural context, Southern religious cultural context, but I will tell the story and then attempt to explain if necessary.

One Sunday morning service the minister was delivering a powerful sermon on sins that his flock could avoid. He touched on drinking and smoking at length and as he ended each of those, an older woman in the front pew would “Amen!” very loudly. The same response was given to his condemnation of smoking. Finally, the sermon touched on dipping snuff and chewing tobacco. Dead silence from the older woman on the front row. The sermon ended some time later, hymns were sung and the congregation was dismissed.

As the congregation exited the church, the minister stood at the door, greeting one and all. Finally the older woman from the front pew appeared and the minister greeted her warmly. She had after all, appeared to enjoy most of his sermon. After some small talk, the minister did say: “You liked most of my sermon but you became very quite when I mentioned dipping snuff and chewing tobacco. If you don’t mind, can you tell me what was different about that part?” To which the old woman replied: “I was very happy while you were preaching but then you went to meddling.”

So long as the minister was talking about the “sins” that she did not practice, that was preaching. When the minister starting talking about “sins” she committed like dipping snuff or chewing tobacco, that was “meddling.”

I suspect that Ioannidis’ preaching will find widespread support but when you get down to actual projects and experiments, well, you have gone to “meddling.”

In order to root out waste, it will be necessary to map out who benefits from such projects, who supported them, who participated, and their relationships to others and other projects.

Considering that universities are rumored to get at least fifty (50) to (60) percent of grants as administrative overhead, they are unlikely to be your allies in creating such mappings or reducing waste in any way. Appeals to funders may be effective, save some funders, like the NIH, have an investment in the research structure as it exists.

Whatever the odds of change, naming names, charting relationships over time and interests in projects is at least a step down the road to useful rather than remunerative scientific research.

Topic map excel at modeling relationships, whether known at the outset of your tracking or lately discovered, unexpectedly.

PS: With a topic map you can skip endless committee meetings with each project to agree on how to track that project and their methodologies for waste, should any waste exists. Yes, the first line of a tar baby (in it’s traditional West African sense) defense by universities and others, let’s have a pre-meeting to plan our first meeting, etc.

August 14, 2014

Are You A Kardashian?

Filed under: Genome,Humor,Science — Patrick Durusau @ 1:42 pm

The Kardashian index: a measure of discrepant social media profile for scientists by Neil Hall.

Abstract:

In the era of social media there are now many different ways that a scientist can build their public profile; the publication of high-quality scientific papers being just one. While social media is a valuable tool for outreach and the sharing of ideas, there is a danger that this form of communication is gaining too high a value and that we are losing sight of key metrics of scientific value, such as citation indices. To help quantify this, I propose the ‘Kardashian Index’, a measure of discrepancy between a scientist’s social media profile and publication record based on the direct comparison of numbers of citations and Twitter followers.

A playful note on a new index based on a person’s popularity on twitter and their citation record. Not to be taken too seriously but not to be ignored altogether. The influence of popularity, the media asking Neil deGrasse Tyson, an astrophysicist and TV scientist, his opinion about GMOs, is a good example.

Tyson sees no difference between modern GMOs and selective breeding, which has been practiced for thousands of years. Tyson overlooks selective breeding’s requirement of an existing trait to bred towards. In other words, selective breeding has a natural limit built into the process.

For example, there are no naturally fluorescent Zebrafish:

Zebrafish

so you can’t selectively breed fluorescent ones.

On the other hand, with genetic modification, you can produce a variety of fluorescent Zebrafish know as GloFish:

Glofish

Genetic modification has no natural boundary as is present in selective breeding.

With that fact in mind, I think everyone would agree that selective breeding and genetic modification aren’t the same thing. Similar but different.

A subtle distinction that eludes Kardashian TV scientist Neil deGrasse Tyson (Twitter, 2.26M followers).

I first saw this in a tweet by Steven Strogatz.

July 8, 2014

Introduction to R for Life Scientists:…

Filed under: R,Science — Patrick Durusau @ 12:42 pm

Introduction to R for Life Scientists: Course Materials by Stephen Turner.

From the post:

Last week I taught a three-hour introduction to R workshop for life scientists at UVA’s Health Sciences Library.

[image omitted]

I broke the workshop into three sections:

In the first half hour or so I presented slides giving an overview of R and why R is so awesome. During this session I emphasized reproducible research and gave a demonstration of using knitr + rmarkdown in RStudio to produce a PDF that can easily be recompiled when data updates.

In the second (longest) section, participants had their laptops out with RStudio open coding along with me as I gave an introduction to R data types, functions, getting help, data frames, subsetting, and plotting. Participants were challenged with an exercise requiring them to create a scatter plot using a subset of the built-in mtcars dataset.

We concluded with an analysis of RNA-seq data using the DESeq2 package. We started with a count matrix and a metadata file (the modENCODE pasilla knockout data packaged with DESeq2), imported the data into a DESeqDataSet object, ran the DESeq pipeline, extracted results, and did some basic visualization (MA-plots, PCA, volcano plots, etc). A future day-long course will cover RNA-seq in more detail (intro UNIX, alignment, & quantitation in the morning; intro R, QC, and differential expression analysis in the afternoon).

Pass along to any life scientists you meet and/or review yourself to pickup life science terminology and expectations.

I first saw this in a tweet by Christophe Lalanne.

July 3, 2014

rplos Tutorial

Filed under: R,Science,Text Mining — Patrick Durusau @ 2:14 pm

rplos Tutorial

From the webpage:

The rplos package interacts with the API services of PLoS (Public Library of Science) Journals. In order to use rplos, you need to obtain your own key to their API services. Instruction for obtaining and installing keys so they load automatically when you launch R are on our GitHub Wiki page Installation and use of API keys.

This tutorial will go through three use cases to demonstrate the kinds
of things possible in rplos.

  • Search across PLoS papers in various sections of papers
  • Search for terms and visualize results as a histogram OR as a plot through time
  • Text mining of scientific literature

Another source of grist for your topic map mill!

June 8, 2014

Bringing researchers and developers together:…(Mozilla Science Lab)

Filed under: Science,Scientific Computing — Patrick Durusau @ 7:22 pm

Bringing researchers and developers together: a call for proposals by Bill Mills.

From the post:

Interdisciplinary Programming is looking for research projects to participate in a pilot study on bringing together the scientific and developer communities to work together on common problems to help further science on the web. This pilot will be run with the Mozilla Science Lab as a means of testing out new ways for the open science and open source community to get their hands dirty and contribute. The pilot is open to coders both within the research enterprise as well as those outside, and for all skill levels.

In this study, we’ll work to break accepted projects down to digestible tasks (think bug reports or github issues) for others to contribute to or offer guidance on. Projects can be small to mid-scale – the key here is to show how we can involve the global research and development community in furthering science on the web, while testing what the right level of engagement is. Any research-oriented software development project is eligible, with special consideration given to projects that further open, collaborative, reproducible research, and reusable tools and technology for open science.

Candidate research projects should:

  • Have a clearly stated and specific goal to achieve or problem to solve in software.
  • Be directly relevant to your ongoing or shortly upcoming research.
  • Require code that is sharable and reusable, with preference given to open source projects.
  • Science team should be prepared to communicate regularly with the software team.

Interdisciplinary Programming was the brainchild of Angelina Fabbro (Mozilla) and myself (Bill Mills, TRIUMF) that came about when we realized the rich opportunities for cross-pollination between the fields of software development and basic research. When I was a doctoral student writing analysis software for the Large Hadron Collider’s ATLAS experiment, I got to participate in one of the most exciting experiments in physics today – which made it all the more heartbreaking to watch how much precious time vanished into struggling with unusable software, and how many opportunities for great ideas had to be abandoned while we wrestled with software problems that should have been helping us instead of holding us back. If we could only capture some of the coding expertise that was out there, surely our grievously limited budgets and staff could reach far further, and do so much more.

Later, I had the great good fortune to be charged with building the user interface for TRIUMF’s upcoming GRIFFIN experiment, launching this month; thanks to Angelina, this was a watershed moment in realizing what research could do if it teamed up with the web. Angelina taught me about the incredibly rich thought the web community had in the spheres of usability, interaction design, and user experience; even my amature first steps in this world allowed GRIFFIN to produce a powerful, elegant, web-based UI that was strides ahead of what we had before. But what really struck me, was the incredible enthusiasm coders had for research. Angelina and I spoke about our plans for Interdisciplinary Programming on the JavaScript conference circuit in late 2013, and the response was overwhelming; coders were keen to contribute ideas, participate in the discussion and even get their hands dirty with contributions to the fields that excited them; and if I could push GRIFFIN ahead just by having a peek at what web developers were doing, what could we achieve if we welcomed professional coders to the realm of research in numbers? The moment is now to start studying what we can do together.

We’ll be posting projects in early July 2014, due to conclude no later than December 2014 (shorter projects also welcome); projects anticipated to fit this scope will be given priority. In addition, the research teams should be prepared to answer a few short questions on how they feel the project is going every month or so. Interested participants should send project details to the team at mills.wj@gmail.com by June 27, 2014.

I wonder, do you think documenting semantics of data is likely to come up? 😉

Will report more news as it develops!

June 1, 2014

More Science for Computer Science

Filed under: Computer Science,Design,Science,UML — Patrick Durusau @ 6:44 pm

In Debunking Linus’s Law with Science I pointed you to a presentation by Felienne Hermans outlining why the adage:

given enough eyeballs, all bugs are shallow

is not only false but the exact opposite is in fact true. The more people who participate in development of software, the more bugs it will contain.

Remarkably, I have found another instance of the scientific method being applied to computer science.

The abstract for On the use of software design models in software development practice: an empirical investigation by Tony Gorschek, Ewan Tempero, and, Lefteris Angelis, reads as follows:

Research into software design models in general, and into the UML in particular, focuses on answering the question how design models are used, completely ignoring the question if they are used. There is an assumption in the literature that the UML is the de facto standard, and that use of design models has had a profound and substantial effect on how software is designed by virtue of models giving the ability to do model-checking, code generation, or automated test generation. However for this assumption to be true, there has to be significant use of design models in practice by developers.

This paper presents the results of a survey summarizing the answers of 3785 developers answering the simple question on the extent to which design models are used before coding. We relate their use of models with (i) total years of programming experience, (ii) open or closed development, (iii) educational level, (iv) programming language used, and (v) development type.

The answer to our question was that design models are not used very extensively in industry, and where they are used, the use is informal and without tool support, and the notation is often not UML. The use of models decreased with an increase in experience and increased with higher level of qualification. Overall we found that models are used primarily as a communication and collaboration mechanism where there is a need to solve problems and/or get a joint understanding of the overall design in a group. We also conclude that models are seldom updated after initially created and are usually drawn on a whiteboard or on paper.

I plan on citing this paper the next time someone claims that UML diagrams will be useful for readers of a standard.

If you are interested in fact correction issues at Wikipedia, you might want to suggest that in the article on UML the statement:

UML has been found useful in many design contexts,[5] so much so that is has become ubiquitous in its field.

At least the second half of it, “so much so that is has become ubiquitous in its field,” appears to be false.

Do you know of any other uses of science with regard to computer science?

I first saw this in a twee by Erik Meijer

May 30, 2014

Debunking Linus’s Law with Science

Filed under: Computer Science,Science — Patrick Durusau @ 1:14 pm

Putting the science in computer science by Felienne Hermans.

From the description:

Programmers love science! At least, so they say. Because when it comes to the ‘science’ of developing code, the most used tool is brutal debate. Vim versus emacs, static versus dynamic typing, Java versus C#, this can go on for hours at end. In this session, software engineering professor Felienne Hermans will present the latest research in software engineering that tries to understand and explain what programming methods, languages and tools are best suited for different types of development.

Felienne dispells the notion that a discipline is scientific because it claims “science” as part of its name.

To inject some “science” into “computer science,” she reports tests of several propositions, widely held in CS circles, that don’t bear up when “facts” are taken into account.

For example, Linus’s Law: “Given enough eyeballs, all bugs are shallow.”

“Debunking” may not be strong enough because as Felienne shows, the exact opposite of Linus’s Law is true: The more people who touch code, the more bugs are introduced.

If some proprietary software house rejoices over that fact, you can point out that complexity of the originating organization also has a direct relationship to bugs. As in more and not less bugs.

That’s what happens when you go looking for facts. Old sayings true out to be not true and people you already viewed with suspicion turned out to be more incompetent than you thought.

That’s science.

May 27, 2014

Nonlinear Dynamics and Chaos

Filed under: Chaos,Nonlinear Models,Science,Social Networks — Patrick Durusau @ 3:35 pm

Nonlinear Dynamics and Chaos – Steven Strogatz, Cornell University.

From the description:

This course of 25 lectures, filmed at Cornell University in Spring 2014, is intended for newcomers to nonlinear dynamics and chaos. It closely follows Prof. Strogatz’s book, “Nonlinear Dynamics and Chaos: With Applications to Physics, Biology, Chemistry, and Engineering.” The mathematical treatment is friendly and informal, but still careful. Analytical methods, concrete examples, and geometric intuition are stressed. The theory is developed systematically, starting with first-order differential equations and their bifurcations, followed by phase plane analysis, limit cycles and their bifurcations, and culminating with the Lorenz equations, chaos, iterated maps, period doubling, renormalization, fractals, and strange attractors. A unique feature of the course is its emphasis on applications. These include airplane wing vibrations, biological rhythms, insect outbreaks, chemical oscillators, chaotic waterwheels, and even a technique for using chaos to send secret messages. In each case, the scientific background is explained at an elementary level and closely integrated with the mathematical theory. The theoretical work is enlivened by frequent use of computer graphics, simulations, and videotaped demonstrations of nonlinear phenomena. The essential prerequisite is single-variable calculus, including curve sketching, Taylor series, and separable differential equations. In a few places, multivariable calculus (partial derivatives, Jacobian matrix, divergence theorem) and linear algebra (eigenvalues and eigenvectors) are used. Fourier analysis is not assumed, and is developed where needed. Introductory physics is used throughout. Other scientific prerequisites would depend on the applications considered, but in all cases, a first course should be adequate preparation.

Storgatz’s book “Nonlinear Dynamics and Chaos: With Applications to Physics, Biology, Chemistry, and Engineering,” is due out in a second edition in July of 2014. First edition was 2001.

Mastering the class and Stogatz’s book will enable you to call BS on projects with authority. Social groups are one example of chaotic systems. As a consequence, the near religious certainly of policy wonks on outcomes of particular policies is mis-guided.

Be cautious with those who response to social dynamics being chaotic by saying: “…yes, but …(here follows their method of controlling the chaotic system).” Chaotic systems by definition cannot be controlled nor can we account for all the influences and variables in such systems.

The best you can do is what seems to work, most of the time.

May 26, 2014

Self-Inflicted Wounds in Science (Astronomy)

Filed under: Astroinformatics,Science — Patrick Durusau @ 2:52 pm

The Major Blunders That Held Back Progress in Modern Astronomy

From the post:

Mark Twain once said, “It ain’t what you don’t know that gets you into trouble. It’s what you know for sure that just ain’t so. ”

The history of science provides many entertaining examples. So today, Abraham Loeb at Harvard University in Cambridge, scour the history books for examples from the world of astronomy.

It turns out that the history of astronomy is littered with ideas that once seemed incontrovertibly right and yet later proved to be bizarrely wrong. Not least among these are the ancient ideas that the Earth is flat and at the centre of the universe.

But there is no shortage of others from the modern era. “A very common flaw of astronomers is to believe that they know the truth even when data is scarce,” says Loeb.

To make his point, Loeb has compiled a list of ten modern examples of ideas that were not only wrong but also significantly held back progress in astronomy “causing unnecessary delays in finding the truth”.

Highly amusing account of how “beliefs” in science can delay scientific progress. Three in this essay with pointers to the other seven (7).

When someone says: “This is science/scientific…,” they are claiming to have followed the practices of scientific “rhetoric,” that is how to construct a scientific argument.

Whether a scientific argument is correct or not, is an entirely separate question.

April 26, 2014

The Feynman Lectures on Physics

Filed under: Communication,Science — Patrick Durusau @ 4:08 pm

The Feynman Lectures on Physics Online, Free!

From the webpage:

Caltech and The Feynman Lectures Website are pleased to present this online edition of The Feynman Lectures on Physics. Now, anyone with internet access and a web browser can enjoy reading a high quality up-to-date copy of Feynman’s legendary lectures.

The lectures:

Feynman writes in volume 1, 1-1:

You might ask why we cannot teach physics by just giving the basic laws on page one and then showing how they work in all possible circumstances, as we do in Euclidean geometry, where we state the axioms and then make all sorts of deductions. (So, not satisfied to learn physics in four years, you want to learn it in four minutes?) We cannot do it in this way for two reasons. First, we do not yet know all the basic laws: there is an expanding frontier of ignorance. Second, the correct statement of the laws of physics involves some very unfamiliar ideas which require advanced mathematics for their description. Therefore, one needs a considerable amount of preparatory training even to learn what the words mean. No, it is not possible to do it that way. We can only do it piece by piece. (emphasis added)

A remarkable parallel to the use of “logic” on the WWW.

First, logic is only a small part of human reasoning, as Boole acknowledges in the “Laws of Thought.” Second, a “considerable amount of preparatory training” is required to use it.

Feynman has a real talent for explanation. Enjoy!

PS: A disclosed mapping of Feynman’s terminology to current physics would make an interesting project.

April 19, 2014

Tools for Reproducible Research [Reproducible Mappings]

Filed under: Research Methods,Science — Patrick Durusau @ 10:49 am

Tools for Reproducible Research by Karl Broman.

From the post:

A minimal standard for data analysis and other scientific computations is that they be reproducible: that the code and data are assembled in a way so that another group can re-create all of the results (e.g., the figures in a paper). The importance of such reproducibility is now widely recognized, but it is still not so widely practiced as it should be, in large part because many computational scientists (and particularly statisticians) have not fully adopted the required tools for reproducible research.

In this course, we will discuss general principles for reproducible research but will focus primarily on the use of relevant tools (particularly make, git, and knitr), with the goal that the students leave the course ready and willing to ensure that all aspects of their computational research (software, data analyses, papers, presentations, posters) are reproducible.

As you already know, there is a great deal of interest in making scientific experiments reproducible in fact as well as in theory.

At the time time, there has been an increasing interest in reproducible data analysis as it concerns the results from reproducible experiments.

One logically follows on from the other.

Of course, reproducible data analysis as far as any combination of data from different sources, would simply cookie cutter follow the combining of data in a reported experiment.

But what if a user wants to replicate the combining (mapping) of data with other data? From different sources? That could be followed by rote by others but they would not know the underlying basis for the choices made in the mapping.

Experiments take a great deal of effort to identify the substances used in an experiment. When data is combined from different sources, why not do the same for the data?

I first saw this in a tweet by YihuI Xie.

April 17, 2014

Reproducible Research/(Mapping?)

Filed under: Mapping,Research Methods,Science,Semantics,Topic Maps — Patrick Durusau @ 2:48 pm

Implementing Reproducible Research edited by Victoria Stodden, Friedrich Leisch, and Roger D. Peng.

From the webpage:

In many of today’s research fields, including biomedicine, computational tools are increasingly being used so that the results can be reproduced. Researchers are now encouraged to incorporate software, data, and code in their academic papers so that others can replicate their research results. Edited by three pioneers in this emerging area, this book is the first one to explore this groundbreaking topic. It presents various computational tools useful in research, including cloud computing, data repositories, virtual machines, R’s Sweave function, XML-based programming, and more. It also discusses legal issues and case studies.

There is a growing concern over the ability of scientists to reproduce the published results of other scientists. The Economist rang one of many alarm bells when it published: Trouble at the lab [Data Skepticism].

From the introduction to Reproducible Research:

Literate statistical programming is a concept introduced by Rossini () that builds on the idea of literate programming as described by Donald Knuth. With literate statistical programming, one combines the description of a statistical analysis and the code for doing the statistical analysis into a single document. Subsequently, one can take the combined document and produce either a human-readable document (i.e. PDF) or a machine readable code file. An early implementation of this concept was the Sweave system of Leisch which uses R as its programming language and LATEX as its documentation language (). Yihui Xie describes his knitr package which builds substantially on Sweave and incorporates many new ideas developed since the initial development of Sweave. Along these lines, Tanu Malik and colleagues describe the Science Object Linking and Embedding framework for creating interactive publications that allow authors to embed various aspects of computational research in document, creating a complete research compendium. Tools

Of course, we all cringe when we read that a drug company can reproduce only 1/4 of 67 “seminal” studies.

What has me curious is why we don’t have the same reaction when enterprise IT systems require episodic remapping, which requires the mappers to relearn what was known at the time of the last remapping? We all know that enterprise (and other) IT systems change and evolve, but practically speaking, no effort is make to capture the knowledge that would reduce the time, cost and expense of every future remapping.

We can see the expense and danger of science not being reproducible, but when our own enterprise data mappings are not reproducible, that’s just the way things are.

Take inspiration from the movement towards reproducible science and work towards reproducible semantic mappings.

I first saw this in a tweet by Victoria Stodden.

« Newer PostsOlder Posts »

Powered by WordPress