Another Word For It Patrick Durusau on Topic Maps and Semantic Diversity

April 8, 2016

Email Write Order

Filed under: Email,Writing — Patrick Durusau @ 4:16 pm

Email Write Order by David Sparks.

This is more of a reminder to me than you but I pass it along in case you are interested.

From the post:

I’ve always had a gripe with email application developers concerning the way they want us to write emails. When you go to write an email, the tab order is all out of whack.

The default write order starts out with you selecting the recipient for your message, which makes enough sense, but then everything goes off the rails. Next, it wants you to type in the subject line for a message you haven’t written yet. Because you haven’t written the message, there is a bit of mental friction between us getting our thoughts together and making a cogent subject line at that time, so we skip it or just leave it with whatever the mail client added (e.g., “re: re: re: re: re: That Thing”).

Next, the application wants you to write the body of your message. Rarely does the application even prompt you to add an attachment, which means about half the time you’ll forget to add an attachment. Because the default write order is all out of whack, so are the messages we often send using it. It makes a lot more sense to add attachments next and then write the body of the message before filling out the subject line and sending. I’ve got an alternative write order that makes a lot more sense.

Suggestion: Try David’s alternative order for the next twenty or so emails you send.

Whether you bite on his $9.99 Email Field Guide or not, I think you will find the alternate order a useful exercise.

Enjoy!

Lucene/Solr 6.0 Hits The Streets! (There goes the weekend!)

Filed under: Indexing,Lucene,Searching,Solr — Patrick Durusau @ 4:01 pm

From the Lucene PMC:

The Lucene PMC is pleased to announce the release of Apache Lucene 6.0.0 and Apache Solr 6.0.0

Lucene can be downloaded from http://www.apache.org/dyn/closer.lua/lucene/java/6.0.0
and Solr can be downloaded from http://www.apache.org/dyn/closer.lua/lucene/solr/6.0.0

Highlights of this Lucene release include:

  • Java 8 is the minimum Java version required.
  • Dimensional points, replacing legacy numeric fields, provides fast and space-efficient support for both single- and multi-dimension range and shape filtering. This includes numeric (int, float, long, double), InetAddress, BigInteger and binary range filtering, as well as geo-spatial shape search over indexed 2D LatLonPoints. See this blog post for details. Dependent classes and modules (e.g., MemoryIndex, Spatial Strategies, Join module) have been refactored to use new point types.
  • Lucene classification module now works on Lucene Documents using a KNearestNeighborClassifier or SimpleNaiveBayesClassifier.
  • The spatial module no longer depends on third-party libraries. Previous spatial classes have been moved to a new spatial-extras module.
  • Spatial4j has been updated to a new 0.6 version hosted by locationtech.
  • TermsQuery performance boost by a more aggressive default query caching policy.
  • IndexSearcher’s default Similarity is now changed to BM25Similarity.
  • Easier method of defining custom CharTokenizer instances.

Highlights of this Solr release include:

  • Improved defaults for “Similarity” used in Solr, in order to provide better default experience for new users.
  • Improved “Similarity” defaults for users upgrading: DefaultSimilarityFactory has been removed, implicit default Similarity has been changed to SchemaSimilarityFactory, and SchemaSimilarityFactory has been modified to use BM25Similarity as the default for field types that do not explicitly declare a Similarity.
  • Deprecated GET methods for schema are now accessible through the bulk API. The output has less details and is not backward compatible.
  • Users should set useDocValuesAsStored=”false” to preserve sort order on multi-valued fields that have both stored=”true” and docValues=”true”.
  • Formatted date-times are more consistent with ISO-8601. BC dates are now better supported since they are now formatted with a leading ‘-‘. AD years after 9999 have a leading ‘+’. Parse exceptions have been improved.
  • Deprecated SolrServer and subclasses have been removed, use SolrClient instead.
  • The deprecated configuration in solrconfig.xml has been removed. Users must remove it from solrconfig.xml.
  • SolrClient.shutdown() has been removed, use SolrClient.close() instead.
  • The deprecated zkCredientialsProvider element in solrcloud section of solr.xml is now removed. Use the correct spelling (zkCredentialsProvider) instead.
  • Added support for executing Parallel SQL queries across SolrCloud collections. Includes StreamExpression support and a new JDBC Driver for the SQL Interface.
  • New features and capabilities added to the streaming API.
  • Added support for SELECT DISTINCT queries to the SQL interface.
  • New GraphQuery to enable graph traversal as a query operator.
  • New support for Cross Data Center Replication consisting of active/passive replication for separate SolrClouds hosted in separate data centers.
  • Filter support added to Real-time get.
  • Column alias support added to the Parallel SQL Interface.
  • New command added to switch between non/secure mode in zookeeper.
  • Now possible to use IP fragments in replica placement rules.

For features new to Solr 6.0, be sure to consult the unreleased Solr reference manual. (unreleased as of 8 April 2016)

Happy searching!

“No One Willingly Gives Away Power”

Filed under: Government,Intelligence,Topic Maps — Patrick Durusau @ 3:33 pm

Matthew Schofield in European anti-terror efforts hobbled by lack of trust, shared intelligence hits upon the primary reason for resistance to topic maps and other knowledge integration technologies.

Especially in intelligence, knowledge is power. No one willingly gives away power.” (Magnus Ranstorp, Swedish National Defense University)

From clerks who sort mail to accountants who cook the books to lawyers that defend patents and everyone else in between, everyone in an enterprise has knowledge, knowledge that gives them power others don’t have.

Topic maps have been pitched on a “greater good for the whole” basis but as Magnus points out, who the hell really wants that?

When confronted with a new technique, technology, methodology, the first and foremost question on everyone’s mind is:

Do I have more/less power/status with X?

A

approach loses power.

A

approach gains power.

Relevant lyrics:

Oh, there ain’t no rest for the wicked
Money don’t grow on trees
I got bills to pay
I got mouths to feed
And ain’t nothing in this world for free
No I can’t slow down
I can’t hold back
Though you know I wish I could
No there ain’t no rest for the wicked
Until we close our eyes for good

Sell topic maps to increase/gain power.

PS: Keep the line, “No one willingly gives away power” in discussions of why the ICIJ refuses to share the Panama Papers with the public.

1880 Big Data Influencers in CSV File

Filed under: BigData,Twitter,Web Scrapers — Patrick Durusau @ 10:16 am

If you aren’t familiar with Right Relevance, you are missing an amazing resource for cutting through content clutter.

Starting at the default homepage:

rightrelevance-01

You can search for “big data” and the default result screen appears:

influencers-02

If you switch to “people,” the following screen appears:

influencers-03

The “topic score” line moves, so you can require a higher or lesser score for inclusion in the listing. That is helpful if you want only the top people, articles, etc. on a topic or want to reach deeper into the pool of data.

As of yesterday, if you set the “topic score” to the range 70 to 98, the number of people influencers was 1880.

The interface allows you to follow and/or tweet to any of those 1880 people, but only one at a time.

I submitted feedback to Right Relevance on Monday of this week pointing out how useful lists of Twitter handles could be for creating Twitter seed lists, etc., but have not gotten a response.

Part of my query to Right Relevance concerned the failure of a web scraper to match the totals listed in the interface (a far lower number of results than expected).

In the absence of an answer, I continue to experiment with the Web Scraper extension for Chrome to extract data from the site.

Caveat: In order to set the delay for requests in Web Scraper, I have found the settings under “Scrape” ineffectual:

web-scraper-01

In order to induce enough delay to capture the entire list, I set the delay in the exported sitemap (in JSON) and then imported it into another sitemap. Could have reached the same point by setting the delay under the top selector, which was also set to SelectorElementScroll.

To successfully retrieve the entire list, that delay setting was 16000 miliseconds.

There may be more performant solutions but since it ran in a separate browser tab and notified me of completion, time wasn’t an issue.

I created a sitemap that obtains the user’s name, Twitter handle and number of Twitter followers, bigdata-right-relevance.txt.

Oh, the promised 1880-big-data-influencers.csv. (File renamed post-scraping due to naming constraints in Web Scraper.)

At best I am a casual user of Web Scraper so suggestions for improvements, etc., are greatly appreciated.

Has Adobe Flash Ever Been Secure?

Filed under: Cybersecurity,Security — Patrick Durusau @ 8:34 am

Paul Ducklin piece on the latest Adobe Flash 0-day vulnerability, Adobe ships 0-day patch for Flash – get it while it’s hot!, prompts me to ask:

Has Adobe Flash Ever Been Secure?

As of today, the National Vulnerability Database, searching on Adobe Flash produces 797 “hits.”

CVE, using Adobe Flash as the search string, produces 799 “hits.”

Finding the periods, if any, where Flash has been secure, would be a much shorter listing.

In lieu of such a list, however, I have to also ask:

Why are you using Flash to deliver or consume content?

Adobe Flash is a major security problem.

Patching Flash isn’t the solution.

Deleting Flash is.

There is an unfortunate amount of content delivered using Flash.

My solution? No content is worth Adobe Flash vulnerabilities. Ask the content provider to supply content in another format.

April 7, 2016

Weapons of Math Destruction: How Big Data Increases Inequality and Threatens Democracy

Filed under: BigData,Data Science,Ethics,History,Mathematics — Patrick Durusau @ 9:19 pm

Weapons of Math Destruction: How Big Data Increases Inequality and Threatens Democracy by Cathy O’Neil.

math-weapons

From the description at Amazon:

We live in the age of the algorithm. Increasingly, the decisions that affect our lives—where we go to school, whether we get a car loan, how much we pay for health insurance—are being made not by humans, but by mathematical models. In theory, this should lead to greater fairness: Everyone is judged according to the same rules, and bias is eliminated. But as Cathy O’Neil reveals in this shocking book, the opposite is true. The models being used today are opaque, unregulated, and uncontestable, even when they’re wrong. Most troubling, they reinforce discrimination: If a poor student can’t get a loan because a lending model deems him too risky (by virtue of his race or neighborhood), he’s then cut off from the kind of education that could pull him out of poverty, and a vicious spiral ensues. Models are propping up the lucky and punishing the downtrodden, creating a “toxic cocktail for democracy.” Welcome to the dark side of Big Data.

Tracing the arc of a person’s life, from college to retirement, O’Neil exposes the black box models that shape our future, both as individuals and as a society. Models that score teachers and students, sort resumes, grant (or deny) loans, evaluate workers, target voters, set parole, and monitor our health—all have pernicious feedback loops. They don’t simply describe reality, as proponents claim, they change reality, by expanding or limiting the opportunities people have. O’Neil calls on modelers to take more responsibility for how their algorithms are being used. But in the end, it’s up to us to become more savvy about the models that govern our lives. This important book empowers us to ask the tough questions, uncover the truth, and demand change.

Even if you have qualms about Cathy’s position, you have to admit that is a great book cover!

When I was in law school, I had F. Hodge O’Neal for corporation law. He is the O’Neal in O’Neal and Thompson’s Oppression of Minority Shareholders and LLC Members, Rev. 2d.

The publisher’s blurb is rather generous in saying:

Cited extensively, O’Neal and Thompson’s Oppression of Minority Shareholders and LLC Members shows how to take appropriate steps to protect minority shareholder interests using remedies, tactics, and maneuvers sanctioned by federal law. It clarifies the underlying cause of squeeze-outs and suggests proven arrangements for avoiding them.

You could read Oppression of Minority Shareholders and LLC Members that way but when corporate law is taught with war stories from the antics of the robber barons forward, you get the impression that isn’t why people read it.

Not that I doubt Cathy’s sincerity, on the contrary, I think she is very sincere about her warnings.

Where I disagree with Cathy is in thinking democracy is under greater attack now or that inequality is any greater problem than before.

If you read The Half Has Never Been Told: Slavery and the Making of American Capitalism by Edward E. Baptist:

half-history

carefully, you will leave it with deep uncertainty about the relationship of American government, federal, state and local to any recognizable concept of democracy. Or for that matter to the “equality” of its citizens.

Unlike Cathy as well, I don’t expect that shaming people is going to result in “better” or more “honest” data analysis.

What you can do is arm yourself to do battle on behalf of your “side,” both in terms of exposing data manipulation by others and concealing your own.

Perhaps there is room in the marketplace for a book titled: Suppression of Unfavorable Data. More than hiding data, what data to not collect? How to explain non-collection/loss? How to collect data in the least useful ways?

You would have to write it as a how to avoid these very bad practices but everyone would know what you meant. Could be the next business management best seller.

PySparNN [nearest neighbors in sparse, high dimensional spaces (like text documents).]

Filed under: Nearest Neighbor,Python,Sparse Data — Patrick Durusau @ 8:28 pm

PySparNN

From the post:

Approximate Nearest Neighbor Search for Sparse Data in Python! This library is well suited to finding nearest neighbors in sparse, high dimensional spaces (like text documents).

Out of the box, PySparNN supports Cosine Distance (i.e. 1 – cosine_similarity).

PySparNN benefits:

  • Designed to be efficent on sparse data (memory & cpu).
  • Implemented leveraging existing python libraries (scipy & numpy).
  • Easily extended with other metrics: Manhattan, Euclidian, Jaccard, etc.
  • Work in progress – Min, Max distance thresholds can be set at query time (not index time). Example: return the k closest items on the interval [0.8, 0.9] from a query point.

If your data is NOT SPARSE – please consider annoy. Annoy uses a similar-ish method and I am a big fan of it. As of this writing, annoy performs ~8x faster on their introductory example.
General rule of thumb – annoy performs better if you can get your data to fit into memory (as a dense vector).

The most comparable library to PySparNN is scikit-learn’s LSHForrest module. As of this writing, PySparNN is ~1.5x faster on the 20newsgroups dataset. A more robust benchmarking on sparse data is desired. Here is the comparison.

I included the text snippet in the title because PySparNN isn’t clueful, at least not at first glance.

I looked for a good explanation on nearest neighbors and encountered this lecture by Pat Wilson’s (MIT OpenCourseWare):

The lecture has a number of gems, including the observation that:

Town and Country readers tend to be social parasites.

Observations on text and nearest neightbors, time marks 17:30 – 24:17.

You should make an effort to watch the entire video. You will have a broader appreciate for the sheer power of nearest neighbor analysis and as a bonus, some valuable insights on why going without sleep is a very bad idea.

I first saw this in a tweet by Lynn Cherny.

April 6, 2016

Exploratory Programming for the Arts and Humanities

Filed under: Art,Humanities,Programming — Patrick Durusau @ 8:28 pm

Exploratory Programming for the Arts and Humanities by Nick Montfort.

From the webpage:

This book introduces programming to readers with a background in the arts and humanities; there are no prerequisites, and no knowledge of computation is assumed. In it, Nick Montfort reveals programming to be not merely a technical exercise within given constraints but a tool for sketching, brainstorming, and inquiring about important topics. He emphasizes programming’s exploratory potential—its facility to create new kinds of artworks and to probe data for new ideas.

The book is designed to be read alongside the computer, allowing readers to program while making their way through the chapters. It offers practical exercises in writing and modifying code, beginning on a small scale and increasing in substance. In some cases, a specification is given for a program, but the core activities are a series of “free projects,” intentionally underspecified exercises that leave room for readers to determine their own direction and write different sorts of programs. Throughout the book, Montfort also considers how computation and programming are culturally situated—how programming relates to the methods and questions of the arts and humanities. The book uses Python and Processing, both of which are free software, as the primary programming languages.

Full Disclosure: I haven’t seen a copy of Exploratory Programming.

I am reluctant to part with $40.00 US for either print or an electronic version where the major heads in the table of contents read as follows:

1 Modifying a Program

2 Calculating

3 Double, Double

4 Programming Fundamentals

5 Standard Starting Points

6 Text I

7 Text II

8 Image I

9 Image II

10 Text III

11 Statistics and Visualization

12 Animation

13 Sound

14 Interaction

15 Onward

The table of contents shows more than one hundred pages out of two hundred and sixty-three are spend on introduction to computer programming topics.

Text, which has a healthy section on string operations, merits a mere seventy pages. The other one hundred pages is split between visualization, sound, animation, etc.

Compare that table of contents with this one*:

Chapter One – Modular Programming: An Approach

Chapter Two – Data Entry and Text Verification

Chapter Three – Index and Concordance

Chapter Four – Text Criticism

Chapter Five – Improved Searching Techniques

Chapter Six – Morphological Analysis

Which table of contents promises to be more useful for exploration?

Personal computers are vastly more powerful today than when the second table of contents was penned.

Yet, students start off as though they are going to write their own tools from scratch. Unlikely and certainly not the best use of their time.

In depth coverage of the NLTK Toolkit historical or contemporary texts, in depth, would teach them a useful tool. A tool they could apply to other material.

To cover machine learning, consider Weka. A tool students can learn in class and then apply in new and different situations.

There are tools for image and sound analysis but the important term is tool.

Just as we don’t teach students to make their own paper, we should focus on enabling them to reap the riches that modern software tools offer.

Or to put it another way, let’s stop repeating the past and move forward.

* Oh, the second table of contents? Computer Programs for Literary Analysis, John R. Abercrombie, Philadelphia : Univ. of Philadelphia Press, ©1984. Yes, 1984.

Advanced Data Mining with Weka – Starts 25 April 2016

Filed under: Machine Learning,Python,R,Spark,Weka — Patrick Durusau @ 4:43 pm

Advanced Data Mining with Weka by Ian Witten.

From the webpage:

This course follows on from Data Mining with Weka and More Data Mining with Weka. It provides a deeper account of specialized data mining tools and techniques. Again the emphasis is on principles and practical data mining using Weka, rather than mathematical theory or advanced details of particular algorithms. Students will analyse time series data, mine data streams, use Weka to access other data mining packages including the popular R statistical computing language, script Weka in Python, and deploy it within a cluster computing framework. The course also includes case studies of applications such as classifying tweets, functional MRI data, image classification, and signal peptide prediction.

The syllabus: https://weka.waikato.ac.nz/advanceddataminingwithweka/assets/pdf/syllabus.pdf.

Advanced Data Mining with Weka is open for enrollment and starts 25 April 2016.

Five very intense weeks await!

Will you be there?

I first saw this in a tweet by Alyona Medelyan.

UnVerified (By You) Data and Computational Journalism – Panama Papers

Filed under: Journalism,News,Reporting — Patrick Durusau @ 4:27 pm

Jonathan Gray has started a tread to capture the unfolding stories around the #PanamaPapers leak: Best examples of data journalism and computational journalism projects around tax?.

You are at the disadvantage with these visualizations because you don’t have access to the underlying data.

It’s akin to accepting an accountant’s summary of accounts without being able to examine the details on which those summaries are based.

You may be comfortable with putting that much faith in a summary, but I’m not.

That’s not a slur on the reporters or even accountants.

You know the motto:

In God We Trust, With All Others, Verify.

Any questions?

Transparency/Accountability and Investigative Journalists

Filed under: Journalism,News,Reporting — Patrick Durusau @ 2:35 pm

Let me start by saying that I applaud and support all of the work done by the International Consortium of Investigative Journalists (ICIJ).

The recent Panama Paper story illustrates the one point of departure that I have with the ICIJ.

Rather than providing everyone with equal access to the leaked documents, it is my understanding that the ICIJ will continue to limit access to those documents to “investigative journalists.”

I don’t question the role or work done by these “investigative journalists” on this story. They have observed remarkable operational security and produced much fuller account than the bare information would have supported.

Having said that, I have these questions:

  1. How do I know these journalists found the same story I would read in the original documents?
  2. How do I know these journalists made the same connections I would make for the people mentioned in the documents?
  3. How is their reporting “transparent” if I can’t compare both their stories and the original documents?
  4. How are journalists held “accountable” if the basis for that accountability, the original documents, remain forever secret?

Governments argue that national security, privacy, etc., are always at stake, but the history of leaks in the United States shows all those concerns to be false.

The true concerns true out to be concealment of illegality, incompetence, vanity, and a host of other unsavory motives.

From the Pentagon Papers to the Afghan War Diaries, the sky has never fallen, the Republic has not collapsed, milk has not soured across the land, etc.

I am not suggesting that reporters ever, under any circumstances, be compelled to reveal their sources, but with the Panama Papers there is a document trove with no such implications.

If I am going to inveigh for the government to be transparent in its decision making, on what basis should I hold investigative reporters to a lesser standard?

BTW, the withholding information to protect “privacy” rings just a bit hollow, considering that if anything, it was an invasion of privacy for the journalists to obtain the information. Should have been deleted on receipt if privacy was a concern.

April 5, 2016

NSA-grade surveillance software: IBM i2 Analyst’s Notebook (Really?)

Filed under: Government,Graphs,Neo4j,NSA,Privacy,Social Networks — Patrick Durusau @ 8:20 pm

I stumbled across Revealed: Denver Police Using NSA-Grade Surveillance Software which had this description of “NSA-grade surveillance software…:”


Intelligence gathered through Analyst’s Notebook is also used in a more active way to guide decision making, including with deliberate targeting of “networks” which could include loose groupings of friends and associates, as well as more explicit social organizations such as gangs, businesses, and potentially political organizations or protest groups. The social mapping done with Analyst’s Notebook is used to select leads, targets or points of intervention for future actions by the user. According to IBM, the i2 software allows the analyst to “use integrated social network analysis capabilities to help identify key individuals and relationships within networks” and “aid the decision-making process and optimize resource utilization for operational activities in network disruption, surveillance or influencing.” Product literature also boasts that Analyst’s Notebook “includes Social Network Analysis capabilities that are designed to deliver increased comprehension of social relationships and structures within networks of interest.”

Analyst’s Notebook is also used to conduct “call chaining” (show who is talking to who) and analyze telephone metadata. A software extension called Pattern Tracer can be used for “quickly identifying potential targets”. In the same vein, the Esri Edition of Analyst’s Notebook integrates powerful geo-spatial mapping, and allows the analyst to conduct “Pattern-of-Life Analysis” against a target. A training video for Analyst’s Notebook Esri Edition demonstrates the deployment of Pattern of Life Analysis in a military setting against an example target who appears appears to be a stereotyped generic Muslim terrorism suspect:

Perhaps I’m overly immune to IBM marketing pitches but I didn’t see anything in this post that could not be done with Python, R and standard visualization techniques.

I understand that IBM markets the i2 Analyst’s Notebook (and training too) as:

…deliver[ing] timely, actionable intelligence to help identify, predict, prevent and disrupt criminal, terrorist and fraudulent activities.

to a reported tune of over 2,500 organizations worldwide.

However, you have to bear in mind the software isn’t delivering that value-add but rather the analyst plus the right data and the IBM software. That is the software is at best only one third of what is required for meaningful results.

That insight seems to have gotten lost in IBM’s marketing pitch for the i2 Analyst’s Notebook and its use by the Denver police.

But to be fair, I have included below the horizontal bar, the complete list of features for the i2 Analyst’s Notebook.

Do you see any that can’t be duplicated with standard software?

I don’t.

That’s another reason to object to the Denver Police falling into the clutches of maintenance agreements/training on software that is likely irrelevant to their day to day tasks.


IBM® i2® Analyst’s Notebook® is a visual intelligence analysis environment that can optimize the value of massive amounts of information collected by government agencies and businesses. With an intuitive and contextual design it allows analysts to quickly collate, analyze and visualize data from disparate sources while reducing the time required to discover key information in complex data. IBM i2 Analyst’s Notebook delivers timely, actionable intelligence to help identify, predict, prevent and disrupt criminal, terrorist and fraudulent activities.

i2 Analyst’s Notebook helps organizations to:

Rapidly piece together disparate data

Identify key people, events, connections and patterns

Increase understanding of the structure, hierarchy and method of operation

Simplify the communication of complex data

Capitalize on rapid deployment that delivers productivity gains quickly

Be sure to leave a comment if you see “NSA-grade” capabilities. We would all like to know what those are.

Linux System Calls – Linux/Mac/Windows

Filed under: Cybersecurity,Linux OS,Security — Patrick Durusau @ 3:44 pm

Well, not quite yet but closer than it has been in the past!

The Definitive Guide to Linux System Calls.

From the post:

This blog post explains how Linux programs call functions in the Linux kernel.

It will outline several different methods of making systems calls, how to handcraft your own assembly to make system calls (examples included), kernel entry points into system calls, kernel exit points from system calls, glibc wrappers, bugs, and much, much more.

The only downside of the movement towards Linux is that its kernel, etc., will get much heavier scrutiny than in the past.

In the past, why bother with stronger code in a smaller market share?

Move Linux into a much larger market share, we may get to see if “…to many eyes all bugs are shallow.”

As an empirical matter, not just cant.

Python Code + Data + Visualization (Little to No Prose)

Filed under: Graphics,Programming,Python,Visualization — Patrick Durusau @ 12:46 pm

Up and Down the Python Data and Web Visualization Stack

Using the “USGS dataset listing every wind turbine in the United States:” this notebook walks you through data analysis and visualization with only code and visualizations.

That’s it.

Aside from very few comments, there is no prose in this notebook at all.

You will either hate it or be rushing off to do a similar notebook on a topic of interest to you.

Looking forward to seeing the results of those choices!

720 Thousand Chemicals – Chemistry Dashboard

Filed under: Cheminformatics,Chemistry — Patrick Durusau @ 10:24 am

Chemistry Dashboard – 720 Thousand Chemicals

Beta test of a Google-like search interface by the United States Environmental Protection Agency on chemical data.

Search results return “Intrisic Properties,” “Structural Identifiers,” and a “Citation” for your search to the right of a molecular diagram of the object of your search.

A series of tabs run across the page offering, “Chemical Properties,” “External Links,” “Synonyms,” “PubChem Biological Activities,” “PubChem Articles,” “PubChem Patents,” and “Comments.”

And Advanced Search option is offered as well. (Think of it as identifying a subject by its properties.)

The about page has this description with additional links and a pointer to a feedback form for comments:

The interactive Chemical Safety for Sustainability Chemistry Dashboard (the iCSS chemistry dashboard) is a part of a suite of databases and web applications developed by the US Environmental Protection Agency’s Chemical Safety for Sustainability Research Program. These databases and apps support EPA’s computational toxicology research efforts to develop innovative methods to change how chemicals are currently evaluated for potential health risks. EPA researchers integrate advances in biology, biotechnology, chemistry, and computer science to identify important biological processes that may be disrupted by the chemicals. The combined information helps prioritize chemicals based on potential health risks. Using computational toxicology research methods, thousands of chemicals can be evaluated for potential risk at small cost in a very short amount of time.

The iCSS chemistry dashboard is the public chemistry resource for these computational toxicology research efforts and it supports improved predictive toxicology. It provides access to data associated with over 700,000 chemicals. A distinguishing feature of the chemistry dashboard is the mapping of curated physicochemical property data associated with chemical substances to their corresponding chemical structures. The chemical dashboard is searchable by various chemical identifiers including CAS Registry Numbers, systematic and common names, and InChIKeys. Millions of predicted physchem properties developed using machine-learning approaches modeling highly curated datasets are also mapped to chemicals within the dashboard.

The data in the dashboard are of varying quality with the highest quality data being assembled by the DSSTox Program. The majority of the chemical structures within the database have been compiled from public sources, such as PubChem, and have varying levels of reliability and accuracy. Links to over twenty external resources are provided. These include other dashboard apps developed by EPA and other agency, interagency and public databases containing data of interest to environmental chemists. It also integrates chemistry linkages across other EPA dashboards and chemistry resources such as ACToR, ToxCast, EDSP21 and CPCat. Expansion, curation and validation of the content is ongoing.

The iCSS Chemistry Dashboard also takes advantage of a number of Open Source widgets and tools. These include the developers of the JSMol 3D display widget and the PubChem widgets for Bioactivities, Articles and Patents, and we are grateful to these developers for their contributions. Should you use the iCSS Chemistry Dashboard to source information and data of value please cite the app using the URL http://comptox.epa.gov/dashboard. For a particular chemical, the specific citation can be obtained on the page under the Citation tab.

An excellent example of how curation of a data resources and linking it to other data resources is a general benefit to everyone.

I first saw this in a tweet by ChemConnector.

Pentagon Confirms Crowdsourcing of Map Data

Filed under: Crowd Sourcing,Mapping,Maps,Military,Topic Maps — Patrick Durusau @ 10:01 am

I have mentioned before, Tracking NSA/CIA/FBI Agents Just Got Easier, The DEA is Stalking You!, how citizens can invite federal agents to join the gold fish bowl being prepared for the average citizen.

Of course, that’s just me saying it, unless and until the Pentagon confirms the crowdsourcing of map data!

Aliya Sternstein writes
in Soldiers to Help Crowdsource Spy Maps:


“What a great idea if we can get our soldiers adding fidelity to the maps and operational picture that we already have” in Defense systems, Gordon told Nextgov. “All it requires is pushing out our product in a manner that they can add data to it against a common framework.”

Comparing mapping parties to combat support activities, she said, soldiers are deployed in some pretty remote areas where U.S. forces are not always familiar with the roads and the land, partly because they tend to change.

If troops have a base layer, “they can do basically the same things that that social party does and just drop pins and add data,” Gordon said from a meeting room at the annual Esri conference. “Think about some of the places in Africa and some of the less advantaged countries that just don’t have addresses in the way we do” in the United States.

Of course, you already realize the value of crowd-sourcing surveillance of government agents but for the c-suite crowd, confirmation from a respected source (the Pentagon) may help push your citizen surveillance proposal forward.

BTW, while looking at Army GeoData research plans (pages 228-232), I ran across this passage:

This effort integrates behavior and population dynamics research and analysis to depict the operational environment including culture, demographics, terrain, climate, and infrastructure, into geospatial frameworks. Research exploits existing open source text, leverages multi-media and cartographic materials, and investigates data collection methods to ingest geospatial data directly from the tactical edge to characterize parameters of social, cultural, and economic geography. Results of this research augment existing conventional geospatial datasets by providing the rich context of the human aspects of the operational environment, which offers a holistic understanding of the operational environment for the Warfighter. This item continues efforts from Imagery and GeoData Sciences, and Geospatial and Temporal Information Structure and Framework and complements the work in PE 0602784A/Project T41.

Doesn’t that just reek with subjects that would be identified differently in intersecting information systems?

One solution would be to fashion top down mapping systems that are months if not years behind demands in an operational environment. Sort of like tanks that overheat in jungle warfare.

Or you could do something a bit more dynamic that provides a “good enough” mapping for operational needs and yet also has the information necessary to integrate it with other temporary solutions.

Data Journalism Fundamentals – Focus on Asia

Filed under: Journalism,News,Reporting — Patrick Durusau @ 9:27 am

Data Journalism Fundamentals (MOOC).

From the courses page:

The Journalism and Media Studies Centre (JMSC) at the University of Hong Kong will offer a five-session Massive Open Online Course on the fundamentals of data journalism in the spring of 2016 in partnership with Google. The MOOC will target journalists at all levels of experience as well as students. The data journalism course will be offered as one of a series of Asia-based MOOC’s on digital tools for journalism, including data journalism, interactive design and visualization.

The course began 4 April 2016 so you still have time to jump on board!

Finding data is only the first step.

Discovering relationships between people, events, actions, what we call associations in topic maps, are the flesh of your story.

April 4, 2016

Xindex – the voice of free expression

Filed under: Censorship,Government — Patrick Durusau @ 3:41 pm

Xindex – the voice of free expression

You can support Xindex by subscribing to the quarterly Index on Censorship magazine, donating to support Xindex, or volunteering (the volunteer link is broken, I have written to report it).

I support their work even though I differ from the Xindex on its recognition of Article 10 of the European Convention on Human Rights as legitimate limits on the right to free speech.

Those limits in Article 10 read:

“The exercise of these freedoms, since it carries with it duties and responsibilities, may be subject to such formalities, conditions, restrictions or penalties as are prescribed by law and are necessary in a democratic society, in the interests of national security, territorial integrity or public safety, for the prevention of disorder or crime, for the protection of health or morals, for the protection of the reputation or the rights of others, for preventing the disclosure of information received in confidence, or for maintaining the authority and impartiality of the judiciary.”

That’s a “load of tosh.”

Who do you think is protected by:

…for preventing the disclosure of information received in confidence….

Can you say Panama Papers?

Information received and documents created “in confidence.” Yes?

One plausible reading of Article 10 of the European Convention on Human Rights would leave us without disclosure of the Panama Papers.

I differ from Xindex there being any government limits on free speech (that’s why we have civil courts), but it remains a project that deserves your patronage and support.

SQL Injection Cheat Sheet

Filed under: Cybersecurity,Security — Patrick Durusau @ 10:16 am

SQL Injection Cheat Sheet

From the webpage:

An SQL injection cheat sheet is a resource in which you can find detailed technical information about the many different variants of the SQL Injection vulnerability. This cheat sheet is of good reference to both seasoned penetration tester and also those who are just getting started in web application security.

If you are interested in helping government agencies or corporations locate insecure web applications, this cheat sheet will come in handy.

For governments remember that older, unpatched databases are the rule rather than the exception.

Cherry Picking Panama Papers? Like Wikileaks, NYT, Guardian on Afghanistan War Diaries?

Filed under: Journalism,News,Reporting — Patrick Durusau @ 9:39 am

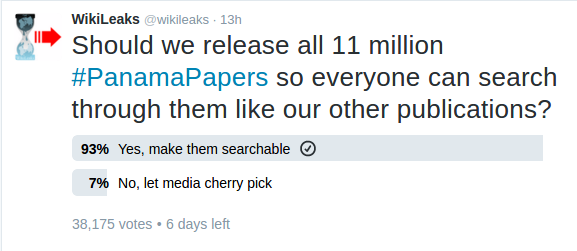
The “cherry picking” implications of this tweet:

Cherry-picking-panama

surprised me.

Wikileaks, the New York Times and the Guardian “cherry picked” the Afghanistan War Diaries, as just one example:

Most of the material, though classified “secret” at the time, is no longer militarily sensitive. A small amount of information has been withheld from publication because it might endanger local informants or give away genuine military secrets. WikiLeaks, whose founder, Julian Assange, obtained the material in circumstances he will not discuss, said it would redact harmful material before posting the bulk of the data on its “uncensorable” servers. (Afghanistan war logs: Massive leak of secret files exposes truth of occupation)

How that for privilege? Not only can you participate in activities that blight the lives of others but the “independent” press will protect you from exposure. Now that’s Privilege with a capital P.

I admit there is an appalling lack of coverage of major Western governments, corporations and individuals, thus far in the Panama Papers reporting but if access to the leak spreads, that should be quickly corrected.

Ahem, yes, “…if access to the leak spreads…” being the operative condition.

Not access to some of the leak. Not access to the leaks with “…harmful material…” redacted. Not access to “…relevant…” part of the leaks.

Access to all of the leaked material. No exceptions.

If we are unable to effectively participate in government without government transparency, how are we to judge media reporting without media transparency?

April 3, 2016

Panama Papers: where the money is hiding

Filed under: CartoDB — Patrick Durusau @ 8:42 pm

Panama Papers: where the money is hiding

A Cartodb.com visualization by country of corporations, etc., named in the Panama Papers.

As experience with the data set develops, linking this summary to individual documents and named individuals would be an enormous but very useful resource.

Makes one wonder what it will be like if similar leaks develop at other “international” law firms?

Will a leak a day make corruption go away?

Panama Papers: Victims of Offshore

Filed under: Government,Journalism,News,Reporting — Patrick Durusau @ 4:06 pm

From the description:

The Panama Papers is a global investigation into the sprawling, secretive industry of offshore that the world’s rich and powerful use to hide assets and skirt rules by setting up front companies in far-flung jurisdictions.

Based on a trove of more than 11 million leaked files, the investigation exposes a cast of characters who use offshore companies to facilitate bribery, arms deals, tax evasion, financial fraud and drug trafficking.

Behind the email chains, invoices and documents that make up the Panama Papers are often unseen victims of wrongdoing enabled by this shadowy industry. This is their story.

For more, go to panamapapers.icij.org

As you might expect, the The International Consortium of Investigative Journalists with further details, The Panama Papers: Politicians, Criminals and the Rogue Industry That Hides Their Cash, is just a tad over-loaded at the moment.

Specifics about the investigation to date and the data + methodology are available at this site.

When the site and data become more accessible, curious what extensions to the existing investigations will be made?

Wind/Weather Maps

Filed under: Visualization,Weather Data — Patrick Durusau @ 3:16 pm

A Twitter thread started by Data Science Renee mentioned these three wind map resources:

Wind Map

wind-map-03-April-2016

EarthWindMap Select “earth” for a menu of settings and controls.

wind-earth

Windyty Perhaps the most full featured of the three wind maps. Numerous controls that are not captured in the screenshot. Including webcams.

wind-windyty

Suggestions of other real time visualizations of weather data?

Leaving you to answer the question:

What other data would you tie to weather conditions/locations? Perhaps more importantly, why?

April 2, 2016

2.95 Million Satellite Images (Did I mention free?)

Filed under: Cartography,Image Processing,Image Understanding,Maps — Patrick Durusau @ 8:40 pm

NASA just released 2.95 million satellite images to the public — here are 21 of the best by Rebecca Harrington.

From the post:

An instrument called the Advanced Spaceborne Thermal Emission and Reflection Radiometer — or ASTER, for short — has been taking pictures of the Earth since it launched into space in 1999.

In that time, it has photographed an incredible 99% of the planet’s surface.

Although it’s aboard NASA’s Terra spacecraft, ASTER is a Japanese instrument and most of its data and images weren’t free to the public — until now.

NASA announced April 1 that ASTER’s 2.95 million scenes of our planet are now ready-to-download and analyze for free.

With 16 years’ worth of images, there are a lot to sort through.

One of Rebecca’s favorites:

andes-mountains

You really need to select that image and view it at full size. I promise.

The Andes Mountains. Colors reflect changes in surface temperature, materials and elevation.

Time Maps:…

Filed under: Mapping,Maps,Time,Timelines — Patrick Durusau @ 4:49 pm

Time Maps: Visualizing Discrete Events Across Many Timescales by Max Watson.

From the post:

In this blog post, I’ll describe a technique for visualizing many events across multiple timescales in a single image, where little or no zooming is required. It allows the viewer to quickly identify critical features, whether they occur on a timescale of milliseconds or months. It is adopted from the field of chaotic systems, and was originally conceived to study the timing of water drops from a dripping faucet. The visualization has gone by various names: return map, return-time map, and time vs. time plot. For conciseness, I will call them “time maps.” Though time maps have been used to visualize chaotic systems, they have not been applied to information technology. I will show how time maps can provide valuable insights into the behavior of Twitter accounts and the activity of a certain type of online entity, known as a bot.

This blog post is a shorter version of a paper I recently wrote, but with slightly different examples. The paper was accepted to the 2015 IEEE Big Data Conference. The end of the blog also contains sample Python code for creating time maps.

Building a time map is easy. First, imagine a series of events as dots along a time axis. The time intervals between each event are labeled as t1, t2, t3, t4, …

watson-1

A time map is simply a two-dimensional scatterplot, where the xy coordinates of the events are: (t1,t2), (t2, t3), (t3, t4), and so on. On a time map, the purple dot would be plotted like this:

watson-2

In other words, each point in the scatterplot represents an event. The x-coordinate of an event is the time between the event itself and the preceding event. An event’s y-coordinate is the time between the event itself and the subsequent event. The only points that are not displayed in a time map are the first and last events of the dataset.

Max goes on to cover the heuristics of time maps, along with the Python code for generating them.

Max’s time maps use a common time line for events and so aren’t well suited to visualizing overlapping narrative time frames such as occur in novels and/or real life.

I first saw this in a tweet by Data Science Renee

A social newsgathering ethics code from ONA

Filed under: Ethics,Journalism,News,Reporting — Patrick Durusau @ 4:17 pm

Common ground: A social newsgathering ethics code from ONA by Eric Carvin.

From the post:

Today, we’re introducing the ONA Social Newsgathering Ethics Code, a set of best practices that cover everything from verification to rights issues to the health and safety of sources — and of journalists themselves.

We’re launching the code with support from a number of news organizations, including the BBC, CNN, AFP, Storyful and reported.ly. You can see the complete list of supporters at the end of the code.

We’re constantly reminded of the need for best practices such as these. The recent bombings in Brussels, Ankara, Lahore and Yemen, among others, provided yet another stark and tragic reminder of how information and imagery spread, in a matter of moments, from the scene of an unexpected news event to screens around the world.

Moments like these challenge us, as journalists, to tell a fast-moving story in a way that’s informative, detailed and accurate. These days, a big part of that job involves wading through a roiling sea of digital content and making sense out of what we surface.

There is one tenet of this ethics code that should be applied in all cases, not just user-generated content:

Being transparent with the audience about the verification status of UGC.

If you applied that principle to stories based on statements from the FBI would read:

Unconfirmed reports from the FBI say….

Yes?

How would you confirm a report from the FBI?

Ask another FBI person to repeat what was said by the first one?

Obtain the FBI sources and cross-check with those sources the report of the FBI?

If not the second one, why not?

Cost? Time? Convenience?

Which of those results in your parroting reports from the FBI most often?

Is that an ethical issue or is the truthfulness of the FBI assumed, all evidence to the contrary notwithstanding?

Discrimination Against Arabs In Death As Well As In Life

Filed under: Journalism,News,Reporting — Patrick Durusau @ 3:41 pm

Adam Johnson reminds us in For U.S. Media, Victims of ISIL Terror in Europe Are 1,200 Percent More Newsworthy Than Those in Middle East, that Arabs don’t matter much to the U.S. media, in life or death.

From the post:

Since the back-to-back ISIL attacks in Beirut and Paris last in November of last year, many in media have noted the disparity in the outpouring of grief and coverage when ISIL attacks happen in Europe versus the Middle East. Recent attacks in Brussels have led others, including Salon’s Ben Norton and The Intercept’s Glenn Greenwald to note a similar phenomenon: The U.S. media simply values European lives over those in the Middle East. And because neither Brussels or France are English-speaking nations or are in the greater United States, this can only lead to one conclusion: race is an essential factor when U.S. media determine what terror attacks to cover. Predominantly white countries simply matter more.

This racism is heavily informed by the U.S.’ ongoing wars in the Middle East. Since President Obama has taken office, he has launched seven bombing campaigns of Muslim-majority countries. This decades-long war positioning against the “other” has helped normalized deaths in the Middle East even beyond that of routine racism. But how wide is this disparity? I have attempted to quantify the gap in coverage using two comparable examples from Europe and the Middle East in the past six months.

Adam gives a thumb-nail sketch of attacks over the past six months and the resulting media coverage to arrive at his conclusion that ISIL (sic, Islamic State) attacks in Europe are 1,200 percent more newsworthy than in the Middle East.

I find Adam quite persuasive but from a critical analysis perspective, have some suggestions that would strengthen his case.

For example, expanding his six months to cover the last five years and not limit attacks to those by ISIL (sic, Islamic State).

From memory (you need to check me on this), attacks in Arab countries, in particular attacks by the United States and a number of other Western powers, receive almost no coverage at all. Attacks in some countries, not necessarily by the Islamic State, become international hype storms.

Most Western press discriminates against Arabs and their legitimate concerns in both life and death. Then wonders why anyone would become “radicalized?”

Suggestions on how to build a “discrimination against Arabs” index for pubic media?

If the Western media continues to discriminate against Arabs, it should wear that badge openly.

State Visa Breach – ISIS To Hack State

Filed under: Cybersecurity,Security — Patrick Durusau @ 1:31 pm

Mike Levine and Justin Fishel report yet more vulnerabilities in government databases in Security Gaps Found in Massive Visa Database.

From the post:

Cyber-defense experts found security gaps in a State Department system that could have allowed hackers to doctor visa applications or pilfer sensitive data from the half-billion records on file, according to several sources familiar with the matter –- though defenders of the agency downplayed the threat and said the vulnerabilities would be difficult to exploit.

Briefed to high-level officials across government, the discovery that visa-related records were potentially vulnerable to illicit changes sparked concern because foreign nations are relentlessly looking for ways to plant spies inside the United States, and terrorist groups like ISIS have expressed their desire to exploit the U.S. visa system, sources added.

That sounds serious so I was doing due diligence, ho-humming through the report when I ran across this explanation for why this isn’t serious:


CCD allows authorized users to submit notes and recommendations directly into applicants’ files. But to alter visa applications or other visa-related information, hackers would have to obtain “the right level of permissions” within the system -– no easy task, according to State Department officials.

Hmmmm, ‘…”the right level of permissions” within the system…’

I’m sorry, do they mean like root? 😉

Levine and Fishel aren’t specific about the vulnerabilities, there are public reports to point you in the right direction:

Audit of Department of State Information Security Program

November 2012 https://oig.state.gov/system/files/202261.pdf

November 2013 https://oig.state.gov/system/files/220933.pdf

October 2014 https://oig.state.gov/system/files/aud-it-15-17.pdf

November 2015 https://oig.state.gov/system/files/aud-it-16-16.pdf

Management Assistance Report: Department of State Incident Response and Reporting Program

February 2016 https://oig.state.gov/system/files/aud-it-16-26.pdf

With redactions you will have to work backwards from FISMA, OMB, and NIST requirements and vulnerabilities discovered in other governmental systems.

The sort of mosaic work at which topic maps excel.


As far as ISIS hacking the visa system, you can imagine the conversation at ISIS HQ:

Speaker 1: I want to volunteer for mission X in the United States.

Speaker 2: Do you have a valid US Visa?

Speaker 1: No, it was denied.

Speaker 2: Sorry, this mission is for holders of valid US visas only. Apply for another mission.

Right. Speaker 1 is volunteering for a mission that may result in the deaths of hundreds, possibly even themselves, but they are stopped from visiting the US for lack of a valid visa.

Does that strike you as an odd juxtaposition of concerns?

If you can’t think of non-visa controlled ways to enter the United States, you are too dumb to be a jihadist or to be defending against them.

April 1, 2016

Takedowns Hurt Free Expression

Filed under: Fair Use,Free Speech,Intellectual Property (IP) — Patrick Durusau @ 9:00 pm

EFF to Copyright Office: Improper Content Takedowns Hurt Online Free Expression.

From the post:

Content takedowns based on unfounded copyright claims are hurting online free expression, the Electronic Frontier Foundation (EFF) told the U.S. Copyright Office Friday, arguing that any reform of the Digital Millennium Copyright Act (DMCA) should focus on protecting Internet speech and creativity.

EFF’s written comments were filed as part of a series of studies on the effectiveness of the DMCA, begun by the Copyright Office this year. This round of public comments focuses on Section 512, which provides a notice-and-takedown process for addressing online copyright infringement, as well as “safe harbors” for Internet services that comply.

“One of the central questions of the study is whether the safe harbors are working as intended, and the answer is largely yes,” said EFF Legal Director Corynne McSherry. “The safe harbors were supposed to give rightsholders streamlined tools to police infringement, and give service providers clear rules so they could avoid liability for the potentially infringing acts of their users. Without those safe harbors, the Internet as we know it simply wouldn’t exist, and our ability to create, innovate, and share ideas would suffer.”

As EFF also notes in its comments, however, the notice-and-takedown process is often abused. A recent report found that the notice-and-takedown system is riddled with errors, misuse, and overreach, leaving much legal and legitimate content offline. EFF’s comments describe numerous examples of bad takedowns, including many that seemed based on automated content filters employed by the major online content sharing services. In Friday’s comments, EFF outlined parameters endorsed by many public interest groups to rein in filtering technologies and protect users from unfounded blocks and takedowns.

A must read whether you are interested in pursuing traditional relief or have more immediate consequences for rightsholders in mind.

Takedowns cry out for the application of data mining to identify the people who pursue takedowns, the use of takedowns, who benefits, to say nothing of the bots that are presently prowling the web looking for new victims.

I for one don’t imagine that rightsholders bots are better written than most government software (you did hear about State’s latest vulnerability?).

Sharpening your data skills on takedown data would benefit you and the public, which is being sorely abused at the moment.

FBI Adds New Meaning to “Safe Sex”

Filed under: FBI,Government — Patrick Durusau @ 8:41 pm

FBI Honeypot Ensnares Michagan Man by Trevor Aaronson.

From the post:

KHALIL ABU RAYYAN was a lonely young man in Detroit, eager to find a wife. Jannah Bride claimed she was a 19-year-old Sunni Muslim whose husband was killed in an airstrike in Syria. The two struck up a romantic connection through online communications.

Now, Rayyan, a 21-year-old Michigan man, is accused by federal prosecutors of supporting the Islamic State.

Documents released Tuesday show, however, that Rayyan was motivated not by religious radicalism but by the desire to impress Bride, who said she wanted to be a martyr.

Jannah Bride, not a real name, was in fact an FBI informant hired to communicate with Rayyan, who first came to the FBI’s attention when he retweeted a video from the Islamic State of people being thrown from buildings. He wrote later on Twitter: “Thanks, brother, that made my day.”

If you are shy, socially awkward and a woman is throwing herself at you, that’s a warning sign.

Either you have Ben Franklins leaking from your pockets or it is an FBI sting operation.

Check your pockets.

I don’t know of any reliable test for FBI informants but if people:

  1. Volunteer money for illegal purchases
  2. Urge you to say or plan illegal acts
  3. Provide you with plans for illegal objects or substances
  4. Initiate/maintain contact with you for 1, 2, or 3

The question you have to ask yourself:

If they are so hot for action, why are they pestering you?

Unless you think a long stretch in a U.S. prison looks good on your resume, avoid people who want to facilitate you committing illegal acts.

They have an agenda and it isn’t to benefit you. Only themselves.

« Newer Posts

Powered by WordPress