Another Word For It Patrick Durusau on Topic Maps and Semantic Diversity

December 9, 2014

Digital Humanities in the Southeast 2014

Filed under: Humanities — Patrick Durusau @ 3:32 pm

Digital Humanities in the Southeast 2014

Big data is challenging because of the three or four V’s, depending on who you believe. (Originally, volume, variety, and velocity. At some later point, veracity was added.) When big data fully realizes the need for semantics, they will need to add a capital S.

If you want to prepare for that eventuality, the humanities have projects where the data sets are small compared to big data but suffer from the big S, as in semantics.

A number of workshop presentations are listed, most with both audio and slides. Ranging from Latin and history to war and Eliot.

A great opportunity to see problems that are not difficult in the four Vs sense but are difficult none the less.

I first saw this in a tweet by Brian Croxall.

December 8, 2014

Apologies for Monday, December 8, 2014

Filed under: Marketing — Patrick Durusau @ 9:04 pm

Greetings!

My sincere apologies for not posting useful content to the blog today. I got caught up in mining a 4K+ court transcript (wonder who what would be about?) and simply ran out of viable thinking time.

I did not want to insult you by simply throwing something up that I haven’t read, viewed or devoted some time to thinking about.

Tomorrow I have some posts warming up on CRDTs and other interesting topics.

I am also running days behind on my Twitter stream and have yet to see a Twitter client that is useful in that situation. Lots of Twitter client perform searches but how do I search for a post that I do not know appeared? On a subject that, as far as I know, hasn’t been named. Yes?

Search is ok, I use it all the time. But it is best when you don’t care about the quality of the results and/or you have a lot of time to refine the results.

Although I do have to admit one major search engine has stopped suggesting advertising when I search for things like cuneiform. 😉

Hope your week is off to a great start and I look forward to posting material that may interest you tomorrow!

December 7, 2014

Lab Report: The Final Grade [Normalizing Corporate Small Data]

Filed under: Cloudera,Data Conversion,Hadoop — Patrick Durusau @ 8:34 pm

Lab Report: The Final Grade by Dr. Geoffrey Malafsky.

From the post:

We have completed our TechLab series with Cloudera. Its objective was to explore the ability of Hadoop in general, and Cloudera’s distribution in particular, to meet the growing need for rapid, secure, adaptive merging and correction of core corporate data. I call this Corporate Small Data which is:

“Structured data that is the fuel of an organization’s main activities, and whose problems with accuracy and trustworthiness are past the stage of being alleged. This includes financial, customer, company, inventory, medical, risk, supply chain, and other primary data used for decision making, applications, reports, and Business Intelligence. This is Small Data relative to the much ballyhooed Big Data of the Terabyte range.”1

Corporate Small Data does not include the predominant Big Data examples which are almost all stochastic use cases. These can succeed even if there is error in the source data and uncertainty in the results since the business objective is getting trends or making general associations. In stark contrast are deterministic use cases, where the ramifications for wrong results are severely negative, such as for executive decision making, accounting, risk management, regulatory compliance, and security.

Dr. Malafsky gives Cloudera high marks (A-) for use in enterprises and what he describes as “data normalization.” Not in the relational database sense but more in the data cleaning sense.

While testing a Cloudera distribution at your next data cleaning exercise, ask yourself this question: OK, the processing worked great, but how to I avoid collecting all the information I needed for this project, again in the future?

Google News: The biggest missed opportunity in media right now

Filed under: News,Reporting — Patrick Durusau @ 8:14 pm

Google News: The biggest missed opportunity in media right now by Mathew Ingram.

From the post:

Almost every time I talk to a journalist who spends a lot of time online and the subject of Google News comes up, there is a shared sense of frustration: namely, frustration over how little the site has changed over the years since it launched, and how much more it could do if Google really wanted it to — what a powerful tool it could be. I was reminded of this again when I came across a presentation that a German designer came up with that involved a wholesale redesign and re-thinking of what Google News is and does.

I found George Kvasnikov’s presentation because of a post at the design and culture site PSFK — the original was posted on the design community Behance a couple of months ago, after what Kvasnikov said was a lot of brainstorming followed by about five weeks worth of wireframing and other mockup-related work. What he came up with isn’t perfect by any means, but it has some interesting elements — and at least it is an attempt to bring Google News kicking and screaming into the future, instead of looking like it was embalmed not long after it launched.

A number of great suggestions but the one I didn’t see was offering more information about individuals, locations or other subjects in a story. Multiple perspectives are essential but when pressed for time, I would much prefer to not search for URLs for projects and basic information about the same. Ditto for people and locations.

What I don’t know is the best method for delivery of such snippets of data. Suggestions?

Data Skepticism: Citations

Filed under: Data Analysis,Skepticism — Patrick Durusau @ 6:44 pm

There are two recent posts on citation practices that merit comparison.

The first is Citations for sale by Megan Messerly, which reads in part:

The U.S. News and World Report rankings have long been regarded as the Bible of university reputation metrics.

But when the outlet released its first global rankings in October, many were surprised. UC Berkeley, which typically hovers in the twenties in the national pecking order, shot to third in the international arena. The university also placed highly in several subjects, including first place in math.

Even more surprising, though, was that a little-known university in Saudi Arabia, King Abdulaziz University, or KAU, ranked seventh in the world in mathematics — despite the fact that it didn’t have a doctorate program in math until two years ago.

“I thought this was really bizarre,” said UC Berkeley math professor Lior Pachter. “I had never heard of this university and never heard of it in the context of mathematics.”

As he usually does when rankings are released, Pachter received a round of self-congratulatory emails from fellow faculty members. He, too, was pleased that his math department had ranked first. But he was also surprised that his school had edged out other universities with reputable math departments, such as MIT, which did not even make the top 10.

For the sake of ranking

It was enough to inspire Pachter to conduct his own review of the newly minted rankings. His inquiry revealed that KAU had aggressively recruited professors from a list of top scientists with the most frequently referenced papers, often referred to as highly cited researchers.

“The more I’ve learned, the more shocked and disgusted I’ve been,” Pachter said.

Citations are an indicator of academic clout, but they are also a crucial metric used in compiling several university rankings. There may be many reasons for hiring highly cited researchers, but rankings are one clear result of KAU’s investment. The worry, some researchers have said, is that citations and, ultimately, rankings may be KAU’s primary aim. KAU did not respond to repeated requests for comment via phone and email for this article.

On Halloween, Pachter published his findings about KAU’s so-called “highly-cited researcher program” in a post on his blog. It elicited many responses from his colleagues in the comment section, some of whom had experience working with KAU.

Pachter refers to earlier work of his own that makes claims about ranking universities highly suspect so one wonders why the bother?

I first saw this in a tweet by Lior Pachter.

In any event, you should also consider: Best Papers vs. Top Cited Papers in Computer Science (since 1996)

From the post:

The score in the bracket after each conference represents its average MAP score. MAP (Mean Average Precision) is a measure to evaluate the ranking performance. The MAP score of a conference in a year is calculated by viewing best papers of the conference in the corresponding year as the ground truth and the top cited papers as the ranking results.

Check the number out (the hyperlinks take you to the section in question):

AAAI (0.16) | ACL (0.13) | ACM MM (0.17) | ACSAC (0.27) | ALT (0.07) | APSEC (0.33) | ASIACRYPT (0.16) | CHI (0.2) | CIKM (0.19) | COMPSAC (0.6) | CONCUR (0.09) | CVPR (0.25) | CoNEXT (0.16) | DAC (0.07) | DASFAA (0.27) | DATE (0.11) | ECAI (0.0) | ECCV (0.42) | ECOOP (0.22) | EMNLP (0.14) | ESA (0.4) | EUROCRYPT (0.07) | FAST (0.18) | FOCS (0.07) | FPGA (0.59) | FSE (0.4) | HPCA (0.31) | HPDC (0.59) | ICALP (0.2) | ICCAD (0.13) | ICCV (0.07) | ICDE (0.48) | ICDM (0.13) | ICDT (0.25) | ICIP (0.0) | ICME (0.43) | ICML (0.12) | ICRA (0.16) | ICSE (0.24) | IJCAI (0.11) | INFOCOM (0.18) | IPSN (0.69) | ISMAR (0.57) | ISSTA (0.33) | KDD (0.33) | LICS (0.26) | LISA (0.07) | MOBICOM (0.09) | MobiHoc (0.02) | MobiSys (0.06) | NIPS (0.0) | NSDI (0.13) | OSDI (0.24) | PACT (0.37) | PLDI (0.3) | PODS (0.13) | RTAS (0.03) | RTSS (0.29) | S&P (0.09) | SC (0.14) | SCAM (0.5) | SDM (0.18) | SEKE (0.09) | SIGCOMM (0.1) | SIGIR (0.14) | SIGMETRICS (0.14) | SIGMOD (0.08) | SODA (0.12) | SOSP (0.41) | SOUPS (0.24) | SPAA (0.14) | STOC (0.21) | SenSys (0.4) | UIST (0.32) | USENIX ATC (0.1) | USENIX Security (0.18) | VLDB (0.18) | WSDM (0.2) | WWW (0.09) |

Universities and their professors conferred validity on the capricious ratings of U.S. News and World Report. Pachter’s own research has shown the ratings to be nearly fictional for comparison purposes. Yet at the same time, Pachter decrys what he sees as gaming of the rating system.

Crying “foul” in a game of capricious ratings, a game favors one’s own university, seems quite odd. Social practices at KAU may differ from universities in the United States but being ethnocentric about university education isn’t a good sign for university education in general.

Stellar Navigation Using Network Analysis

Filed under: Astroinformatics,Graphs,Networks — Patrick Durusau @ 3:14 pm

Stellar Navigation Using Network Analysis by Caleb Jones.

To give you an idea of where this post ends up:

From the post:

This has been the funnest and most challenging network analysis and visualization I have done to date. As I've mentioned before, I am a huge space fan. One of my early childhood fantasies was the idea of flying instantly throughout the universe exploring all the different planets, stars, nebulae, black holes, galaxies, etc. The idea of a (possibly) infinite universe with inexhaustible discoveries to be made has kept my interest and fascination my whole life. I identify with the sentiment expressed by Carl Sagan in his book Pale Blue Dot:

In the last ten thousand years, an instant in our long history, we’ve abandoned the nomadic life. For all its material advantages, the sedentary life has left us edgy, unfulfilled. The open road still softly calls like a nearly forgotten song of childhood. Your own life, or your band’s, or even your species’ might be owed to a restless few—drawn, by a craving they can hardly articulate or understand, to undiscovered lands and new worlds.

Herman Melville, in Moby Dick, spoke for wanderers in all epochs and meridians: “I am tormented with an everlasting itch for things remote. I love to sail forbidden seas…”

Maybe it’s a little early. Maybe the time is not quite yet. But those other worlds— promising untold opportunities—beckon.

Silently, they orbit the Sun, waiting.

Fair warning: If you aren’t already a space enthusiast, this project may well turn you into one!

Distance and relative location are only two (2) facts that are known for stars within eight (8) light-years. What other facts or resources would you connect to the stars in these networks?

Overlap and the Tree of Life

Filed under: Bioinformatics,Biology,XML — Patrick Durusau @ 9:43 am

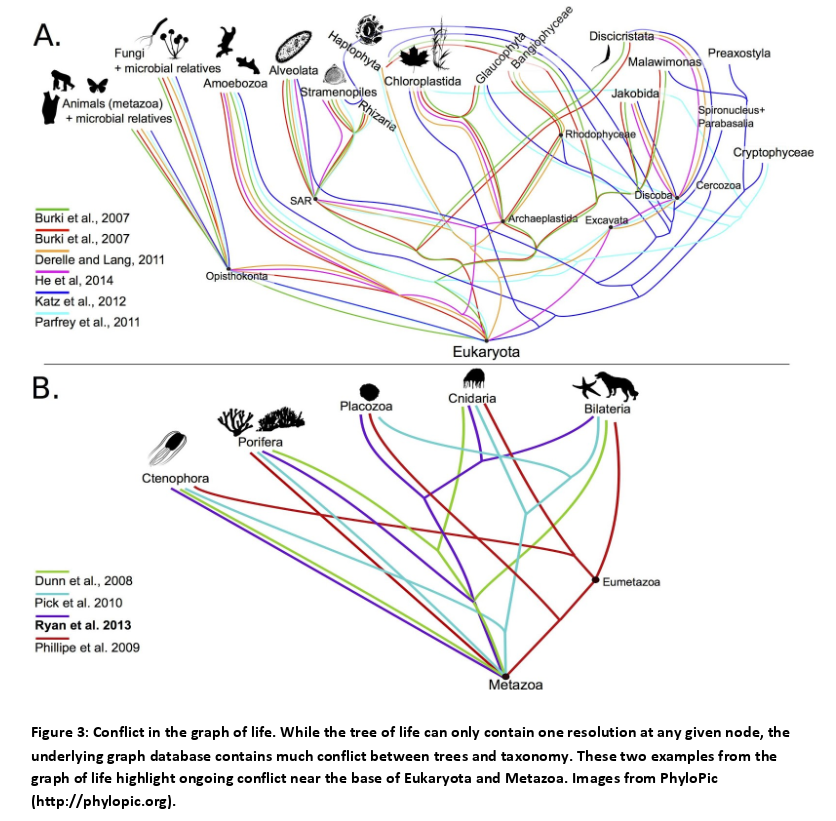
I encountered a wonderful example of “overlap” in the markup sense today while reading about resolving conflicts in constructing a comprehensive tree of life.
overlap and the tree of life

The authors use a graph database which allows them to study various hypotheses on the resolutions of conflicts.

Their graph database, opentree-treemachine, is available on GitHub, https://github.com/OpenTreeOfLife/treemachine, as is the source to all the project’s software, https://github.com/OpenTreeOfLife.

There’s a thought for Balisage 2015. Is the processing of overlapping markup a question of storing documents with overlapping markup in graph databases and then streaming the non-overlapping results of a query to an XML processor?

And visualizing overlapping results or alternative resolutions to overlapping results via a graph database.

The question of which overlapping syntax to use becoming a matter of convenience and the amount of information captured, as opposed to attempts to fashion syntax that cheats XML processors and/or developing new means for processing XML.

Perhaps graph databases can make overlapping markup in documents the default case just as overlap is the default case in documents (single tree documents being rare outliers).

Remind me to send a note to Michael Sperberg-McQueen and friends about this idea.

BTW, the details of the article that lead me down this path:

Synthesis of phylogeny and taxonomy into a comprehensive tree of life by Steven A. Smith, et al.

Abstract:

Reconstructing the phylogenetic relationships that unite all biological lineages (the tree of life) is a grand challenge of biology. However, the paucity of readily available homologous character data across disparately related lineages renders direct phylogenetic inference currently untenable. Our best recourse towards realizing the tree of life is therefore the synthesis of existing collective phylogenetic knowledge available from the wealth of published primary phylogenetic hypotheses, together with taxonomic hierarchy information for unsampled taxa. We combined phylogenetic and taxonomic data to produce a draft tree of life—the Open Tree of Life—containing 2.3 million tips. Realization of this draft tree required the assembly of two resources that should prove valuable to the community: 1) a novel comprehensive global reference taxonomy, and 2) a database of published phylogenetic trees mapped to this common taxonomy. Our open source framework facilitates community comment and contribution, enabling a continuously updatable tree when new phylogenetic and taxonomic data become digitally available. While data coverage and phylogenetic conflict across the Open Tree of Life illuminates significant gaps in both the underlying data available for phylogenetic reconstruction and the publication of trees as digital objects, the tree provides a compelling starting point from which we can continue to improve through community contributions. Having a comprehensive tree of life will fuel fundamental research on the nature of biological diversity, ultimately providing up-to-date phylogenies for downstream applications in comparative biology, ecology, conservation biology, climate change studies, agriculture, and genomics.

A project with a great deal of significance beyond my interest in overlap in markup documents. Highly recommended reading. The resolution of conflicts in trees here involves an evaluation of data, much as you would for merging in a topic map.

Unlike the authors, I see no difficulty in super trees being rich enough with the underlying data to permit direct use of trees for resolution of conflicts. But you would have to design the trees from the start with those capabilities or have topic map like merging capabilities so you are not limited by early and necessarily preliminary data design decisions.

Enjoy!

I first saw this in a tweet by Ross Mounce.

Missing From Michael Brown Grand Jury Transcripts

Filed under: Ferguson,Skepticism,Text Mining — Patrick Durusau @ 7:40 am

What’s missing from the Michael Brown grand jury transcripts? Index pages. For 22 out of 24 volumes of grand jury transcripts, the index page is missing. Here’s the list:

  • volume 1 – page 4 missing
  • volume 2 – page 4 missing
  • volume 3 – page 4 missing
  • volume 4 – page 4 missing
  • volume 5 – page 4 missing
  • volume 6 – page 4 missing
  • volume 7 – page 4 missing
  • volume 8 – page 4 missing
  • volume 9 – page 4 missing
  • volume 10 – page 4 missing
  • volume 11 – page 4 missing
  • volume 12 – page 4 missing
  • volume 13 – page 4 missing
  • volume 14 – page 4 missing
  • volume 15 – page 4 missing
  • volume 16 – page 4 missing
  • volume 17 – page 4 missing
  • volume 18 – page 4 missing
  • volume 19 – page 4 missing
  • volume 20 – page 4 missing
  • volume 21 – page 4 present
  • volume 22 – page 4 missing
  • volume 23 – page 4 missing
  • volume 24 – page 4 present

As you can see from the indexes in volumes 21 and 24, they not terribly useful but better than combing twenty-four volumes (4799 pages of text) to find where a witness testifies.

Someone (court reporter?) made a conscious decision to take action that makes the transcripts harder to user.

Perhaps this is, as they say, “chance.”

Stay tuned for posts later this week that upgrade that to “coincidence” and beyond.

December 6, 2014

Resisting Arrests: 15% of Cops Make 1/2 of Cases

Filed under: Data Analysis,Graphics,Visualization — Patrick Durusau @ 7:19 pm

Resisting Arrests: 15% of Cops Make 1/2 of Cases by WNYC

From the webpage:

Police departments around the country consider frequent charges of resisting arrest a potential red flag, as some officers might add the charge to justify use of force. WNYC analyzed NYPD records and found 51,503 cases with resisting arrest charges since 2009. Just five percent of arresting officers during that period account for 40% of resisting arrest cases — and 15% account for more than half of such cases.

Be sure to hit the “play” button on the graphic.

Statistics can be simple, direct and very effective.

First question: What has the police department done to lower those numbers for the 5% of the officers in question?

Second question: Who are the officers in the 5%?

Without transparency there is no accountability.

World Community Grid

Filed under: Distributed Computing — Patrick Durusau @ 5:39 pm

World Community Grid

From the about page:

World Community Grid enables anyone with a computer, smartphone or tablet to donate their unused computing power to advance cutting-edge scientific research on topics related to health, poverty and sustainability. Through the contributions of over 650,000 individuals and 460 organizations, World Community Grid has supported 24 research projects to date, including searches for more effective treatments for cancer, HIV/AIDS and neglected tropical diseases. Other projects are looking for low-cost water filtration systems and new materials for capturing solar energy efficiently.

How World Community Grid Works

Advancing scientific discovery

World Community Grid has enabled important scientific advances in cancer treatment and clean energy. Our research partners have published over 35 peer-reviewed papers in scientific journals and have completed the equivalent of hundreds of thousands of years of research in less than a decade. World Community Grid is the biggest volunteer computing initiative devoted to humanitarian science, and is as powerful as some of the world’s fastest supercomputers. Learn More

On the cusp of current trends

World Community Grid brings together volunteers and researchers at the intersection of computational chemistry, open science and citizen science – three trends that are transforming the way scientific research is conducted. In 2013, World Community Grid also became one of the first major volunteer computing initiatives to enable mobile computing on Android smartphones and tablets. Learn More

An award-winning program

The pioneering work done on World Community Grid has been recognized internationally with awards including the Computerworld Data+ Editors Choice Award, Business in the Community Coffey International Award, and the Asian Forum on Corporate Social Responsibility’s Asian CSR Award.

Who are we?

Started in 2004, World Community Grid is a philanthropic initiative of IBM Corporate Citizenship, the corporate social responsibility and philanthropy division of IBM. Through Corporate Citizenship, IBM donates its technology and talent to address some of the world’s most pressing social and environmental issues.

Meet Our Team

One current focus is on Ebola vaccine research.

I saw this in a tweet by IBM Research. The tweet pointed to: IBM Helps You Donate Computer Power to Fight Ebola, where the only link to IBM wasn’t a hyperlink, just text. Thought you might prefer a link to the actual site rather than prose about the site. 😉

Enjoy!

Introduction to statistical data analysis in Python.. (ATTN: Activists)

Filed under: Python,Statistics — Patrick Durusau @ 4:34 pm

Introduction to statistical data analysis in Python – frequentist and Bayesian methods by Cyrille Rossant.

Activists: I know, it really sounds more exciting than a hit from a crack pipe. Right? 😉

Seriously, consider this in light of: Activists Wield Search Data to Challenge and Change Police Policy. To cut to the chase, statistics proved that DWB stops (driving while black) resulted in searches of black men more than twice as often as white men but produced no more weapons/drugs. City of Durham changed its traffic stop policy. (I don’t know if DWB is now legal in Durham or not.)

But the point is that raw data and statistics can have an impact on a brighter than average city council. Doesn’t work every time but another tool to have at your disposal.

From the webpage:

In Chapter 7, Statistical Data Analysis, we introduce statistical methods for data analysis. In addition to covering statistical packages such as pandas, statsmodels, and PyMC, we explain the basics of the underlying mathematical principles. Therefore, this chapter will be most profitable if you have basic experience with probability theory and calculus.

The next chapter, Chapter 8, Machine Learning, is closely related; the underlying mathematics is very similar, but the goals are slightly different. While in the present chapter, we show how to gain insight into real-world data and how to make informed decisions in the presence of uncertainty, in the next chapter the goal is to learn from data, that is, to generalize and to predict outcomes from partial observations.

I first saw the Durham story in a tweet by Tim O’Reilly. The Python book was mentioned in a tweet by Scientific Python.

Tesser: Another Level of Indirection

Filed under: Clojure,MapReduce — Patrick Durusau @ 3:55 pm

Tesser: Another Level of Indirection by Kyle Kingsbury.

Slides for Kyle’s presentation at

From the presentation description:

Clojure’s sequence library and the threading macro make lazy sequence operations like map, filter, and reduce composable, and their immutable semantics allow efficient re-use of intermediate results. Core.reducers combine multiple map, filter, takes, et al into a single *fold*, taking advantage of stream fusion–and in the upcoming Clojure 1.7, transducers abstract away the underlying collection entirely.

I’ve been working on concurrent folds, where we sacrifice some order in exchange for parallelism. Tesser generalizes reducers to a two-dimensional fold: concurrent reductions over independent chunks of a sequence, and a second reduction over those values. Higher-order fold combinators allow us to build up faceted data structures which compute many properties of a dataset in a single pass. The same fold can be run efficiently on multicore systems or transparently distributed–e.g. over Hadoop.

Heavy wading but definitely worth the effort.

BTW, how do you like the hand drawn slides? I ask because I am toying with the idea of a graphics tablet for the Linux box.

Making the most detailed tweet map ever

Filed under: Mapping,Maps,Tweets — Patrick Durusau @ 2:15 pm

Making the most detailed tweet map ever by Eric Fisher.

From the post:

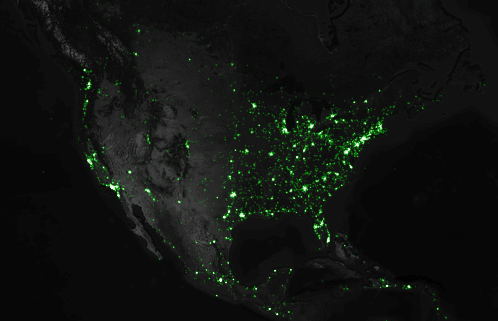
I’ve been tracking geotagged tweets from Twitter’s public API for the last three and a half years. There are about 10 million public geotagged tweets every day, which is about 120 per second, up from about 3 million a day when I first started watching. The accumulated history adds up to nearly three terabytes of compressed JSON and is growing by four gigabytes a day. And here is what those 6,341,973,478 tweets look like on a map, at any scale you want.

twitter map

[Static screenshot of a much cooler interactive map at original post.]

I’ve open sourced the tools I used to manipulate the data and did all the design work in Mapbox Studio. Here’s how you can make one like it yourself.

Eric gives a detailed account of how you can start tracking tweets on your own!

This rocks! If you use or adapt Eric’s code, be sure to give him a shout out in your code and/or documentation.

Better, Faster, and More Scalable Neo4j than ever before

Filed under: Graphs,Neo4j — Patrick Durusau @ 11:18 am

Better, Faster, and More Scalable Neo4j than ever before by Philip Rathle.

From the post:

Neo4j 2.2 aims to be our fastest and most scalable release ever. With Neo4j 2.2 our engineering team introduces massive enhancements to the internal architecture resulting in higher performance and scalability.

This first milestone (or beta release) pulls all of these new elements together, so that you can “dial it up to 11″ with your applications. You can download it here for your testing.

Philip highlights:

  1. Highly Concurrent Performance
  2. Transactional & Batch Write Performance
  3. Cypher Performance (includes a Cost-Based Optimizer)

BTW, there is news of a new and improved batch loader: neo4j-import.

I included the direct link because the search interface for the milestone release acts oddly.

If you enter (with quotes) “neo4j-import” (not an unreasonable query), results are returned for: import, neo4j. I haven’t tried other queries that include a hyphen. You?

Cultural Fault Lines Determine How New Words Spread On Twitter, Say Computational Linguists

Filed under: Computational Linguistics,Language,Linguistics — Patrick Durusau @ 9:11 am

Cultural Fault Lines Determine How New Words Spread On Twitter, Say Computational Linguists

From the post:

A dialect is a particular form of language that is limited to a specific location or population group. Linguists are fascinated by these variations because they are determined both by geography and by demographics. So studying them can produce important insights into the nature of society and how different groups within it interact.

That’s why linguists are keen to understand how new words, abbreviations and usages spread on new forms of electronic communication, such as social media platforms. It is easy to imagine that the rapid spread of neologisms could one day lead to a single unified dialect of netspeak. An interesting question is whether there is any evidence that this is actually happening.

Today, we get a fascinating insight into this problem thanks to the work of Jacob Eisenstein at the Georgia Institute of Technology in Atlanta and a few pals. These guys have measured the spread of neologisms on Twitter and say they have clear evidence that online language is not converging at all. Indeed, they say that electronic dialects are just as common as ordinary ones and seem to reflect same fault lines in society.

Disappointment for those who thought the Net would help people overcome the curse of Babel.

When we move into new languages or means of communication, we simply take our linguistic diversity with us, like well traveled but familiar luggage.

If you think about it, the difficulties of multiple semantics for OWL same:As is another instance of the same phenomena. Semantically distinct groups assigned the same token, OWL same:As different semantics. That should not have been a surprise. But it was and it will be every time on community privileges itself to be the giver of meaning for any term.

If you want to see the background for the post in full:

Diffusion of Lexical Change in Social Media by Jacob Eisenstein, Brendan O’Connor, Noah A. Smith, Eric P. Xing.

Abstract:

Computer-mediated communication is driving fundamental changes in the nature of written language. We investigate these changes by statistical analysis of a dataset comprising 107 million Twitter messages (authored by 2.7 million unique user accounts). Using a latent vector autoregressive model to aggregate across thousands of words, we identify high-level patterns in diffusion of linguistic change over the United States. Our model is robust to unpredictable changes in Twitter’s sampling rate, and provides a probabilistic characterization of the relationship of macro-scale linguistic influence to a set of demographic and geographic predictors. The results of this analysis offer support for prior arguments that focus on geographical proximity and population size. However, demographic similarity — especially with regard to race — plays an even more central role, as cities with similar racial demographics are far more likely to share linguistic influence. Rather than moving towards a single unified “netspeak” dialect, language evolution in computer-mediated communication reproduces existing fault lines in spoken American English.

The Caltech-JPL Summer School on Big Data Analytics

Filed under: BigData,CS Lectures — Patrick Durusau @ 8:04 am

The Caltech-JPL Summer School on Big Data Analytics

From the webpage:

This is not a class as it is commonly understood; it is the set of materials from a summer school offered by Caltech and JPL, in the sense used by most scientists: an intensive period of learning of some advanced topics, not on an introductory level.

The school will cover a variety of topics, with a focus on practical computing applications in research: the skills needed for a computational (“big data”) science, not computer science. The specific focus will be on applications in astrophysics, earth science (e.g., climate science) and other areas of space science, but with an emphasis on the general tools, methods, and skills that would apply across other domains as well. It is aimed at an audience of practicing researchers who already have a strong background in computation and data analysis. The lecturers include computational science and technology experts from Caltech and JPL.

Students can evaluate their own progress, but there will be no tests, exams, and no formal credit or certificates will be offered.

Syllabus:

  1. Introduction to the school. Software architectures. Introduction to Machine Learning.
  2. Best programming practices. Information retrieval.
  3. Introduction to R. Markov Chain Monte Carlo.
  4. Statistical resampling and inference.
  5. Databases.
  6. Data visualization.
  7. Clustering and classification.
  8. Decision trees and random forests.
  9. Dimensionality reduction. Closing remarks.

If this sounds challenging, imagine doing it in nine (9) days!

The real advantage of intensive courses is you are not trying to juggle work/study/eldercare and other duties while taking the course. That alone may account for some of the benefits of intensive courses, the opportunity to focus on one task and that task alone.

I first saw this in a tweet by Gregory Piatetsky.

Why my book can be downloaded for free

Filed under: Open Access,Perl,Publishing — Patrick Durusau @ 6:49 am

Why my book can be downloaded for free by Mark Dominus.

From the post:

People are frequently surprised that my book, Higher-Order Perl, is available as a free download from my web site. They ask if it spoiled my sales, or if it was hard to convince the publisher. No and no.

I sent the HOP proposal to five publishers, expecting that two or three would turn it down, and that I would pick from the remaining two or three, but somewhat to my dismay, all five offered to publish it, and I had to decide who.

One of the five publishers was Morgan Kaufmann. I had never heard of Morgan Kaufmann, but one day around 2002 I was reading the web site of Philip Greenspun. Greenspun was incredibly grouchy. He found fault with everything. But he had nothing but praise for Morgan Kaufmann. I thought that if Morgan Kaufmann had pleased Greenspun, who was nearly impossible to please, then they must be really good, so I sent them the proposal. (They eventually published the book, and did a superb job; I have never regretted choosing them.)

But not only Morgan Kaufmann but four other publishers had offered to publish the book. So I asked a number of people for advice. I happened to be in London one week and Greenspun was giving a talk there, which I went to see. After the talk I introduced myself and asked for his advice about picking the publisher.

Access to “free” electronic versions is on its way to becoming a norm, at least with some computer science publishers. Cambridge University Press, CUP, with Data Mining and Analysis: Fundamental Concepts and Algorithms and Basic Category Theory comes to mind.

Other publishers with similar policies? Yes, I know there are CS publishers who want to make free with content of others, not so much with their own. Not the same thing.

I first saw this in a tweet by Julia Evans.

December 5, 2014

How to Give a Stellar Presentation

Filed under: Marketing — Patrick Durusau @ 8:20 pm

How to Give a Stellar Presentation by Rebecca Knight.

From the post:

Speaking in front of a group — no matter how big or small — can be stressful. Preparation is key, of course, whether it’s your first or your hundredth time. From preparing your slides to wrapping up your talk, what should you do to give a presentation that people will remember?

What the Experts Say

Public speaking often tops the list of people’s fears. “When all eyes are on you, you feel exposed,” says Nick Morgan, the president and founder of Public Words and the author of Power Cues. “This classically leads to feelings of shame and embarrassment.” In other words: fear of humiliation is at the root of our performance anxiety. Another problem “is that speakers often set a standard of perfection for themselves that they will never live up to,” Morgan says. “And then depending on how neurotic they are, they’ll spend the next few hours, weeks, or years thinking: ‘I should have said this,’ or ‘I should have done that.’” But presenters shouldn’t “fear a hostile environment” or second-guess themselves says Nancy Duarte, the CEO and principal of Duarte Design, and the author of the HBR Guide to Persuasive Presentations. “Most often the audience is rooting for you,” she explains. They “want to hear what you have to say” and they want you to be successful. Here are some tips that will help you deliver.

More good advice on how to give a great presentation.

I often wonder what the ratio of material on giving good presentations is to actually bad presentations? My gut feeling is that the former outnumbers the latter, by one or more orders of magnitude.

We can all give better presentations but we don’t see ourselves presenting do we?

The best suggestion in this post is to film yourself. It can be YouTube quality filming for that matter.

Being a better presenter isn’t a guarantee of success but it is another factor in your favor!

I first saw this in a tweet by Doug Mahugh.

Databricks to run two massive online courses on Apache Spark

Filed under: BigData,Spark — Patrick Durusau @ 8:06 pm

Databricks to run two massive online courses on Apache Spark by Ameet Talwalkar and Anthony Joseph.

From the post:

In the age of ‘Big Data,’ with datasets rapidly growing in size and complexity and cloud computing becoming more pervasive, data science techniques are fast becoming core components of large-scale data processing pipelines.

Apache Spark offers analysts and engineers a powerful tool for building these pipelines, and learning to build such pipelines will soon be a lot easier. Databricks is excited to be working with professors from University of California Berkeley and University of California Los Angeles to produce two new upcoming Massive Open Online Courses (MOOCs). Both courses will be freely available on the edX MOOC platform in spring 2015. edX Verified Certificates are also available for a fee.

The first course, called Introduction to Big Data with Apache Spark, will teach students about Apache Spark and performing data analysis. Students will learn how to apply data science techniques using parallel programming in Spark to explore big (and small) data. The course will include hands-on programming exercises including Log Mining, Textual Entity Recognition, Collaborative Filtering that teach students how to manipulate data sets using parallel processing with PySpark (part of Apache Spark). The course is also designed to help prepare students for taking the Spark Certified Developer exam. The course is being taught by Anthony Joseph, a professor at UC Berkeley and technical advisor at Databricks, and will start on February 23rd, 2015.

The second course, called Scalable Machine Learning, introduces the underlying statistical and algorithmic principles required to develop scalable machine learning pipelines, and provides hands-on experience using PySpark. It presents an integrated view of data processing by highlighting the various components of these pipelines, including exploratory data analysis, feature extraction, supervised learning, and model evaluation. Students will use Spark to implement scalable algorithms for fundamental statistical models while tackling real-world problems from various domains. The course is being taught by Ameet Talwalkar, an assistant professor at UCLA and technical advisor at Databricks, and will start on April 14th, 2015.

2015 is going to be here before you know it! Time to start practicing with Spark in a sandbox or a local machine is now.

Looking forward to 2015!

Big Data Spain 2014

Filed under: BigData,Conferences — Patrick Durusau @ 7:35 pm

Big Data Spain 2014

Thirty-five videos, nineteen hours of content for a conference on November 17-18, 2014.

Very impressive content!

Since big data has started worrying about what data represents (think subject identity), I am tempted to start keeping closer track on videos for big data.

I really hate searching on a big data topic and getting the usual morass of results that date over a three to four year span, if you are lucky.

Is that a problem for you?

December 4, 2014

Hebrew Astrolabe:…

Filed under: Astroinformatics,History,Language — Patrick Durusau @ 9:16 pm

Hebrew Astrolabe: A History of the World in 100 Objects, Status Symbols (1200 – 1400 AD) by Neil MacGregor.

From the webpage:

Neil MacGregor’s world history as told through objects at the British Museum. This week he is exploring high status objects from across the world around 700 years ago. Today he has chosen an astronomical instrument that could perform multiple tasks in the medieval age, from working out the time to preparing horoscopes. It is called an astrolabe and originates from Spain at a time when Christianity, Islam and Judaism coexisted and collaborated with relative ease – indeed this instrument carries symbols recognisable to all three religions. Neil considers who it was made for and how it was used. The astrolabe’s curator, Silke Ackermann, describes the device and its markings, while the historian Sir John Elliott discusses the political and religious climate of 14th century Spain. Was it as tolerant as it seems?

The astrolabe that is the focus of this podcast is quite remarkable. The Hebrew, Arabic and Spanish words on this astrolabe are all written in Hebrew characters.

Would you say that is multilingual?

BTW, this series from the British Museum will not be available indefinitely so start listening to these podcasts soon!

December 3, 2014

Periodic Table of Elements

Filed under: Maps,Science,Visualization — Patrick Durusau @ 8:17 pm

Periodic Table of Elements

You will have to follow the link to get anything approaching the full impact of this interactive graphic.

Would be even more impressive if elements linked to locations with raw resources and current futures markets.

I first saw this in a tweet by Lauren Wolf.

PS: You could even say that each element symbol is a locus for gathering all available information about that element.

Available Now: HDP 2.2

Filed under: Hadoop,Hortonworks — Patrick Durusau @ 8:11 pm

Available Now: HDP 2.2 by Jim Walker.

From the post:

We are very pleased to announce that the Hortonworks Data Platform Version 2.2 (HDP) is now generally available for download. With thousands of enhancements across all elements of the platform spanning data access to security to governance, rolling upgrades and more, HDP 2.2 makes it even easier for our customers to incorporate HDP as a core component of Modern Data Architecture (MDA).

HDP 2.2 represents the very latest innovation from across the Hadoop ecosystem, where literally hundreds of developers have been collaborating with us to evolve each of the individual Apache Software Foundation (ASF) projects from the broader Apache Hadoop ecosystem. These projects have now been brought together into the complete and open Hortonworks Data Platform (HDP) delivering more than 100 new features and closing out thousands of issues across Apache Hadoop and its related projects.

These distinct ASF projects from across the Hadoop ecosystem span every aspect of the data platform and are easily categorized into:

  • Data management: this is the core of the platform, including Apache Hadoop and its subcomponents of HDFS and YARN, which is the architectural center of HDP.
  • Data access: this represents the broad range of options for developers to access and process data, stored in HDFS and depending on their application requirements.
  • The supporting enterprise services of governance, operations and security that are fundamental to any enterprise data platform.

How many of the 100 new features will you try by the end of December, 2014? 😉

A sandbox edition is promised by December 9, 2014.

Tis the season to be jolly!

December 2, 2014

Likenesses Within the Reach of All

Filed under: History,Museums — Patrick Durusau @ 7:59 pm

Likenesses Within the Reach of All

From the webpage:

The Southern Cartes de Visite Collection is a recently digitized group of 3,356 photographs from circa 1850 to 1900. The map below depicts the locations of the collection’s photographers, studios, and galleries between about 1850 and 1900. Users can browse the map and select locations to see information and examples of the cartes-de-visite taken there. Users can also filter the collection by photographer and zoom in to cities like Baltimore, Louisville, or New Orleans to see the individual studio addresses. By clicking on the locations, users can access an Acumen link to see the photographs and manipulate them as if they were in the archive.

Great resource for Southern history buffs who want to map between period resources that are online.

Then, like now, some people were more photogenic than others. 😉

I first saw this in a tweet by Stewart Varner.

TinkerPop 3.0.0.M6 Released — A Gremlin Rāga in 7/16 Time

Filed under: Graphs,Gremlin,TinkerPop — Patrick Durusau @ 7:34 pm

TinkerPop 3.0.0.M6 Released — A Gremlin Rāga in 7/16 Time by Marko A. Rodriguez.

From post:

Dear ladies and gentlemen of the TinkerPop,

TinkerPop productions, in association with Gremlin Studios, presents a Gremlin-Users codebase, featuring TinkerPop-Contributors…TinkerPop 3.0.0.M6. Staring, Gremlin as himself.

https://github.com/tinkerpop/tinkerpop3/blob/master/CHANGELOG.asciidoc

Documentation

AsciiDoc: http://tinkerpop.com/docs/3.0.0.M6/
JavaDoc[core]: http://tinkerpop.com/javadocs/3.0.0.M6/core/
JavaDoc[full]: http://tinkerpop.com/javadocs/3.0.0.M6/full/

Downloads

Gremlin Console: http://tinkerpop.com/downloads/3.0.0.M6/gremlin-console-3.0.0.M6.zip
Gremlin Server: http://tinkerpop.com/downloads/3.0.0.M6/gremlin-server-3.0.0.M6.zip

If you want a better sense of graphs than “Everything is a graph!” type promotionals, see: How Whitepages turned the phone book into a graph using Titan and Cassandra. BTW, the Whitepages offer an API for email verification.

Don’t be the last one to submit a bug for this milestone release!

At the same time, checkout the Whitepages API.

Nonsensical ‘Unbiased Search’ Proposal

Filed under: EU,Governance,Search Engines,Searching — Patrick Durusau @ 4:50 pm

Forget EU’s Toothless Vote To ‘Break Up’ Google; Be Worried About Nonsensical ‘Unbiased Search’ Proposal by Mike Masnick.

Mike uncovers (in plain sight) the real danger of the recent EU proposal to “break up” Google.

Reading the legislation (which I neglected to do), Mike writes:

But within the proposal, a few lines down, there was something that might be even more concerning, and more ridiculous, even if it generated fewer (actually, almost no) headlines. And it’s that, beyond “breaking up” search engines, the resolution also included this bit of nonsense, saying that search engines need to be “unbiased”:

Stresses that, when operating search engines for users, the search process and results should be unbiased in order to keep internet searches non-discriminatory, to ensure more competition and choice for users and consumers and to maintain the diversity of sources of information; notes, therefore, that indexation, evaluation, presentation and ranking by search engines must be unbiased and transparent; calls on the Commission to prevent any abuse in the marketing of interlinked services by search engine operators;

But what does that even mean? Search is inherently biased. That’s the point of search. You want the best results for what you’re searching for, and the job of the search engine is to rank results by what it thinks is the best. An “unbiased” search engine isn’t a search engine at all. It just returns stuff randomly.

See Mike’s post for additional analysis of this particular mummers farce.

Another example why the Internet should be governed by a new structure, staffed by people with the technical knowledge to make sensible decisions. By “new structure” I mean one separate from and not subject to any existing government. Including the United States, where the head of the NSA thinks local water supplies are controlled over the Internet (FALSE).

I first saw this in a tweet by Joseph Esposito.

Promoting Topic Maps (and writing)

Filed under: Marketing,Topic Maps — Patrick Durusau @ 4:11 pm

Ted Underwood posted a tweet today that seems relevant to marketing topic maps:

When Sumeria got psyched about writing, I bet they spent the first two decades mostly traveling around giving talks about writing.

I think Ted has a very good point.

You?

GiveDirectly (Transparency)

Filed under: Open Access,Open Data,Transparency — Patrick Durusau @ 3:53 pm

GiveDirectly

From the post:

Today we’re launching a new website for GiveDirectly—the first major update since www.givedirectly.org went live in 2011.

Our main goal in reimagining the site was to create radical transparency into what we do and how well we do it. We’ve invested a lot to integrate cutting-edge technology into our field model so that we have real-time data to guide internal management. Why not open up that same data to the public? All we needed were APIs to connect the website and our internal field database (which is powered by our technology partner, Segovia).

Transparency is of course a non-profit buzzword, but I usually see it used in reference to publishing quarterly or annual reports, packaged for marketing purposes—not the kind of unfiltered data and facts I want as a donor. We wanted to use our technology to take transparency to an entirely new level.

Two features of the new site that I’m most excited about:

First, you can track how we’re doing on our most important performance metrics, at the same time we do. For example, the performance chart on the home page mirrors the dashboard we use internally to track performance in the field. If recipients aren’t understanding our program, you’ll learn about it when we do. If the follow-up team falls behind or outperforms, metrics will update accordingly. We want to be honest about our successes and failures alike.

Second, you can verify our claims about performance. We don’t think you should have to trust that we’re giving you accurate information. Each “Verify this” tag downloads a csv file with the underlying raw data (anonymized). Every piece of data is generated by a GiveDirectly staff member’s work in the field and is stored using proprietary software; it’s our end-to-end model in action. Explore the data for yourself and absolutely question us on what you find.

Tis the season for soliciting donations, by every known form of media.

Suggestion: Copy and print out this response:

___________________________, I would love to donate to your worthy cause but before I do, please send a weblink to the equivalent of: http://www.givedirectly.org. Wishing you every happiness this holiday season.

___________________________

Where no response or no equivalent website = no donation.

I first saw this in a tweet by Stefano Bertolo.

Cliques are nasty but Cliques are nastier

Filed under: Humor,Language — Patrick Durusau @ 3:34 pm

Cliques are nasty but Cliques are nastier by Lance Fortnow.

A heteronym that fails to make the listing at: The Heteronym Homepage.

From the Heteronym Homepage:

Heteronyms are words that are spelled identically but have different meanings when pronounced differently.

Before you jump to Lance’s post (see the comments as well), care to guess the pronunciations and meanings of “clique?”

Enjoy!

Nature makes all articles free to view [pay-to-say]

Filed under: Open Access,Publishing — Patrick Durusau @ 11:59 am

Nature makes all articles free to view by Richard Van Noorden.

From the post:

All research papers from Nature will be made free to read in a proprietary screen-view format that can be annotated but not copied, printed or downloaded, the journal’s publisher Macmillan announced on 2 December.

The content-sharing policy, which also applies to 48 other journals in Macmillan’s Nature Publishing Group (NPG) division, including Nature Genetics, Nature Medicine and Nature Physics, marks an attempt to let scientists freely read and share articles while preserving NPG’s primary source of income — the subscription fees libraries and individuals pay to gain access to articles.

ReadCube, a software platform similar to Apple’s iTunes, will be used to host and display read-only versions of the articles’ PDFs. If the initiative becomes popular, it may also boost the prospects of the ReadCube platform, in which Macmillan has a majority investment.

Annette Thomas, chief executive of Macmillan Science and Education, says that under the policy, subscribers can share any paper they have access to through a link to a read-only version of the paper’s PDF that can be viewed through a web browser. For institutional subscribers, that means every paper dating back to the journal’s foundation in 1869, while personal subscribers get access from 1997 on.

Anyone can subsequently repost and share this link. Around 100 media outlets and blogs will also be able to share links to read-only PDFs. Although the screen-view PDF cannot be printed, it can be annotated — which the publisher says will provide a way for scientists to collaborate by sharing their comments on manuscripts. PDF articles can also be saved to a free desktop version of ReadCube, similarly to how music files can be saved in iTunes.

I am hopeful that Macmillan will discover that allowing copying and printing are no threat to its income stream. Both are means of advertising for its journal at the expense of the user who copies a portion of the text for a citation or shares a printed copy with a colleague. Advertising paid for by users should be considered as a plus.

The annotation step is a good one, although I would modify it in some respects. First I would make all articles accessible by default with annotation capabilities. Then I would grant anyone who registers say 12 comments per year for free and offer a lower-than-subscription-cost option for more than twelve comments on articles.

If there is one thing I suspect users would be willing to pay for is the right to response to others in their fields. Either to response to articles and/or to other comments. Think of it as a pay-to-say market strategy.

It could be an “additional” option to current institutional and personal subscriptions and thus an entirely new revenue stream for Macmillan.

To head off expected objections by “free speech” advocates, I note that no journal publishes every letter to the editor. The right to free speech has never included the right to be heard on someone else’s dime. Annotation of Nature is on Macmillan’s dime.

« Newer PostsOlder Posts »

Powered by WordPress