Another Word For It Patrick Durusau on Topic Maps and Semantic Diversity

December 23, 2014

Abridged List of Machine Learning Topics

Filed under: Machine Learning — Patrick Durusau @ 11:46 am

Abridged List of Machine Learning Topics

Covers:

  • Computer Vision
  • Deep Learning
  • Ensemble Methods
  • GPU Learning
  • Graphical Models
  • Graphs
  • Hadoop/Spark
  • Hyper-Parameter Optimization
  • Julia
  • Kernel Methods
  • Natural Language Processing
  • Online Learning
  • Optimization
  • Robotics
  • Structured Predictions
  • Visualization

Great resource that lists software and one or two reading references for each area. Not all you will want but a nice way to explore areas unfamiliar to you.

Bookmark and return often.

December 22, 2014

NoSQL Data Modelling (Jan Steemann)

Filed under: Data Models,NoSQL — Patrick Durusau @ 8:46 pm

From the description:

Learn about data modelling in a NoSQL environment in this half-day class.

Even though most NoSQL databases follow the “schema-free” data paradigma, what a database is really good at is determined by its underlying architecture and storage model.

It is therefore important to choose a matching data model to get the best out of the underlying database technology. Application requirements such as consistency demands also need to be considered.

During the half-day, attendees will get an overview of different data storage models available in NoSQL databases. There will also be hands-on examples and experiments using key/value, document, and graph data structures.

No prior knowledge of NoSQL databases is required. Some basic experience with relational databases (like MySQL) or data modelling will be helpful but is not essential. Participants will need to bring their own laptop (preferably Linux or MacOS). Installation instructions for the required software will be sent out prior to the class.

Great lecture on beginning data modeling for NoSQL.

What I haven’t encountered is a war story approach to data modeling. That is a book or series of lectures that iterates over data modeling problems encountered in practice, what considerations were taken into account and the solution decided upon. A continuing series of annual volumes with great indexing would make a must have series for any SQL or NoSQL DBA.

Jan mentions http://www.nosql-database.org/ as a nearly comprehensive NoSQL database information site. And it nearly is. Nearly because it currently omits Weaver (Graph Store) under graph databases. If you notice other omissions, please forward them to edlich@gmail.com. Maintaining a current list of resources is exhausting work.

Building a System in Clojure (and ClojureScript)

Filed under: Clojure,ClojureScript,Programming — Patrick Durusau @ 8:22 pm

Building a System in Clojure (and ClojureScript) by Matthias Nehlsen.

From about this book:

This book is about building a complex system in Clojure and ClojureScript. It started out as a blog series about my BirdWatch application, a side project for reasoning about a live stream of tweets coming in from the Twitter Streaming API and visualized in a web application that is written in ClojureScript.

In the book, we will follow the data and watch how it is transformed in different parts of the application until it finally triggers the user interface to change within a few hundred milliseconds after a tweet has been tweeted.

For now, I have only transferred the articles from the aforementioned series, but over the holidays I will work on adapting the content to the book format and also start working on new content.

Please sign up as a reader for free if you think you might at all be interested in the topics that will be covered. Later on, you can decide if you want to pay the suggested price or not. Of course you can also pay right away if you like, but that’s entirely up to you. In either case, you want to click the Buy Now button. Then you can select an amount between zero and infinity.

Feedback during the writing process is much appreciated. There’s a Google Group for this purpose.

Now is a great time to sign up as a reader or to purchase this book!

The non-configurable push down flow of tweets in my current Twitter client is simply intolerable. I get a day or more behind in tweets and prefer to avoid attempting to accurately scroll a day or more backwards in the feed.

Searching history plus current tweets may not do everything I want but Matthias’ book may help me tweak the interface into something more to my liking.

While you are looking at this book, check out some of the other books and publishing model at Leanpub. I don’t have any personal experience with Leanpub but it sounds like a publishing venue worth pursuing.

Spark 1.2.0 released

Filed under: GraphX,Hadoop,Spark — Patrick Durusau @ 7:26 pm

Spark 1.2.0 released

From the post:

We are happy to announce the availability of Spark 1.2.0! Spark 1.2.0 is the third release on the API-compatible 1.X line. It is Spark’s largest release ever, with contributions from 172 developers and more than 1,000 commits!

This release brings operational and performance improvements in Spark core including a new network transport subsytem designed for very large shuffles. Spark SQL introduces an API for external data sources along with Hive 13 support, dynamic partitioning, and the fixed-precision decimal type. MLlib adds a new pipeline-oriented package (spark.ml) for composing multiple algorithms. Spark Streaming adds a Python API and a write ahead log for fault tolerance. Finally, GraphX has graduated from alpha and introduces a stable API.

Visit the release notes to read about the new features, or download the release today.

It looks like Christmas came a bit early this year. 😉

Lots of goodies to try out!

Underhyped – Big Data as an Advance in the Scientific Method

Filed under: BigData,Science — Patrick Durusau @ 6:26 pm

Underhyped – Big Data as an Advance in the Scientific Method by Yanpei Chen.

From the post:

Big data is underhyped. That’s right. Underhyped. The steady drumbeat of news and press talk about big data only as a transformative technology trend. It is as if big data’s impact goes only as far as creating tremendous commercial value for a selected few vendors and their customers. This view could not be further from the truth.

Big data represents a major advance in the scientific method. Its impact will be felt long after the technology trade press turns its attention to the next wave of buzzwords.

I am fortunate to work at a leading data management vendor as a big data performance specialist. My job requires me to “make things go fast” by observing, understanding, and improving big data systems. Specifically, I am expected to assess whether the insights I find represent solid information or partial knowledge. These processes of “finding out about things”, more formally known as empirical observation, hypothesis testing, and causal analysis, lie at the heart of the scientific method.

My work gives me some perspective on an under-appreciated aspect of big data that I will share in the rest of the article.

Searching for “big data” and “philosophy of science” returns almost 80,000 “hits” today. It is a connection I have not considered and if you know of any survey papers on the literature I would appreciate a pointer.

I enjoyed reading this essay but I don’t consider tracking medical treatment results and managing residential heating costs as examples of the scientific method. Both are examples of observation and analysis that is made easier by big data techniques but they don’t involve testing any hypotheses, prediction, testing, causal analysis.

Big data techniques are useful for such cases. But the use of big data techniques for all the steps of the scientific method, observation, formulation of hypotheses, prediction, testing and casual analysis, would be far more exciting.

Any pointers to use uses?

RStatistics.Net (Beta)!

Filed under: R,Statistics — Patrick Durusau @ 4:11 pm

RStatistics.Net (Beta)!

From the webpage:

The No.1 Online Reference for all things related to R language and its applications in statistical computing.

This website is a R programming reference for beginners and advanced statisticians. Here, you will find data mining and machine learning techniques explained briefly with workable R code, which when used effectively can massively boost the predicting power of your analyses.

Who is this Website For?

  1. If you are a college student working on a project using R and you want to learn techniques to solve your problem
  2. If you are a statistician, but you don’t have prior programming experience, our plugin snippets of R Code will help you achieve several of your analysis outcomes in R
  3. If you are a programmer coming from other platform (such as python, SAS, SPSS) and you are looking to get your way around in R
  4. You have a software / DB background, and would like to expand your skills into data science and advanced analytics.
  5. You are a beginner with no stats background whatsoever, but have a critical analytical mind and have a keen interest in analytical problem solving.

Whatever your motivations, RStatistics.Net can help you achieve your goal.

Don’t Know Where To Get Started?

If you are completely new to R, the Getting-Started-Guide will walk you through the essentials of the language. The guide is structured in such a manner that the learning happens inquisitively in a direct and straightforward way. Some repetition may be needed for beginners before you get a overall feel and handle over the language. Reading and practicing the code snippets step-by-step will get you familiar and equip you to acquire higher level R modelling and algorithm-building skills.

What Will I Find Here ?

In the coming days, you will see top notch articles on techniques to learn and perform statistical analyses and problem solving in areas including but not bound to:

  1. Essential Stats
  2. Regression analysis
  3. Time Series Forecasting
  4. Cluster Analysis
  5. Machine Learning Algorithms
  6. Text Mining
  7. Social Media Analytics
  8. Classification Techniques
  9. Cool R Tips

Given the number of excellent resources on R that are online, any listing is likely to miss your favorite, I rather doubt the claim:

The No.1 Online Reference for all things related to R language and its applications in statistical computing.

for a beta site on R. 😉

Still, there is always room for one more reference site on R.

The practical exercises are “coming soon.”

This may already exist but a weekly tweet of an R problem with a data set could be handy.

Semantics of Shootings

Filed under: Semantics — Patrick Durusau @ 3:38 pm

Depending on how slow news is over the holidays, shootings will be the new hype category. Earlier today I saw a tweet by Sally Kohn that neatly summarizes the semantics of shootings in the United States (your mileage may vary in other places):


Muslim shooter = entire religion guilty

Black shooter = entire race guilty

White shooter = mentally troubled lone wolf

You should print that out and paste it to your television. To keep track of how reporters, elected officials and others react to different types of shootings. Or your own reaction.

PS: This is an example of sarcasm.

Rethinking set theory

Filed under: Identifiers,Sets — Patrick Durusau @ 3:21 pm

Rethinking set theory by Tom Leinster.

From the introduction:

Mathematicians manipulate sets with con fidence almost every day of their working lives. We do so whenever we work with sets of real or complex numbers, or with vector spaces, topological spaces, groups, or any of the many other set-based structures. These underlying set-theoretic manipulations are so automatic that we seldom give them a thought, and it is rare that we make mistakes in what we do with sets.

However, very few mathematicians could accurately quote what are often referred to as `the’ axioms of set theory. We would not dream of working with, say, Lie algebras without first learning the axioms. Yet many of us will go our whole lives without learning `the’ axioms for sets, with no harm to the accuracy of our work. This suggests that we all carry around with us, more or
less subconsciously, a reliable body of operating principles that we use when manipulating sets.

What if we were to write down some of these principles and adopt them as our axioms for sets? The message of this article is that this can be done, in a simple, practical way. We describe an
axiomatization due to F. William Lawvere [3, 4], informally summarized in Fig. 1. The axioms suffice for very nearly everything mathematicians ever do with sets. So we can, if we want, abandon the classical axioms entirely and use these instead.

Don’t try to read this after a second or third piece of pie. 😉

What captured my interest was the following:

The root of the problem is that in the frame-work of ZFC, the elements of a set are always sets too. Thus, given a set X, it always makes sense in ZFC to ask what the elements of the elements of X; are. Now, a typical set in ordinary mathematics is ℝ. But accost a mathematician at random and ask them `what are the elements of Π?’, and they will probably assume they misheard you, or ask you what you’re talking about, or else tell you that your question makes no sense. If forced to answer, they might reply that real numbers have no elements. But this too is in conflict with ZFC’s usage of `set’: if all elements of ℝ are sets, and they all have no elements, then they are all the empty set, from which it follows that all real numbers are equal. (emphasis added)

The author explores the perils of using “set” with two different meanings in ZFC and what it could mean to define “set” as it is used in practice by mathematicians.

For my part, the “…elements of a set are always sets too” resonates with the concept that all identifiers can be resolved into identifiers.

For example: firstName = Patrick.

The token firstName, despite its popularity on customs forms, is not a semantic primitive recognized by all readers. While for some processing purposes, by agents hired to delay, harass and harry tired travelers, firstName is sufficient, it can in fact be resolved into tuples that represent equivalences to firstName or provide additional information about that identifier.

For example:

name = "firstName"

alt = "given name"

alt = "forename"

alt = "Christian name"

Which slightly increases my chances of finding an equivalent, if I am not familiar with firstName. I say “slightly increases” because names of individual people are subject to a rich heritage of variation based on language, culture, custom, all of which have changed over time. The example is just a tiny number of possible alternatives possible in English.

When I say “…it can in fact be resolved…” should not be taken to require that every identifier be so resolved or that the resulting identifiers extend to some particular level of resolution. Noting that we could similarly expand forename or alt and the identifiers we find in their expansions.

The question that a topic maps designer has to answer is “what expansions of identifiers are useful for a particular set of uses?” Do the identifiers need to survive their current user? (Think legacy ETL.) Will the data need to be combined with data using other identifiers? Will queries need to be made across data sets with conflicting identifiers? Is there data that could be merged on a subject by subject basis? Is there any value in a subject by subject merging?

To echo a sentiment that I heard in Leading from the Back: Making Data Science Work at a UX-driven Business, it isn’t the fact you can merge information about a subject that’s important. It is the value-add to a customer that results from that merging that is important.

Value-add for customers before toys for IT.*

I first saw this in a tweet by onepaperperday.

*This is a tough one for me, given my interests in language and theory. But I am trying to do better.

Sony, North Korea and WMDs

Filed under: Government,Politics,Security — Patrick Durusau @ 10:38 am

The current media climate on Sony and North Korea reminds me of the alleged weapons of mass destruction in Iraq and the media’s buying into that fiction.

Consider the alleged “evidence” implicating North Korea:

  • Technical analysis of the data deletion malware used in this attack revealed links to other malware that the FBI knows North Korean actors previously developed. For example, there were similarities in specific lines of code, encryption algorithms, data deletion methods, and compromised networks.
  • The FBI also observed significant overlap between the infrastructure used in this attack and other malicious cyber activity the U.S. government has previously linked directly to North Korea. For example, the FBI discovered that several Internet protocol (IP) addresses associated with known North Korean infrastructure communicated with IP addresses that were hardcoded into the data deletion malware used in this attack.
  • Separately, the tools used in the SPE attack have similarities to a cyber attack in March of last year against South Korean banks and media outlets, which was carried out by North Korea.

Update on Sony Investigation – FBI National Press Office – December 19, 2014

“Similarities” in malware are not surprising, given the open nature of the hacking community versus the cult of secrecy of the computer security community. There should be a lesson there for the computer security community.

Assuming there was use of IP addresses associated with data deletion malware, is hardly a smoking gun to prove North Korean involvement. Is that the only use for those IP addresses? And did this use correspond with the Sony attack?

Similarity is a term that covers a lot of ground. In what way were the tools similar? How similar were these tools to tools in other attacks?

Where are these questions being asked in the mainstream press?

No where that I can see.

The press buying into the weapons of mass destruction fraud resulted in the invasion/destruction of a sovereign country, destruction of a large part of its cultural heritage, untold hardship and bloodshed among its people and other harm. The press did not lead the troops but it certainly contributed to an atmosphere what made that invasion possible.

The public is poorly served by a press that uncritically accepts uncorroborated statements from government sources. That was the case on weapons of mass destruction in Iraq. Why the repetition of that behavior on North Korea’s involvement in the hacking of Sony?


Update:

Experts Skeptical North Korea Hacked Sony: A Chorus of Cyber Experts Question the FBI’s Evidence by Ainsley O’Connell.

I’m glad to see the questioning reaction growing, but why didn’t the media report the story as uncorroborated if they didn’t want to cry “BS?” How hard is that?

Example: “The FBI made uncorroborated claims today that North Korea was responsible for the hacking of Sony. The FBI declined to release any of its alleged evidence implicating North Korea for analysis by independent experts.”

How hard is that?

Evidence first, conclusion later (maybe).

December 21, 2014

New Open XML PowerTool Cmdlet simplifies retrieval of document metrics

Filed under: Microsoft,XML — Patrick Durusau @ 8:43 pm

New Open XML PowerTool Cmdlet simplifies retrieval of document metrics by Doug Mahugh.

From the post:

It’s been a good year for Open XML developers. The release of the Open XML SDK as an open source project back in June was well-received by the community, and enabled contributions such as the makefile to automate use of the SDK on Mono and a Visual Studio project for the SDK. Project leader Eric White has worked to refine and improve the testing process, and here at MS Open Tech we’ve been working with our China team to get the word out, starting with mirroring the repo to GitCafe for ease of access in China.

Today there’s another piece of good news for Open XML developers: Eric White has added a new Get-DocxMetrics Cmdlet to the Open XML PowerTools, the latest step in a developer-focused reengineering of the PowerTools to make them even more flexible and useful to Open XML developers. As Eric explains in his blog post on the Open XML Developer site:

My latest foray is a new Cmdlet, Get-DocxMetrics, which returns a lot of useful information about a WordprocessingML document. A summary of the information it returns for a document:

  • The style hierarchy – styles can inherit from other styles, and it is helpful to know what styles are defined in a document.
  • The content control hierarchy. We can examine the hierarchy, and design an XSD schema to validate them.
  • The list of languages used in a document, such as en-US, fr-FR, and so on.
  • Whether a document contains tracked revisions, text boxes, complex fields, simple fields, altChunk content, tables, hyperlinks, legacy frames, ActiveX controls, sub documents, references to null images, embedded spreadsheets, document protection, multi-font runs, the list of numbering formats used, and more.
  • Metrics on how large the document is, including element counts, average paragraph lengths, run count, zero length text elements, ASCII character counts, complex script character counts, East Asia character counts, and the count of runs of each of the variety of characters.

Get-DocxMetrics sounds like a viable way to generate statistics on a collection of OpenXML files to determine what features of OpenXML are actually in use by an enterprise or government. That would make creation of specialized tools for such entities a far more certain proposition.

Output from such analysis would be a nice input into a topic map for purposes of mapping usage to other formats. What maps?, what misses?, etc.

Looking forward to hearing more about this tool in the new year!

The Frontier Fields Lens Models

Filed under: Astroinformatics — Patrick Durusau @ 5:25 pm

The Frontier Fields Lens Models

From the post:

Abell 2744: Overlay of magnification (red) and mass models (blue) on the full-band HST imaging (green)


Bradač et al.

CATS Team

Merten, Zitrin et al.

Sharon et al.

Williams et al.


The Frontier Fields (FF) are selected to be among the strongest lensing clusters on the sky. In order to interpret many of the properties of background lensed galaxies, reliable models of the lensing maps for each cluster are required. Preliminary models for each of the six Frontier Fields clusters have been provided by five independent groups prior to the HST Frontier Fields observing campaign in order to facilitate rapid analysis of the FF data by all members of the community. These models are based upon a common set of input data, including pre-FF archival HST imaging and a common set of lensed galaxies.

The public Frontier Fields lens models include maps of mass (kappa) and shear (gamma) from which magnifications can be derived at any redshift using the script provided. Magnification maps pre-computed at z = {1,2,4,9} are also available for download. The models cover regions constrained by strongly lensed, multiply-imaged galaxies, within the HST ACS fields of view of the cluster cores. The Merten models extend to larger areas, including the FF parallel fields, as they incorporate ground-based weak lensing data. For a description of the methodology adopted by each group, see this webpage, and the links to each map-maker below. Also see this primer on gravitational lensing.

On the off-chance that you did not get the Hubble Space Telescope observing time you wanted as a present, here are models for lensing galaxy clusters. Data is included.

Enjoy!

PS: This is a model for data and processing sharing. A marked contrast with some government agencies.

How Whitepages turned the phone book into a graph

Filed under: Graphs,Marketing — Patrick Durusau @ 4:37 pm

How Whitepages turned the phone book into a graph by Jean Villedieu.

From the post:

If you were born in the 1990’s or earlier, you are familiar with phone books. These books listed the phone numbers of the people living in a given area. When you wanted to contact someone you knew the name of, the phone book could help you find his number. Before people switched phones regularly and stopped caring about having a landline, this was important.

The “born in” line really hurt. 😉

This is a feel good story about graphs and an obvious use case. However, remember the average age of leadership training is forty-two (42) which puts them in the 1970’s. If you want to sell them on graphs, the phone book might not be a bad place to start.

Just saying.

I first saw this in a tweet by Gary Stewart.

Meet Alfreda Bikowsky,… [Torture Queen]

Filed under: Government,News,Politics — Patrick Durusau @ 4:15 pm

Meet Alfreda Bikowsky, the Senior Officer at the Center of the CIA’s Torture Scandals by Glenn Greenwald and Peter Maass.

From the post:

NBC News yesterday called her a “key apologist” for the CIA’s torture program. A follow-up New Yorker article dubbed her “The Unidentified Queen of Torture” and in part “the model for the lead character in ‘Zero Dark Thirty.’” Yet in both articles she was anonymous.

The person described by both NBC and The New Yorker is senior CIA officer Alfreda Frances Bikowsky. Multiple news outlets have reported that as the result of a long string of significant errors and malfeasance, her competence and integrity are doubted — even by some within the agency.

The Intercept is naming Bikowsky over CIA objections because of her key role in misleading Congress about the agency’s use of torture, and her active participation in the torture program (including playing a direct part in the torture of at least one innocent detainee). Moreover, Bikowsky has already been publicly identified by news organizations as the CIA officer responsible for many of these acts.

Greenwald and Maass focus on reasons why naming Alfreda Bikowsky (who has her own Wikipedia page) is a reasonable thing to do, despite requests from the CIA to do otherwise.

I’m not sure what more justification is required other than Alfreda Bikowsky is a public official who committed criminal acts (see the Senate CIA Torture Report) and who is still in office. The public has a right to be informed about criminal activity committed by those in public office.

NBC, The New Yorker, don’t believe in accountability for those involved in criminal activity in the government. How can the public make sure unnamed/unknown people are held accountable by their superiors?

NBC and The New Yorker appear to consider their relationships with the CIA to be more important than serving the public interest. That’s their call but viewers and subscribers should start making calls of their own. To the sponsors of NBC and cancelling their subscriptions to The New Yorker, in droves.

If NBC and The New Yorker were willing to conceal this information from you, what else are they hiding? And why? Don’t know, can’t say. But you can know you aren’t listening to them any more.

BTW, to assist you with communicating your displeasure:

NBC General Contact form. It may be more effective to call the sponsors of commercials. Tell them that NBC is censoring the news and you won’t buy their products if they stay with NBC.

The New Yorker: Customer Service can be reached at www.newyorker.com/customerservice or 1-800-405-8085. I agree, it is was a great zine but great zines are not tools of the CIA.

I first saw this in a tweet by the U.S. Department of Fear.

Weaver (Graph Store)

Filed under: GraphLab,Graphs,Titan — Patrick Durusau @ 3:40 pm

Weaver (Graph Store)

From the homepage:

A scalable, fast, consistent graph store

Weaver is a distributed graph store that provides horizontal scalability, high-performance, and strong consistency.

Weaver enables users to execute transactional graph updates and queries through a simple python API.

Alpha release but I did find some interesting statements in the FAQ:

Weaver is designed to store dynamic graphs. You can perform transactions on rapidly evolving graph-structured data with high throughput.

Examples of dynamic graphs?

Think online social networks, WWW, knowledge graphs, Bitcoin transaction graphs, biological interaction networks, etc. If your application manipulates graph-structured data similar to these examples, you should try Weaver out!

High throughput?

Our preliminary experiments show that Weaver achieves over 12x higher throughput than Titan on an online social network workload similar to that of Tao. In addition, Weaver also achieves 4x lower latency than GraphLab on an offline, graph traversal workload.

Alpha release has binaries for Ubuntu 14.04, the is a discussion list and the source code is on GitHub. Weaver has a native C++ binding and a Python client.

Impressive enough statements to start following the discussion group and to compile for Ubuntu 12.04 (yeah, I need to upgrade in the new year).

PS: There are only two messages in the discussion group since this is its first release. Get in on the ground floor!

$175K to Identify Plankton

Filed under: Classification,Data Science,Machine Learning — Patrick Durusau @ 10:20 am

Oregon marine researchers offer $175,000 reward for ‘big data’ solution to identifying plankton by Kelly House.

From the post:

The marine scientists at Oregon State University need to catalog tens of millions of plankton photos, and they’re willing to pay good money to anyone willing to do the job.

The university’s Hatfield Marine Science Center on Monday announced the launch of the National Data Science Bowl, a competition that comes with a $175,000 reward for the best “big data” approach to sorting through the photos.

It’s a job that, done by human hands, would take two lifetimes to finish.

Data crunchers have 90 days to complete their task. Authors of the top three algorithms will share the $175,000 purse and Hatfield will gain ownership of their algorithms.

From the competition description:

The 2014/2015 National Data Science Bowl challenges you to create an image classification algorithm to automatically classify plankton species. This challenge is not easy— there are 100 classes of plankton, the images may contain non-plankton organisms and particles, and the plankton can appear in any orientation within three-dimensional space. The winning algorithms will be used by Hatfield Marine Science Center for simpler, faster population assessment. They represent a $1 million in-kind donation by the data science community!

There is a comprehensive tutorial to get you started and weekly blog posts on the contest.

You may also see this billed as the first National Data Science Bowl.

The contest runs from December 15, 2014 until March 16, 2015.

Competing is free and even if you don’t win the big prize, you will have gained valuable experience from the tutorials and discussions during the contest.

I first saw this in a tweet by Gregory Piatetsky

December 20, 2014

Our Favorite Maps of the Year Cover Everything From Bayous to Bullet Trains

Filed under: Mapping,Maps — Patrick Durusau @ 8:48 pm

Our Favorite Maps of the Year Cover Everything From Bayous to Bullet Trains by Greg Miller (Wired MapLab)

From the post:

What makes a great map? It depends, of course, on who’s doing the judging. Teh internetz loves a map with dazzling colors and a simple message, preferably related to some pop-culture phenomenon. Professional mapmakers love a map that’s aesthetically pleasing and based on solid principles of cartographic design.

We love maps that have a story to tell, the kind of maps where the more you look the more you see. Sometimes we fall for a map mostly because of the data behind it. Sometimes, we’re not ashamed to say, we love a map just for the way it looks. Here are some of the maps we came across this year that captivated us with their brains, their beauty, and in many cases, both.

First, check out the animated map below to see a day’s worth of air traffic over the UK, then toggle the arrow at top right to see the rest of the maps in fullscreen mode.

The “arrow at top right” refers to an arrow that appears when you mouse over the map of the United States at the top of the post. An impressive collection of maps!

For an even more impressive display of air traffic:

Bear in mind that there are approximately 93,000 flights per day, zero (0) of which are troubled by terrorists. The next time your leaders decry terrorism, do remember to ask where?

Creating Tor Hidden Services With Python

Filed under: Python,Security,Tor — Patrick Durusau @ 8:28 pm

Creating Tor Hidden Services With Python by Jordan Wright.

From the post:

Tor is often used to protect the anonymity of someone who is trying to connect to a service. However, it is also possible to use Tor to protect the anonymity of a service provider via hidden services. These services, operating under the .onion TLD, allow publishers to anonymously create and host content viewable only by other Tor users.

The Tor project has instructions on how to create hidden services, but this can be a manual and arduous process if you want to setup multiple services. This post will show how we can use the fantastic stem Python library to automatically create and host a Tor hidden service.

If you are interested in the Tor network, this is a handy post to bookmark.

I was thinking about exploring the Tor network in the new year but you should be aware of a more recent post by Jordan:

What Happens if Tor Directory Authorities Are Seized?

From the post:

The Tor Project has announced that they have received threats about possible upcoming attempts to disable the Tor network through the seizure of Directory Authority (DA) servers. While we don’t know the legitimacy behind these threats, it’s worth looking at the role DA’s play in the Tor network, showing what effects their seizure could have on the Tor network.*

Nothing to panic about, yet, but if you know anyone you can urge to protect Tor, do so.

Mapazonia (Mapping the Amazon)

Filed under: Mapping,Maps — Patrick Durusau @ 7:55 pm

Mapazonia (Mapping the Amazon)

From the about page:

Mapazonia has the aim of improve the OSM data in the Amazon region, using satellite images to map roads and rivers geometry.

A detailed cartography will help many organizations that are working in the Amazon to accomplish their objectives. Together we can collaborate to look after the Amazon and its inhabitants.

The project was born as an initiative of the Latinamerican OpenStreetMap Community with the objective of go ahead with collaborative mapping of common areas and problems in the continent.

We use the Tasking Manager of the Humanitarian OpenStreetMap Team to define the areas where we are going to work. Furthermore we will organize mapathons to teach the persons how to use the tools of collaborative mapping.

Normally I am a big supporter of mapping and especially crowd-sourced mapping projects.

However, a goal of an improved mapping of the Amazon makes me wonder who benefits from such a map?

The local inhabitants have known their portions of the Amazon for centuries well enough for their purposes. So I don’t think they are going to benefit from such a map for their day to day activities.

Hmmm, hmmm, who else might benefit from such a map? I haven’t seen any discussion of that topic in the mailing list archives. There seems to be a great deal of enthusiasm for the project, which is a good thing, but little awareness of potential future uses.

Who uses maps of as of yet not well mapped places? Oil, logging, and mining companies, just to name of few of the more pernicious users of maps that come to mind.

To say that the depredations of such users will be checked by government regulations is a jest too cruel for laughter.

There is a valid reason why maps were historically considered as military secrets. One’s opponent could use them to better plan their attacks.

An accurate map of the Amazon will be putting the Amazon directly in the cross-hairs of multiple attackers, with no effective defenders in sight. The Amazon may become as polluted as some American waterways but being unmapped will delay that unhappy day.

I first saw this in a tweet by Alex Barth.

Leading from the Back: Making Data Science Work at a UX-driven Business

Filed under: Data Science,UX — Patrick Durusau @ 7:17 pm

Leading from the Back: Making Data Science Work at a UX-driven Business by John Foreman. (Microsoft Visiting Speaker Series)

The first thirty (30) minutes are easily the best ones I have spent on a video this year. (I haven’t finished the Q&A part yet.)

John is a very good speaker but in part his presentation is fascinating because it illustrates how to “sell” data analysis to customers (internal and external).

You will find that while John can do the math, he is also very adept at delivering value to his customer.

Not surprisingly, customers are less interested in bells and whistles or your semantic religion and more interested in value as they perceive it.

Catch the switch in point of view, it isn’t value from your point of view but the customer’s point of view.

You need to set aside some time to watch at least the first thirty minutes of this presentation.

BTW, John Foreman is the author of Data Smart, which he confesses is “not sexy.”

I first saw this in a tweet by Microsoft Research.

Teaching Deep Convolutional Neural Networks to Play Go

Filed under: Deep Learning,Games,Machine Learning,Monte Carlo — Patrick Durusau @ 2:38 pm

Teaching Deep Convolutional Neural Networks to Play Go by Christopher Clark and Amos Storkey.

Abstract:

Mastering the game of Go has remained a long standing challenge to the field of AI. Modern computer Go systems rely on processing millions of possible future positions to play well, but intuitively a stronger and more ‘humanlike’ way to play the game would be to rely on pattern recognition abilities rather then brute force computation. Following this sentiment, we train deep convolutional neural networks to play Go by training them to predict the moves made by expert Go players. To solve this problem we introduce a number of novel techniques, including a method of tying weights in the network to ‘hard code’ symmetries that are expect to exist in the target function, and demonstrate in an ablation study they considerably improve performance. Our final networks are able to achieve move prediction accuracies of 41.1% and 44.4% on two different Go datasets, surpassing previous state of the art on this task by significant margins. Additionally, while previous move prediction programs have not yielded strong Go playing programs, we show that the networks trained in this work acquired high levels of skill. Our convolutional neural networks can consistently defeat the well known Go program GNU Go, indicating it is state of the art among programs that do not use Monte Carlo Tree Search. It is also able to win some games against state of the art Go playing program Fuego while using a fraction of the play time. This success at playing Go indicates high level principles of the game were learned.

If you are going to pursue the study of Monte Carlo Tree Search for semantic purposes, there isn’t any reason to not enjoy yourself as well. 😉

And following the best efforts in game playing will be educational as well.

I take the efforts at playing Go by computer as well as those for chess, as indicating how far ahead humans are to AI.

Both of those two-player, complete knowledge games were mastered long ago by humans. Multi-player games with extended networds of influence and motives, not to mention incomplete information as well, seem securely reserved for human players for the foreseeable future. (I wonder if multi-player scenarios are similar to the multi-body problem in physics? Except with more influences.)

I first saw this in a tweet by Ebenezer Fogus.

Monte-Carlo Tree Search for Multi-Player Games [Semantics as Multi-Player Game]

Filed under: Games,Monte Carlo,Search Trees,Searching,Semantics — Patrick Durusau @ 2:25 pm

Monte-Carlo Tree Search for Multi-Player Games by Joseph Antonius Maria Nijssen.

From the introduction:

The topic of this thesis lies in the area of adversarial search in multi-player zero-sum domains, i.e., search in domains having players with conflicting goals. In order to focus on the issues of searching in this type of domains, we shift our attention to abstract games. These games provide a good test domain for Artificial Intelligence (AI). They offer a pure abstract competition (i.e., comparison), with an exact closed domain (i.e., well-defined rules). The games under investigation have the following two properties. (1) They are too complex to be solved with current means, and (2) the games have characteristics that can be formalized in computer programs. AI research has been quite successful in the field of two-player zero-sum games, such as chess, checkers, and Go. This has been achieved by developing two-player search techniques. However, many games do not belong to the area where these search techniques are unconditionally applicable. Multi-player games are an example of such domains. This thesis focuses on two different categories of multi-player games: (1) deterministic multi-player games with perfect information and (2) multi-player hide-and-seek games. In particular, it investigates how Monte-Carlo Tree Search can be improved for games in these two categories. This technique has achieved impressive results in computer Go, but has also shown to be beneficial in a range of other domains.

This chapter is structured as follows. First, an introduction to games and the role they play in the field of AI is provided in Section 1.1. An overview of different game properties is given in Section 1.2. Next, Section 1.3 defines the notion of multi-player games and discusses the two different categories of multi-player games that are investigated in this thesis. A brief introduction to search techniques for two-player and multi-player games is provided in Section 1.4. Subsequently, Section 1.5 defines the problem statement and four research questions. Finally, an overview of this thesis is provided in Section 1.6.

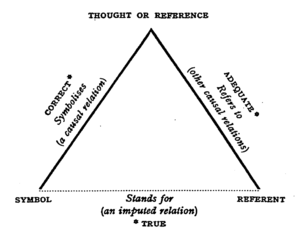
This thesis is great background reading on the use of Monte-Carol tree search in games. While reading the first chapter, I realized that assigning semantics to a token is an instance of a multi-player game with hidden information. That is the “semantic” of any token doesn’t exist in some Platonic universe but rather is the result of some N number of players who also accept a particular semantic for some given token in a particular context. And we lack knowledge of the semantic and the reasons for it that will be assigned by some N number of players, which may change over time and context.

The semiotic triangle of Ogden and Richards (The Meaning of Meaning):

300px-Ogden_semiotic_triangle

for any given symbol, represents the view of a single speaker. But as Ogden and Richards note, what is heard by listeners should be represented by multiple semiotic triangles:

Normally, whenever we hear anything said we spring spontaneously to an immediate conclusion, namely, that the speaker is referring to what we should be referring to were we speaking the words ourselves. In some cases this interpretation may be correct; this will prove to be what he has referred to. But in most discussions which attempt greater subtleties than could be handled in a gesture language this will not be so. (The Meaning of Meaning, page 15 of the 1923 edition)

Is RDF/OWL more subtle than can be handled by a gesture language? If you think so then you have discovered one of the central problems with the Semantic Web and any other universal semantic proposal.

Not that topic maps escape a similar accusation, but with topic maps you can encode additional semiotic triangles in an effort to avoid confusion, at least to the extent of funding and interest. And if you aren’t trying to avoid confusion, you can supply semiotic triangles that reach across understandings to convey additional information.

You can’t avoid confusion altogether nor can you achieve perfect communication with all listeners. But, for some defined set of confusions or listeners, you can do more than simply repeat your original statements in a louder voice.

Whether Monte-Carlo Tree searches will help deal with the multi-player nature of semantics isn’t clear but it is an alternative to repeating “…if everyone would use the same (my) system, the world would be better off…” ad nauseam.

I first saw this in a tweet by Ebenezer Fogus.

Linked Open Data Visualization Revisited: A Survey

Filed under: Linked Data,Semantic Web — Patrick Durusau @ 11:48 am

Linked Open Data Visualization Revisited: A Survey by Oscar Peña, Unai Aguilera and Diego López-de-Ipiña.

Abstract:

Mass adoption of the Semantic Web’s vision will not become a reality unless the benefits provided by data published under the Linked Open Data principles are understood by the majority of users. As technical and implementation details are far from being interesting for lay users, the ability of machines and algorithms to understand what the data is about should provide smarter summarisations of the available data. Visualization of Linked Open Data proposes itself as a perfect strategy to ease the access to information by all users, in order to save time learning what the dataset is about and without requiring knowledge on semantics.

This article collects previous studies from the Information Visualization and the Exploratory Data Analysis fields in order to apply the lessons learned to Linked Open Data visualization. Datatype analysis and visualization tasks proposed by Ben Shneiderman are also added in the research to cover different visualization features.

Finally, an evaluation of the current approaches is performed based on the dimensions previously exposed. The article ends with some conclusions extracted from the research.

I would like to see a version of this article after it has had several good editing passes. From the abstract alone, “…benefits provided by data…” and “…without requiring knowledge on semantics…” strike me as extremely problematic.

Data, accessible or not, does not provide benefits. The results of processing data may, which may explain the lack of enthusiasm when large data dumps are made web accessible. In and of itself, it is just another large dump of data. The results of processing that data may be very useful, but that is another step in the process.

I don’t think “…without requiring knowledge of semantics…” is in line with the rest of the article. I suspect the authors meant the semantics of data sets could be conveyed to users without their researching them prior to using the data set. I think that is problematic but it has the advantage of being plausible.

The various theories of visualization and datatypes (pages 3-8) don’t seem to advance the discussion and I would either drop that content or tie it into the actual visualization suites discussed. It’s educational but its relationship to the rest of the article is tenuous.

The coverage of visualization suites is encouraging and useful, but with an overall tighter focus, more time could be spent on each one and their entries being correspondingly longer.

Hopefully we will see a later, edited version of this paper as a good summary/guide to visualization tools for linked data would be a useful addition to the literature.

I first saw this in a tweet by Marin Dimitrov.

December 19, 2014

BigDataScript: a scripting language for data pipelines

Filed under: Bioinformatics,Data Pipelines — Patrick Durusau @ 8:34 pm

BigDataScript: a scripting language for data pipelines by Pablo Cingolani, Rob Sladek, and Mathieu Blanchette.

Abstract:

Motivation: The analysis of large biological datasets often requires complex processing pipelines that run for a long time on large computational infrastructures. We designed and implemented a simple script-like programming language with a clean and minimalist syntax to develop and manage pipeline execution and provide robustness to various types of software and hardware failures as well as portability.

Results: We introduce the BigDataScript (BDS) programming language for data processing pipelines, which improves abstraction from hardware resources and assists with robustness. Hardware abstraction allows BDS pipelines to run without modification on a wide range of computer architectures, from a small laptop to multi-core servers, server farms, clusters and clouds. BDS achieves robustness by incorporating the concepts of absolute serialization and lazy processing, thus allowing pipelines to recover from errors. By abstracting pipeline concepts at programming language level, BDS simplifies implementation, execution and management of complex bioinformatics pipelines, resulting in reduced development and debugging cycles as well as cleaner code.

Availability and implementation: BigDataScript is available under open-source license at http://pcingola.github.io/BigDataScript.

How would you compare this pipeline proposal to: XProc 2.0: An XML Pipeline Language?

I prefer XML solutions because I can reliably point to an element or attribute to endow it with explicit semantics.

While explicit semantics is my hobby horse, it may not be yours. Curious how you view this specialized language for bioinformatics pipelines?

I first saw this in a tweet by Pierre Lindenbaum.

Terms Defined in the W3C HTML5 Recommendation

Filed under: HTML5,W3C — Patrick Durusau @ 6:27 pm

Terms Defined in the W3C HTML5 RecommendationHTML5 Recommendation.

I won’t say this document has much of a plot or that it is an easy read. 😉

If you are using HTML5, however, this should either be a bookmark or open in your browser.

Enjoy!

I first saw this in a tweet by AdobeWebCC.

DeepSpeech: Scaling up end-to-end speech recognition [Is Deep the new Big?]

Filed under: Deep Learning,Machine Learning,Speech Recognition — Patrick Durusau @ 5:18 pm

DeepSpeech: Scaling up end-to-end speech recognition by Awni Hannun, et al.

Abstract:

We present a state-of-the-art speech recognition system developed using end-to-end deep learning. Our architecture is significantly simpler than traditional speech systems, which rely on laboriously engineered processing pipelines; these traditional systems also tend to perform poorly when used in noisy environments. In contrast, our system does not need hand-designed components to model background noise, reverberation, or speaker variation, but instead directly learns a function that is robust to such effects. We do not need a phoneme dictionary, nor even the concept of a “phoneme.” Key to our approach is a well-optimized RNN training system that uses multiple GPUs, as well as a set of novel data synthesis techniques that allow us to efficiently obtain a large amount of varied data for training. Our system, called DeepSpeech, outperforms previously published results on the widely studied Switchboard Hub5’00, achieving 16.5% error on the full test set. DeepSpeech also handles challenging noisy environments better than widely used, state-of-the-art commercial speech systems.

Although the academic papers, so far, are using “deep learning” in a meaningful sense, early 2015 is likely to see many vendors rebranding their offerings as incorporating or being based on deep learning.

When approached with any “deep learning” application or service, check out the Internet Archive WayBack Machine to see how they were marketing their software/service before “deep learning” became popular.

Is there a GPU-powered box in your future?

I first saw this in a tweet by Andrew Ng.


Update: After posting I encountered: Baidu claims deep learning breakthrough with Deep Speech by Derrick Harris. Talks to Andrew Ng, great write-up.

The top 10 Big data and analytics tutorials in 2014

Filed under: Analytics,Artificial Intelligence,BigData — Patrick Durusau @ 4:31 pm

The top 10 Big data and analytics tutorials in 2014 by Sarah Domina.

From the post:

At developerWorks, our Big data and analytics content helps you learn to leverage the tools and technologies to harness and analyze data. Let’s take a look back at the top 10 tutorials from 2014, in no particular order.

There are a couple of IBM product line specific tutorials but the majority of them you will enjoy whether you are an IBM shop or not.

Oddly enough, the post for the top ten (10) in 2014 was made on 26 September 2014.

Either Watson is far better than I have ever imagined or IBM has its own calendar.

In favor of an IBM calendar, I would point out that IBM has its own song.

A flag:

ibm-flag

IBM ranks ahead of Morocco in terms of GDP at $99.751 billion.

Does IBM have its own calendar? Hard to say for sure but I would not doubt it. 😉

Collection of CRS reports released to the public

Filed under: Government,Government Data — Patrick Durusau @ 4:07 pm

Collection of CRS reports released to the public by Kevin Kosar.

From the post:

Something rare has occurred—a collection of reports authored by the Congressional Research Service has been published and made freely available to the public. The 400-page volume, titled, “The Evolving Congress,” and was produced in conjunction with CRS’s celebration of its 100th anniversary this year. Congress, not CRS, published it. (Disclaimer: Before departing CRS in October, I helped edit a portion of the volume.)

The Congressional Research Service does not release its reports publicly. CRS posts its reports at CRS.gov, a website accessible only to Congress and its staff. The agency has a variety of reasons for this policy, not least that its statute does not assign it this duty. Congress, with ease, could change this policy. Indeed, it already makes publicly available the bill digests (or “summaries”) CRS produces at Congress.gov.

The Evolving Congress” is a remarkable collection of essays that cover a broad range of topic. Readers would be advised to start from the beginning. Walter Oleszek provides a lengthy essay on how Congress has changed over the past century. Michael Koempel then assesses how the job of Congressman has evolved (or devolved depending on one’s perspective). “Over time, both Chambers developed strategies to reduce the quantity of time given over to legislative work in order to accommodate Members’ other duties,” Koempel observes.

The NIH (National Institutes of Health) requires that NIH funded research be made available to the public. Other government agencies are following suite. Isn’t it time for the Congressional Research Service to make its publicly funded research available to the public that paid for it?

Congress needs to require it. Contact your member of Congress today. Ask for all Congressional Research Service reports, past, present and future be made available to the public.

You have already paid for the reports, why shouldn’t you be able to read them?

Senate Joins House In Publishing Legislative Information In Modern Formats [No More Sneaking?]

Filed under: Government,Government Data,Law,Law - Sources — Patrick Durusau @ 3:29 pm

Senate Joins House In Publishing Legislative Information In Modern Formats by Daniel Schuman.

From the post:

There’s big news from today’s Legislative Branch Bulk Data Task Force meeting. The United States Senate announced it would begin publishing text and summary information for Senate legislation, going back to the 113th Congress, in bulk XML. It would join the House of Representatives, which already does this. Both chambers also expect to have bill status information available online in XML format as well, but a little later on in the year.

This move goes a long way to meet the request made by a coalition of transparency organizations, which asked for legislative information be made available online, in bulk, in machine-processable formats. These changes, once implemented, will hopefully put an end to screen scraping and empower users to build impressive tools with authoritative legislative data. A meeting to spec out publication methods will be hosted by the Task Force in late January/early February.

The Senate should be commended for making the leap into the 21st century with respect to providing the American people with crucial legislative information. We will watch closely to see how this is implemented and hope to work with the Senate as it moves forward.

In addition, the Clerk of the House announced significant new information will soon be published online in machine-processable formats. This includes data on nominees, election statistics, and members (such as committee assignments, bioguide IDs, start date, preferred name, etc.) Separately, House Live has been upgraded so that all video is now in H.264 format. The Clerk’s website is also undergoing a redesign.

The Office of Law Revision Counsel, which publishes the US Code, has further upgraded its website to allow pinpoint citations for the US Code. Users can drill down to the subclause level simply by typing the information into their search engine. This is incredibly handy.

This is great news!

Law is a notoriously opaque domain and the process of creating it even more so. Getting the data is a great first step, parsing out steps in the process and their meaning is another. To say nothing of the content of the laws themselves.

Still, progress is progress and always welcome!

Perhaps citizen review will stop the Senate from sneaking changes past sleepy members of the House.

New in Cloudera Labs: SparkOnHBase

Filed under: Cloudera,HBase,Spark — Patrick Durusau @ 2:59 pm

New in Cloudera Labs: SparkOnHBase by Ted Malaska.

From the post:

Apache Spark is making a huge impact across our industry, changing the way we think about batch processing and stream processing. However, as we progressively migrate from MapReduce toward Spark, we shouldn’t have to “give up” anything. One of those capabilities we need to retain is the ability to interact with Apache HBase.

In this post, we will share the work being done in Cloudera Labs to make integrating Spark and HBase super-easy in the form of the SparkOnHBase project. (As with everything else in Cloudera Labs, SparkOnHBase is not supported and there is no timetable for possible support in the future; it’s for experimentation only.) You’ll learn common patterns of HBase integration with Spark and see Scala and Java examples for each. (It may be helpful to have the SparkOnHBase repository open as you read along.)

Is it too late to amend my wish list to include an eighty-hour week with Spark? 😉

This is an excellent opportunity to follow along with lab quality research on an important technology.

The Cloudera Labs discussion group strikes me as dreadfully under used.

Enjoy!

A non-comprehensive list of awesome things other people did in 2014

Filed under: Data Analysis,Genomics,R,Statistics — Patrick Durusau @ 1:38 pm

A non-comprehensive list of awesome things other people did in 2014 by Jeff Leek.

Thirty-eight (38) top resources from 2014! Ranging from data analysis and statistics to R and genomics and places in between.

If you missed or overlooked any of these resources during 2014, take the time to correct that error!

Thanks Jeff!

I first saw this in a tweet by Nicholas Horton.

« Newer PostsOlder Posts »

Powered by WordPress