If you have been wondering who is responsible for choosing Trump and Clinton as the presidential nominees in 2016, you will find Only 9% of America Chose Trump and Clinton as the Nominees by Alicia Parlapiano and Adam Pearce quite interesting.
Using a fixed grid on the left hand side of the page that represents 324 million Americans, 1 square = 1 million people, the article inscribes boundaries on the grid for a series of factual statements.
For example, the first statement after the grid reads:
103 million of them are children, noncitizens or ineligible felons, and they do not have the right to vote.
For that statement, the grid displays:
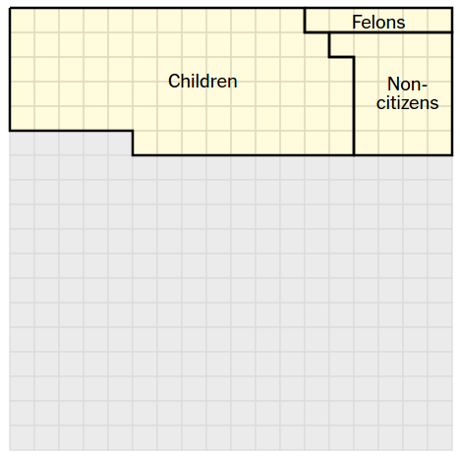
An excellent demonstration that effective visualization requires a lot of thought and not necessarily graphics that jump and buzz with every movement of the mouse.
Successive statements reduce the area of people who voted in the primaries and even further by who voted for Trump or Clinton.
Eventually you are left with the 9% who chose the current nominees.
To be safe, you need 5% of the voting population to secure the nomination. Check the voting rolls for who votes in primaries and pay them directly. Cheaper than media campaigns and has the added advantage of not annoying the rest of the electorate with your ads.
If that sounds “undemocratic,” tell me what definition of democracy you are using where 9% of the population chooses the candidates and a little more than 30% will choose the winner?