Harry Potter (Neo4j GraphGist)
From the webpage:
v0 of this graph models some of Harrys friends, enemies and their parents. Also have some pets and a few killings. The obvious relation missing is the one between Harry Potter and Voldemort- it took us 7 books to figure that one out, so you’ll have to wait till I add more data 🙂
Great start on a graph representation of Harry Potter!
But the graph model has a different perspective than Harry or others the book series had.
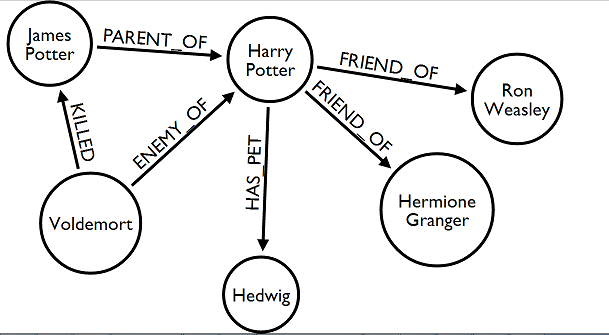
I’m a Harry Potter fan. When Harry Potter and the Philosopher’s Stone starts, Harry doesn’t know Ron Weasley, Hermione Granger, Voldemort, or Hedwig.
The graph presents the vantage point of an omniscience observer, who knows facts the rest of us waited seven (7) volumes to discover.
A useful point of view, but it doesn’t show how knowledge and events unfolded to the characters in the story.
We loose any tension over whether Harry will choose Cho Chang or Ginny Weasley
And certainly the outcomes for Albus Dumbledore and Serverus Snape lose their rich texture.
If you object that I am confusing a novel with a graph, are you saying a graph cannot represent the development of information over time?*
That’s a fairly serious shortcoming for any information representation technique.
In stock trading, for example, when I “knew” your shaving lotion causes “purple pustules spelling PIMP” to break out on an user’s face would be critically important.
Did I know before or after I unloaded my shares in your company? 😉
A silly example but illustrates that “when” we know information can be very important.
Not to mention that “static” data is only an illusion of our information systems. Or rather information systems that don’t allow for tracking changing information.
Is your information system one of those?
* I’m in the camp that thinks graphs can represent the development of information over time. Depends on your use case whether you need the extra machinery that enables time-based views.
The granularity of time requirements vary when you are talking about Harry Potter versus the Divine Comedy versus leaks from the current White House.
In topic maps, the range of validity for an association was called its “scope.” Scope and time needs more than one or two other posts.