Another Word For It Patrick Durusau on Topic Maps and Semantic Diversity

December 26, 2014

How to Get Noticed and Hired as a Data Analyst

Filed under: Data Analysis,Jobs — Patrick Durusau @ 3:53 pm

How to Get Noticed and Hired as a Data Analyst by Cheng Han Lee.

From the post:

So, you’ve learned the skills needed to become a data analyst. You can write queries to retrieve data from a database, scour through user behavior to discover rich insights, and interpret the complex results of A/B tests to make substantive product recommendations.

In short, you feel confident about embarking full steam ahead on a career as a data analyst. The next question is, how do you get noticed and actually hired by recruiters or hiring managers?

Whether you are breaking into data analytics or looking for another position, Cheng Han Lee’s advice will stand you in good stead in the coming new year!

Enjoy!

19 Amazing Sites To Get Free Stock Photos

Filed under: Graphics,UX — Patrick Durusau @ 2:51 pm

19 Amazing Sites To Get Free Stock Photos (SideJobr)

From the post:

As you are building your website photography is always an integral part of web design. If you use google image search you will find crappy or low res images of staged people on the phone or shaking hands. These photos are not only going to cheapen your site but many cost money! Stop the insanity!

As a small business owner myself, having quality photos on my site is imperative to convey professionalism and get customers. Secretly, I am just a cheap person and hate to spend more money than is necessary and trust me, it is not necessary to spend money on quality stock photos.

In this post, we’ve created a list for you of awesome websites that have free stock photos.

This is not the end all – be all of sites and if you find others, please feel free to list them in the comment section.

Note: Most of these images fall under a creative commons license (just make sure you attribute properly) or are old enough that the photos have returned to the public domain. (This happens once the copyright on an image expires.)

Reading is a recent and acquired skill when compared to image recognition, which appears to be handled by hard-wired machinery in our brains. (obvious once pointed out) The upshot of that observation (which I read, did not independently discover) is that I have been trying to use more images/graphics in my posts. This post by SideJobr is a collection of some sources for free stock photos. May be useful for your presentations, website, blog posts.

If retitled: A Hadoop Tea Party, would this image be more memorable than the usual yellow elephant in a slide presentation?

hadoop-tea-party

From New Old Stock as: Elephant’s tea party, Robur Tea Room, 24 March 1939, by Sam Hood.

Seldon

Filed under: Data Mining,Open Source,Predictive Analytics — Patrick Durusau @ 1:59 pm

Seldon wants to make life easier for data scientists, with a new open-source platform by Martin Bryant.

From the post:

It feels that these days we live our whole digital lives according mysterious algorithms that predict what we’ll want from apps and websites. A new open-source product could help those building the products we use worry less about writing those algorithms in the first place.

As increasing numbers of companies hire in-house data science teams, there’s a growing need for tools they can work with so they don’t need to build new software from scratch. That’s the gambit behind the launch of Seldon, a new open-source predictions API launching early in the new year.

Seldon is designed to make it easy to plug in the algorithms needed for predictions that can recommend content to customers, offer app personalization features and the like. Aimed primarily at media and e-commerce companies, it will be available both as a free-to-use self-hosted product and a fully hosted, cloud-based version.

If you think Inadvertent Algorithmic Cruelty is a problem, just wait until people who don’t understand the data or the algorithms start using them in prepackaged form.

Packaged predictive analytics are about as safe as arming school crossing guards with .600 Nitro Express rifles to ward off speeders. As attractive as the second suggestion sounds, there would be numerous safety concerns.

Different but no less pressing safety concerns abound with packaged predictive analytics. Being disconnected from the actual algorithms, can enterprises claim immunity for race, gender or sexual orientation based discrimination? Hard to prove “intent” when the answers in question were generated in complete ignorance of the algorithmic choices that drove the results.

At least Seldon is open source and so the algorithms can be examined, should you be interested in how results are calculated. But open source algorithms are but one aspect of the problem. What of the data? Blind application of algorithms, even neutral ones, can lead to any number of results. If you let me supply the data, I can give you a guarantee of the results from any known algorithm. “Untouched by human hands” as they say.

When you are given recommendations based on predictive analytics do you ask for the data and/or algorithms? Who in your enterprise can do due diligence to verify the results? Who is on the line for bad decisions based on poor predictive analytics?

I first saw this in a tweet by Gregory Piatetsky.

December 25, 2014

Turf: GIS for web maps

Filed under: GIS,MapBox,Mapping,Maps — Patrick Durusau @ 8:51 pm

Turf: GIS for web maps by Morgan Herlocker.

From the post:

Turf is GIS for web maps. It’s a fast, compact, and open-source JavaScript library that implements the most common geospatial operations: buffering, contouring, triangular irregular networks (TINs), and more. Turf speaks GeoJSON natively, easily connects to Leaflet, and is now available as a Mapbox.js plugin on our cloud platform. We’re also working to integrate Turf into our offline products and next-generation map rendering tools.

newyork-pop-lines

(Population data from the US Census transformed in read-time into population isolines with turf-isoline.)

The image in the original post is interactive. Plus there are several other remarkable examples.

Turf is part of a new geospatial infrastructure. Unlike the ArcGIS API for JavaScript, Turf can run completely client-side for all operations, so web apps can work offline and sensitive information can be kept local. We’re constantly refining Turf’s performance. Recent research algorithms can make operations like clipping and buffering faster than ever, and as JavaScript engines like V8 continue to optimize, Turf will compete with native code.

Can you imagine how “Steal This Book” would have been different if Abbie Hoffman had access to technology such as this?

Would you like to try? 😉

Cloudera Live (Update)

Filed under: Cloudera,Hadoop — Patrick Durusau @ 8:33 pm

Cloudera Live (Update)

I thought I had updated: Cloudera Live (beta) but apparently not!

Let me correct that today:

Cloudera Live is the fastest and easiest way to get started with Apache Hadoop and it now includes self­-guided, interactive demos and tutorials. With a one-­button deployment option, you can spin up a four-­node cluster of CDH, Cloudera’s open source Hadoop platform, within minutes. This free, cloud­-based Hadoop environment lets you:

  • Learn the basics of Hadoop (and CDH) through pre-­loaded, hands-­on tutorials
  • Plan your Hadoop project using your own datasets
  • Explore the latest features in CDH
  • Extend the capabilities of Hadoop and CDH through familiar partner tools, including Tableau and Zoomdata

Caution: The free trial is for fourteen (14) days only. To prevent billing to your account, you must delete the four machine cluster that you create.

I understand the need for a time limit but fourteen (14) days seems rather short to me, considering the number of options in the Hadoop ecosystem.

There is a read-only CDH option which is limited to three hour sessions.

Enjoy!

Inadvertent Algorithmic Cruelty

Filed under: Algorithms,Design — Patrick Durusau @ 8:11 pm

Inadvertent Algorithmic Cruelty by Eric A. Meyers.

From the post:

I didn’t go looking for grief this afternoon, but it found me anyway, and I have designers and programmers to thank for it. In this case, the designers and programmers are somewhere at Facebook.

I know they’re probably pretty proud of the work that went into the “Year in Review” app they designed and developed. Knowing what kind of year I’d had, though, I avoided making one of my own. I kept seeing them pop up in my feed, created by others, almost all of them with the default caption, “It’s been a great year! Thanks for being a part of it.” Which was, by itself, jarring enough, the idea that any year I was part of could be described as great.

Suffice it to say that Eric suffered a tragic loss this year and the algorithms behind “See Your Year” didn’t take that into account.

While I think Eric is right in saying users should have the ability to opt out of “See Your Year,” I am less confident about his broader suggestion:

If I could fix one thing about our industry, just one thing, it would be that: to increase awareness of and consideration for the failure modes, the edge cases, the worst-case scenarios. And so I will try.

That might be helpful but uncovering edge cases or worst-case scenarios takes time and resources, to say nothing of accommodating them. Once an edge case comes up, then it can be accommodated as I am sure Facebook will do next year with “See Your Year.” But it has to happen first and become noticed.

Keep Eric’s point that algorithms being “thoughtless” in mind when using machine learning techniques. Algorithms aren’t confirming your classification, they are confirming the conditions they have been taught to recognize are present. Not the same thing. Recalling that deep learning algorithms can be fooled into recognizing noise as objects..

Merry Christmas From the NSA! Missing Files

Filed under: Government,NSA — Patrick Durusau @ 4:25 pm

U.S. Spy Agency Reports Improper Surveillance of Americans by David Lerman.

From the post:

The National Security Agency today released reports on intelligence collection that may have violated the law or U.S. policy over more than a decade, including unauthorized surveillance of Americans’ overseas communications.

The NSA, responding to a Freedom of Information Act lawsuit from the American Civil Liberties Union, released a series of required quarterly and annual reports to the President’s Intelligence Oversight Board that cover the period from the fourth quarter of 2001 to the second quarter of 2013.

The heavily-redacted reports include examples of data on Americans being e-mailed to unauthorized recipients, stored in unsecured computers and retained after it was supposed to be destroyed, according to the documents. They were posted on the NSA’s website at around 1:30 p.m. on Christmas Eve.

I was downloading the NSA reports so I could package them up on my website and GitHub, so you would not have to leave traffic on the NSA web logs when I discovered that the second quarter reports for every year are missing.

Oh, they show up in the index but the PDF files for the first and second quarters of each year have the same name.

  • /public_info/_files/IOB/FY2013_1Q_IOB_Report.pdf 1Q FY13
  • /public_info/_files/IOB/FY2013_1Q_IOB_Report.pdf 2Q FY13
  • /public_info/_files/IOB/FY2012_1Q_IOB_Report.pdf 1Q FY12
  • /public_info/_files/IOB/FY2012_1Q_IOB_Report.pdf 2Q FY12
  • /public_info/_files/IOB/FY2011_1Q_IOB_Report.pdf 1Q FY11
  • /public_info/_files/IOB/FY2011_1Q_IOB_Report.pdf 2Q FY11
  • /public_info/_files/IOB/FY2010_1Q_IOB_Report.pdf 1Q FY10
  • /public_info/_files/IOB/FY2010_1Q_IOB_Report.pdf 2Q FY10
  • /public_info/_files/IOB/FY2009_1Q_IOB_Report.pdf 1Q FY09
  • /public_info/_files/IOB/FY2009_1Q_IOB_Report.pdf 2Q FY09
  • /public_info/_files/IOB/FY2008_1Q_IOB_Report.pdf 1Q FY08
  • /public_info/_files/IOB/FY2008_1Q_IOB_Report.pdf 2Q FY08
  • /public_info/_files/IOB/FY2007_1Q_IOB_Report.pdf 1Q FY07
  • /public_info/_files/IOB/FY2007_1Q_IOB_Report.pdf 2Q FY07
  • /public_info/_files/IOB/FY2006_1Q_IOB_Report.pdf 1Q FY06
  • /public_info/_files/IOB/FY2006_1Q_IOB_Report.pdf 2Q FY06
  • /public_info/_files/IOB/FY2005_1Q_IOB_Report.pdf 1Q FY05
  • /public_info/_files/IOB/FY2005_1Q_IOB_Report.pdf 2Q FY05
  • /public_info/_files/IOB/FY2004_1Q_IOB_Report.pdf 1Q FY04
  • /public_info/_files/IOB/FY2004_1Q_IOB_Report.pdf 2Q FY04
  • /public_info/_files/IOB/FY2003_1Q_IOB_Report.pdf 1Q FY03
  • /public_info/_files/IOB/FY2003_1Q_IOB_Report.pdf 2Q FY03
  • /public_info/_files/IOB/FY2002_1Q_IOB_Report.pdf 1Q FY02
  • /public_info/_files/IOB/FY2002_1Q_IOB_Report.pdf 2Q FY02

I have personally verified that the files listed above, for each year are in fact duplicates of each other. This was no simple naming mistake.

This will, of course, make automatic downloading scripts overwrite files while maintaining the correct number of files were downloaded.

BTW, the files for 3rd quarter of 2010, 3rd and 4th quarters of 2009, and the 2nd, 3rd and 4th quarters of 2001 are missing as well.

Courts should take judicial notice of the routine pettiness of the NSA when fashioning remedies for failures to disclose. That will leave the NSA no one but themselves to blame for increasingly burdensome disclosures.

I first saw the NSA story in a tweet by Veli-Pekka Kivimäki.


Update: The missing files have been uploaded by the NSA. The last edited date for the files remains unchanged from 23 December 2014.

The next time I notice an error like this, I will capture an image file, digitally sign it and post it to a third party site.

Tomorrow I will grab a copy of the latest version of the files and tar them up so you won’t have to be recorded on the NSA web logs.

Announcing Spark Packages

Filed under: Spark — Patrick Durusau @ 3:06 pm

Announcing Spark Packages by Xiangrui Meng and Patrick Wendell.

From the post:

Today, we are happy to announce Spark Packages (http://spark-packages.org), a community package index to track the growing number of open source packages and libraries that work with Apache Spark. Spark Packages makes it easy for users to find, discuss, rate, and install packages for any version of Spark, and makes it easy for developers to contribute packages.

Spark Packages will feature integrations with various data sources, management tools, higher level domain-specific libraries, machine learning algorithms, code samples, and other Spark content. Thanks to the package authors, the initial listing of packages includes scientific computing libraries, a job execution server, a connector for importing Avro data, tools for launching Spark on Google Compute Engine, and many others. We expect this list to grow substantially in 2015, and to help fuel this growth we’re continuing to invest in extension points to Spark such as the Spark SQL data sources API, the Spark streaming Receiver API, and the Spark ML pipeline API. Package authors who submit a listing retain full rights to your code, including your choice of open-source license.

Please give Spark Packages a try and let us know if you have any questions when working with the site! We expect to extend the site in the coming months while also building mechanisms in Spark to make using packages even easier. We hope Spark Packages lets you find even more great ways to work with Spark.

I hope this site catches on across the growning Spark community. If used, it has the potential to be a real time saver for anyone interested in Spark.

Looking forward to seeing this site grown over 2015.

I first saw this in a tweet by Christophe Lallanne.

Christmas Day: 1833

Filed under: History,Science,Skepticism — Patrick Durusau @ 2:31 pm

Charles Darwin’s voyage on Beagle unfolds online in works by ship’s artist by Maev Kennedy.

darwin-slinging-the-monkey

Slinging the monkey, Port Desire sketch by Conrad Martens on Christmas Day 1833 from Sketchbook III Photograph: Cambridge University Library

From the post:

On Christmas Day 1833, Charles Darwin and the crew of HMS Beagle were larking about at Port Desire in Patagonia, under the keen gaze of the ship’s artist, Conrad Martens.

The crew were mostly young men – Darwin himself, a recent graduate from Cambridge University, was only 22 – and had been given shore leave. Martens recorded them playing a naval game called Slinging the Monkey, which looks much more fun for the observers than the main participant. It involved a man being tied by his feet from a frame, swung about and jeered by his shipmates, until he manages to hit one of them with a stick, whereupon they change places.

Alison Pearn, of the Darwin Correspondence Project – which is seeking to assemble every surviving letter from and to the naturalist into a digital archive – said the drawings vividly brought to life one of the most famous voyages in the world. “It’s wonderful that everyone has the chance now to flick through these sketch books, in their virtual representation at the Cambridge digital library, and to follow the journey as Martens and Darwin actually saw it unfold.”

It would be a further 26 years before Darwin published his theory of evolution, On the Origin of Species by Means of Natural Selection, based partly on wildlife observations he made on board the Beagle. The voyage, and many of the people he met and the places he saw can be traced in scores of tiny lightning sketches made in pencil and watercolour by Martens – although unfortunately he joined the ship too late to record the weeping and hungover sailors in their chains – which have been placed online by Cambridge University library.

Anyone playing “slinging the monkey” at your house today?

If captured today, there would be megabytes if not gigabytes of cellphone video. But cellphone video would lack the perspective of the artist that captured a much broader scene than simply the game itself.

Video would give us greater detail about the game but at the loss of the larger context. What does that say about how to interpret body camera video? Does video capture “…what really happened?”

I first saw this in a tweet by the IHR, U. of London.

Cartographer: Interactive Maps for Data Exploration

Filed under: Cartography,D3,Mapping,Maps,R — Patrick Durusau @ 11:45 am

Cartographer: Interactive Maps for Data Exploration by Lincoln Mullen.

From the webpage:

Cartographer provides interactive maps in R Markdown documents or at the R console. These maps are suitable for data exploration. This package is an R wrapper around Elijah Meeks’s d3-carto-map and d3.js, using htmlwidgets for R.

Cartographer is under very early development.

Data visualization enthusiasts should consider the screen shot used to illustrate use of the software.

What geographic assumptions are “cooked” in that display? Or are they?

Screenshot makes me think data “exploration” is quite misleading. As though data contains insights that are simply awaiting our arrival. On the contrary, we manipulate data until we create one or more patterns of interest to us.

Patterns of non-interest to us are called noise, gibberish, etc. That is to say there are no meaningful patterns aside from us choosing patterns as meaningful.

If data “exploration” is iffy, then so are data “mining” and data “visualization.” All three imply there is something inherent in the data to be found, mined or visualized. But, apart from us, those “somethings” are never manifest and two different people can find different “somethings” in the same data.

The different “somethings” implies to me that users of data play a creative role in finding, mining or visualizing data. A role that adds something to the data that wasn’t present before. I don’t know of a phrase that captures the creative interaction between a person and data. Do you?

In this particular case, the “cooked” in data isn’t quite that subtle. When I say “United States,” I don’t make a habit of including parts of Canada and a large portion of Mexico in that idea.

Map displays often have adjacent countries displayed for context but in this mapping, data values are assigned to points outside of the United State proper. Were the data values constructed on a different geographic basis than the designation of “United States?”

December 24, 2014

Apache Ranger Audit Framework

Filed under: Apache Ranger,Hadoop,Hortonworks — Patrick Durusau @ 8:27 pm

Apache Ranger Audit Framework by Madhan Neethiraj.

From the post:

Apache Ranger provides centralized security for the Enterprise Hadoop ecosystem, including fine-grained access control and centralized audit mechanism, all essential for Enterprise Hadoop. This blog covers various details of Apache Ranger’s audit framework options available with Apache Ranger Release 0.4.0 in HDP 2.2 and how they can be configured.

From the Ranger homepage:

Apache Ranger offers a centralized security framework to manage fine-grained access control over Hadoop data access components like Apache Hive and Apache HBase. Using the Apache Ranger console, security administrators can easily manage policies for access to files, folders, databases, tables, or column. These policies can be set for individual users or groups and then enforced within Hadoop.

Security administrators can also use Apache Ranger to manage audit tracking and policy analytics for deeper control of the environment. The solution also provides an option to delegate administration of certain data to other group owners, with the aim of securely decentralizing data ownership.

Apache Ranger currently supports authorization, auditing and security administration of following HDP components:

And you are going to document the semantics of the settings, events and other log information….where?

Oh, aha, you know what those settings, events and other log information mean and…, not planning on getting hit by a bus are we? Or planning to stay in your present position forever?

No joke. I know someone training their replacements in ten year old markup technologies. Systems built on top of other systems. And they kept records. Lots of records.

Test your logs on a visiting Hadoop systems administrator. If they don’t get 100% correct on your logging, using whatever documentation you have, you had better start writing.

I hadn’t thought about the visiting Hadoop systems administrator idea before but that would be a great way to test the documentation for Hadoop ecosystems. Better to test it that way instead of after a natural or unnatural disaster.

Call it the Hadoop Ecosystem Documentation Audit. Give a tester tasks to perform, which must be accomplished with existing documentation. No verbal assistance. I suspect a standard set of tasks could be useful in defining such a process.

Cloudera Enterprise 5.3 is Released

Filed under: Cloudera — Patrick Durusau @ 7:49 pm

Cloudera Enterprise 5.3 is Released by Justin Kestelyn.

From the post:

We’re pleased to announce the release of Cloudera Enterprise 5.3 (comprising CDH 5.3, Cloudera Manager 5.3, and Cloudera Navigator 2.2).

This release continues the drumbeat for security functionality in particular, with HDFS encryption (jointly developed with Intel under Project Rhino) now recommended for production use. This feature alone should justify upgrades for security-minded users (and an improved CDH upgrade wizard makes that process easier).

Here are some of the highlights (incomplete; see the respective Release Notes for CDH, Cloudera Manager, and Cloudera Navigator for full lists of features and fixes):

You are unlikely to see this until after the holidays but do pay attention to the security aspects of this release. Ask yourself, “Does my employer want to be the next Sony?” Then upgrade your current installation.

Other goodies are included so it isn’t just an upgrade for security reasons.

Enjoy!

historydata: Data Sets for Historians

Filed under: History,R — Patrick Durusau @ 7:42 pm

historydata: Data Sets for Historians

From the webpage:

These sample data sets are intended for historians learning R. They include population, institutional, religious, military, and prosopographical data suitable for mapping, quantitative analysis, and network analysis.

If you forgot the historian on your shopping list, you have been saved from embarrassment. Assuming they are learning R.

At least it will indicate you think they are capable of learning R.

If you want a technology or methodology to catch on, starter data sets are one way to increase the comfort level of new users. Which can have the effect of turning them into consistent users.

Akka – Streams and HTTP

Filed under: Actor-Based,Akka,Streams — Patrick Durusau @ 7:29 pm

New documentation for Akka Streams and HTTP.

From Akka Streams:

The way we consume services from the internet today includes many instances of streaming data, both downloading from a service as well as uploading to it or peer-to-peer data transfers. Regarding data as a stream of elements instead of in its entirety is very useful because it matches the way computers send and receive them (for example via TCP), but it is often also a necessity because data sets frequently become too large to be handled as a whole. We spread computations or analyses over large clusters and call it “big data”, where the whole principle of processing them is by feeding those data sequentially—as a stream—through some CPUs.

Actors can be seen as dealing with streams as well: they send and receive series of messages in order to transfer knowledge (or data) from one place to another. We have found it tedious and error-prone to implement all the proper measures in order to achieve stable streaming between actors, since in addition to sending and receiving we also need to take care to not overflow any buffers or mailboxes in the process. Another pitfall is that Actor messages can be lost and must be retransmitted in that case lest the stream have holes on the receiving side. When dealing with streams of elements of a fixed given type, Actors also do not currently offer good static guarantees that no wiring errors are made: type-safety could be improved in this case.

For these reasons we decided to bundle up a solution to these problems as an Akka Streams API. The purpose is to offer an intuitive and safe way to formulate stream processing setups such that we can then execute them efficiently and with bounded resource usage—no more OutOfMemoryErrors. In order to achieve this our streams need to be able to limit the buffering that they employ, they need to be able to slow down producers if the consumers cannot keep up. This feature is called back-pressure and is at the core of the Reactive Streams initiative of which Akka is a founding member. For you this means that the hard problem of propagating and reacting to back-pressure has been incorporated in the design of Akka Streams already, so you have one less thing to worry about; it also means that Akka Streams interoperate seamlessly with all other Reactive Streams implementations (where Reactive Streams interfaces define the interoperability SPI while implementations like Akka Streams offer a nice user API).

From HTTP:

The purpose of the Akka HTTP layer is to expose Actors to the web via HTTP and to enable them to consume HTTP services as a client. It is not an HTTP framework, it is an Actor-based toolkit for interacting with web services and clients….

Just in case you tire of playing with your NVIDIA GRID K2 board and want to learn more about Akka streams and HTTP. 😉

Holiday Gift: Open-Source C++ SDK & GraphLab Create 1.2

Filed under: C/C++,GraphLab,Graphs — Patrick Durusau @ 5:58 pm

Holiday Gift: Open-Source C++ SDK & GraphLab Create 1.2 by Rajat Arya.

From the post:

Just when you were wondering how to keep from getting bored this holiday season, we’re delivering something to fuel your creativity and sharpen your C++ coding skills. With the release of GraphLab Create 1.x SDK (beta) you can now harness and extend the C++ engine that powers GraphLab Create.

Extensions built with the SDK can directly access the SFrame and SGraph data structures from within the C++ engine. Direct access enables you to build custom algorithms, toolkits, and lambdas in efficient native code. The SDK provides a lightweight path to create and compile custom functions and expose them through Python.

One of the great things about the Internet is that as soon as you wonder something like “…how am I going to keep from being bored…” a post like this one appears in your Twitter stream. Well, at least if you are a follower of @graphlabteam. (A good reason to be following @graphlabteam.)

Watching the explosive growth of progress on graphs and graph processing over the past couple of years makes me suspect that the security side of the house is doing something wrong. Not sure what but it isn’t making this sort of progress.

Enjoy the SDK!

Mean While, In Sony Land

Filed under: Humor — Patrick Durusau @ 4:50 pm

While you have been working hard to get a few hours off with family or other loved ones for the holidays, Sony, the only resident of Sony Land, has been burning cash by the sackful.

Matthew Ingram writes in: Why Sony is way out on a limb with legal threats against Twitter:

The ripple effects of the Sony Pictures Entertainment hack continue to spread, and one of the latest — and also arguably the least plausible — is Sony’s attempt to threaten Twitter with legal action if it doesn’t remove tweets that contain content from the company’s hacked emails. Sony may have hired superstar attorney David Boies, who led the Justice Department’s antitrust case against Microsoft in the 1990s, but the consensus in the legal community is that the company’s blustering is all sound and fury, signifying little.

The full extent of Sony’s claims can be read in the letter that Boies sent the company, but in a nutshell the movie studio is asking Twitter to suspend the account of anyone who posts information from the hacked emails, and it specifically mentions the account @bikinirobotarmy — which belongs to rock singer Val Broeksmit, who has a band of the same name — which has been publishing screenshots of some of the emails (with addresses redacted).

Doing due diligence, I found http://www.bikinirobotarmy.com/, where going down the rabbit hole you will find, among other things, Let Those Fuckers’ Roll.

Sony Land is characterized by non-accountable network sysadmins and their corporate overlords, who are also non-accountable. Oh, and poor security practices they seek to obscure by wild accusations about possible hackers.

If you work in Sony Land, you may need to prepare to explain a gap in your CV when you conceal that fact when seeing new employment. Coma works pretty well. Unfortunate motorcycle accident but a full recovery, complete with recent certifications. Yes?

How Language Shapes Thought:…

Filed under: Language,Psychology — Patrick Durusau @ 3:18 pm

How Language Shapes Thought: The languages we speak affect our perceptions of the world by Lera Boroditsky.

From the article:

I am standing next to a five-year old girl in pormpuraaw, a small Aboriginal community on the western edge of Cape York in northern Australia. When I ask her to point north, she points precisely and without hesitation. My compass says she is right. Later, back in a lecture hall at Stanford University, I make the same request of an audience of distinguished scholars—winners of science medals and genius prizes. Some of them have come to this very room to hear lectures for more than 40 years. I ask them to close their eyes (so they don’t cheat) and point north. Many refuse; they do not know the answer. Those who do point take a while to think about it and then aim in all possible directions. I have repeated this exercise at Harvard and Princeton and in Moscow, London and Beijing, always with the same results.

A five-year-old in one culture can do something with ease that eminent scientists in other cultures struggle with. This is a big difference in cognitive ability. What could explain it? The surprising answer, it turns out, may be language.

Michael Nielson mentioned this article in a tweet about a new book due out from Lera in the Fall of 2015.

Looking further I found: 7,000 Universes: How the Language We Speak Shapes the Way We Think [Kindle Edition] by Lera Boroditsky. (September, 2015, available for pre-order now)

As Michael says, looking forward to seeing this book! Sounds like a good title to forward to Steve Newcomb. Steve would argue, correctly I might add, any natural language may contain an infinite number of possible universes of discourse.

I assume some of this issue will be caught by your testing topic map UIs with actual users in whatever subject domain and language you are offering information. That is rather than consider the influence of language in the abstract, you will be silently taking it into account in user feedback. You are testing your topic map deliverables with live users before delivery. Yes?

There are other papers by Lera available for your leisure reading.

Cassandra Summit Europe 2014 (December 3-4, 2014) Videos!

Filed under: Cassandra,Conferences — Patrick Durusau @ 2:46 pm

Cassandra Summit Europe 2014 (December 3-4, 2014) Videos!

As usual, I sorted the presentations by the first author’s last name.

Good thing too because I noticed that Ben Laplanche was attributed with two presentations that differed only in having “Apache” in one title and not in the other.

On inspection I discovered an incorrectly labeled presentation by David Borsos and Tareq Abedrabbo, of OpenCredo. I corrected the listing but retained the current URL.

I am curious why the original webpage offers filtering by company? That’s an unlikely category for a developer to use in searching for Cassandra related content.

Consider annotating future presentations with the versions of software covered. It would make searching presentations much more robust.

Enjoy!

DL4J: Deep Learning for Java

Filed under: Deep Learning,Machine Learning,Neural Networks — Patrick Durusau @ 9:26 am

DL4J: Deep Learning for Java

From the webpage:

Deeplearning4j is the first commercial-grade, open-source deep-learning library written in Java. It is meant to be used in business environments, rather than as a research tool for extensive data exploration. Deeplearning4j is most helpful in solving distinct problems, like identifying faces, voices, spam or e-commerce fraud.

Deeplearning4j integrates with GPUs and includes a versatile n-dimensional array class. DL4J aims to be cutting-edge plug and play, more convention than configuration. By following its conventions, you get an infinitely scalable deep-learning architecture suitable for Hadoop and other big-data structures. This Java deep-learning library has a domain-specific language for neural networks that serves to turn their multiple knobs.

Deeplearning4j includes a distributed deep-learning framework and a normal deep-learning framework (i.e. it runs on a single thread as well). Training takes place in the cluster, which means it can process massive amounts of data. Nets are trained in parallel via iterative reduce, and they are equally compatible with Java, Scala and Clojure, since they’re written for the JVM.

This open-source, distributed deep-learning framework is made for data input and neural net training at scale, and its output should be highly accurate predictive models.

By following the links at the bottom of each page, you will learn to set up, and train with sample data, several types of deep-learning networks. These include single- and multithread networks, Restricted Boltzmann machines, deep-belief networks, Deep Autoencoders, Recursive Neural Tensor Networks, Convolutional Nets and Stacked Denoising Autoencoders.

For a quick introduction to neural nets, please see our overview.

There are a lot of knobs to turn when you’re training a deep-learning network. We’ve done our best to explain them, so that Deeplearning4j can serve as a DIY tool for Java, Scala and Clojure programmers. If you have questions, please join our Google Group; for premium support, contact us at Skymind. ND4J is the Java scientific computing engine powering our matrix manipulations.

And you thought I write jargon laden prose. 😉

This both looks both exciting (as a technology) and challenging (as in needing accessible documentation).

Are you going to be “…turn[ing] their multiple knobs” over the holidays?

GitHub Repo

Tweets

#deeplearning4j @IRC

Google Group

I first saw this in a tweet by Gregory Piatetsky.

The Ethics of Sarcastic Science

Filed under: Humor — Patrick Durusau @ 9:25 am

The Ethics of Sarcastic Science by Rose Eveleth.

From the post:

Every holiday season, the British Medical Journal puts out a special Christmas issue. It’s full of papers, as usual, but they’re all a little bit different. They’re jokes. Not fake—the data presented in these BMJ articles aren’t made up—but the premises of the papers are all a bit off-kilter. This year, for example, they showed that men die earlier than women because they’re stupid.

The BMJ has been loosening its ties every Christmas now for 30 years. In that time it has amassed a fair amount of odd little bits of science. But a recent paper on the subject of joke papers, by Lawrence Souder and his co-author Maryam Ronagh, questions whether these wacky studies are all in good fun, or whether there’s a darker side here. Ultimately, they argue that once the laughs have worn off, spoof papers can actually do damage to science.

Souder’s paper focuses on one case in particular. In 2001, Leonardo Leibovici published a paper titled “Effects of remote, retroactive intercessory prayer on outcomes in patients with bloodstream infection: Randomised controlled trial.” The study purported to show “whether remote, retroactive intercessory prayer, said for a group of patients with a bloodstream infection, has an effect on outcomes.” The study was farcical—the prayers they said for these patients were delivered between four and 10 years after their hospitalization. In some cases these prayers were said for them after they had already died. The reasoning for this, Leibovici explained, was that “we cannot assume a priori that time is linear, as we perceive it, or that God is limited by a linear time, as we are.”

Leibovici’s paper was one of many of BMJ’s Christmas spoofs, appearing in the journal alongside other joke articles. But eight years later the paper was cited, unironically, in a review paper from a well-respected organization.

In the Leibovici case, the authors critical of the humor issue are reaching to find an ethical issue. In fact, the article that cited Leibovici concludes:

These findings are equivocal and, although some of the results of individual studies suggest a positive effect of intercessory prayer, the majority do not and the evidence does not support a recommendation either in favour or against the use of intercessory prayer. We are not convinced that further trials of this intervention should be undertaken and would prefer to see any resources available for such a trial used to investigate other questions in health care.

Another “ethical” objection was that “insider” jokes exclude some people. No doubt, but the people excluded by the post-illness prayers example are unlikely to benefit from a clearer explanation. Or find the original article humorous.

I appreciate the posting because I was unaware of the BMJ‘s annual Christmas issue. I shall now enter on my calendar as a recurring annual event.

thebmj, you have to see this, it is a real hoot!

Enjoy!

December 23, 2014

Cause And Effect:…

Filed under: Philosophy,Philosophy of Science — Patrick Durusau @ 8:50 pm

Cause And Effect: The Revolutionary New Statistical Test That Can Tease Them Apart

From the post:

…But in the last few years, statisticians have begun to explore a number of ways to solve this problem. They say that in certain circumstances it is indeed possible to determine cause and effect based only on the observational data.

At first sight, that sounds like a dangerous statement. But today Joris Mooij at the University of Amsterdam in the Netherlands and a few pals, show just how effective this new approach can be by applying it to a wide range of real and synthetic datasets. Their remarkable conclusion is that it is indeed possible to separate cause and effect in this way.

Mooij and co confine themselves to the simple case of data associated with two variables, X and Y. A real-life example might be a set of data of measured wind speed, X, and another set showing the rotational speed of a wind turbine, Y.

These datasets are clearly correlated. But which is the cause and which the effect? Without access to a controlled experiment, it is easy to imagine that it is impossible to tell.

The basis of the new approach is to assume that the relationship between X and Y is not symmetrical. In particular, they say that in any set of measurements there will always be noise from various cause. The key assumption is that the pattern of noise in the cause will be different to the pattern of noise in the effect. That’s because any noise in X can have an influence on Y but not vice versa.

At some eighty-three (83) pages, this is going to take a while to digest. One of the reasons for mentioning it as a couple of holidays approach in many places.

I don’t think the authors are using “cause and effect” in the same sense as Hume and Ayer but that remains to be seen. Just skimming the first few pages, this is going to be an interesting read.

The post is based on:

Distinguishing cause from effect using observational data: methods and benchmarks by Joris M. Mooij, Jonas Peters, Dominik Janzing, Jakob Zscheischler, and Bernhard Schöt;lkopf.

Abstract:

The discovery of causal relationships from purely observational data is a fundamental problem in science. The most elementary form of such a causal discovery problem is to decide whether X causes Y or, alternatively, Y causes X, given joint observations of two variables X, Y . This was often considered to be impossible. Nevertheless, several approaches for addressing this bivariate causal discovery problem were proposed recently. In this paper, we present the benchmark data set CauseEffectPairs that consists of 88 different “cause-effect pairs” selected from 31 datasets from various domains. We evaluated the performance of several bivariate causal discovery methods on these real-world benchmark data and on artificially simulated data. Our empirical results provide evidence that additive-noise methods are indeed able to distinguish cause from effect using only purely observational data. In addition, we prove consistency of the additive-noise method proposed by Hoyer et al. (2009).

Thoughts and comments welcome!

Announcing Digital Pedagogy in the Humanities: Concepts, Models, and Experiments

Filed under: Humanities,Learning,Teaching — Patrick Durusau @ 8:26 pm

Announcing Digital Pedagogy in the Humanities: Concepts, Models, and Experiments by Rebecca Frost Davis.

From the post:

I’m elated today to announce, along with my fellow editors, Matt Gold, Katherine D. Harris, and Jentery Sayers, and in conjunction with the Modern Language Association Digital Pedagogy in the Humanities: Concepts, Models, and Experiments, an open-access, curated collection of downloadable, reusable, and remixable pedagogical resources for humanities scholars interested in the intersections of digital technologies with teaching and learning. This is a book in a new form. Taken as a whole, this collection will document the richly-textured culture of teaching and learning that responds to new digital learning environments, research tools, and socio-cultural contexts, ultimately defining the heterogeneous nature of digital pedagogy. You can see the full announcement here: https://github.com/curateteaching/digitalpedagogy/blob/master
/announcement.md

Many of you may have heard of this born-digital project under some other names (Digital Pedagogy Keywords) and hashtags (#digipedkit). Since it was born at the MLA convention in 2012 it has been continually evolving. You can trace that evolution, in part, through my earlier presentations: http://rebeccafrostdavis.wordpress.com/tag/curateteaching/

For the future, please follow Digital Pedagogy in the Humanities on Twitter through the hashtag #curateteaching and visit our news page for updates. And if you know of a great pedagogical artifact to share, please help us curate teaching by tweeting it to the hashtag #curateteaching. We’ll be building an archive of those tweets, as well.

After looking at the list of keywords: Draft List of Keywords for Digital Pedagogy in the Humanities: Concepts, Models, and Experiments, I am hopeful those of you with a humanities background can suggest additional terms.

I didn’t see “topic maps” listed. 😉 Maybe that should be under Annotation? In any event, this looks like an exciting project.

Enjoy!

20 new data viz tools and resources of 2014

Filed under: Graphics,Visualization — Patrick Durusau @ 8:07 pm

20 new data viz tools and resources of 2014

From the post:

We continue our special posts with the best data viz related content of the year, with a useful list of new tools and resources that were made available throughout 2014. A pretty straightforward compilation that was much harder to produce than initially expected, we must say, since the number of mentions to include was way beyond our initial (poorly made) estimates. So many new options out there!

So, we had a hard time gathering 20 of those new platforms, tools and resources – if you’re a frequent reader of our weekly Data Viz News posts, you’ll might recall several of the mentions in this list, -, and we deliberately left out the new releases, versions and updates of existing tools, such as CartoDB, Mapbox, Tableau, D3.js, RAW, Infogr.am and others.

Of course, there’s always Visualising Data’s list of 250+ tools and resources for a much broader view of what’s available out there.

For now, here are the new resources and tools that caught our attention in 2014:

Kudos to Visualizing Data for doing the heavy lifting on this one. A site I need to follow in the coming year.

Did North Korea Really Attack Sony?

Filed under: Cybersecurity,Security — Patrick Durusau @ 7:49 pm

Did North Korea Really Attack Sony? by Bruce Schneier.

From the post:

I am deeply skeptical of the FBI’s announcement on Friday that North Korea was behind last month’s Sony hack. The agency’s evidence is tenuous, and I have a hard time believing it. But I also have trouble believing that the U.S. government would make the accusation this formally if officials didn’t believe it.

Clues in the hackers’ attack code seem to point in all directions at once. The FBI points to reused code from previous attacks associated with North Korea, as well as similarities in the networks used to launch the attacks. Korean language in the code also suggests a Korean origin, though not necessarily a North Korean one since North Koreans use a unique dialect. However you read it, this sort of evidence is circumstantial at best. It’s easy to fake, and it’s even easier to interpret it wrong. In general, it’s a situation that rapidly devolves into storytelling, where analysts pick bits and pieces of the “evidence” to suit the narrative they already have worked out in their heads.

I appreciate Bruce linking the haste to blame North Korea to a similar haste on weapons of mass destruction in Iraq. (see also my: Sony, North Korea and WMDs.)

The other interesting point is the mistake on using a standard Korean keyboard, which would not be available in North Korea. The sort of mistake that someone trying to blame North Korea for the attack might make. Can you think of any ham-handed agencies in the United States capable of such clumsiness?

I hope more will become “known” but once the news cycle dies down, the lack of any resolution will pass unnoticed. And why press a weak case? In the public’s mind, North Korea attacked Sony, what more is there to accomplish?

Bruce’s honesty as a technical expert puts him at a disadvantage vis-a-vis the government. Technical correctness, facts, evidence, basic honesty are nice to haves for government sources, but not really necessary.

Hot Cloud Swap: Migrating a Database Cluster with Zero Downtime

Filed under: Cloud Computing,FoundationDB,NoSQL — Patrick Durusau @ 7:23 pm

Hot Cloud Swap: Migrating a Database Cluster with Zero Downtime by Jennifer Rullmann.

By now, you may have heard about, seen, or even tried your hand against the fault tolerance of our database. The Key-Value Store, and the layers that turn it into a multi-model database, handle a wide variety of disasters with ease. In this real-time demo video, we show off the ability to migrate a cluster to a new set of machines with zero downtime.

fdb_image_rush

We’re calling this feature ‘hot cloud swap’, because although you can use it on your own machines, it’s particularly interesting to those who run their database in the cloud and may want to switch providers. And that’s exactly what I do in the video. Watch me migrate a database cluster from Digital Ocean to Amazon Web Services in under 7 minutes, real-time!

Its been years but I can remember as a sysadmin switching out “hot swapable” drives. Never lost any data but there was always that moment of doubt during the rebuild.

Personally I would have more than one complete and tested backups, to the extent that is possible, before trying a “hot cloud swap.” That may be overly cautious but better cautious than crossing into the “Sony Zone.”

At one point Jennifer says:

“…a little bit of hesitation but it worked it out.”

Difficult to capture but if you look at time marker 06.52.85 on the clock below the left hand window, writes start failing.

It recovers but it is not the case that the application never stops. At least in the sense of writes. Depends on your definition of “stops” I suppose.

I am sure that the fault tolerance build into FoundationDB made this less scary but the “hot swap” part should be doable with any clustering solution. Yes?

That is you add “new” machines to the cluster, then exclude the “old” machines from the cluster, which results in a complete transfer of data to the “new” machines, at which point you create new coordinators, exclude the “old” machines from the cluster and then eventually you close the “old” machines. Is there something unique about that process to FoundationDB?

Don’t get me wrong, I am hoping to learn a great deal more about FoundationDB in the new year but I intensely dislike distinctions between software packages that have no basis in fact.

Sam Aaron – Cognicast Episode 069

Filed under: Functional Programming,Music,Programming,Sound — Patrick Durusau @ 5:04 pm

067-sam-aaron

From the webpage:

In this episode, we talk to Sam Aaron, programmer, educator and musician.

Our Guest, Sam Aaron

Music

Sam is sharing original music he composed using Sonic Pi. To start the show, he chose “Time Machine”. To end the show, he chose “Goodbyes”.

Topics

Subscribing to The Cognicast

The show is available on iTunes! You can also subscribe to the podcast using our podcast feed.

A great perspective on getting people interested in coding, which should be transferable to topic maps. Yes?

Although, I must admit I almost raised my hand when Aaron asked “…who has had fun with sorting?” Well, some people have different interests. 😉

A very enjoyable podcast! I will have to look at prior episodes to see what else I have missed!

PS: What would it take to make the topic map equivalent of Sonic Pi? Taking note of Aaron’s comments on “friction.”

U.S. Congressional Documents and Debates (1774-1875)

Filed under: Government,History,Law,Law - Sources,Legal Informatics — Patrick Durusau @ 4:35 pm

U.S. Congressional Documents and Debates (1774-1875) by Barbara Davis and Robert Brammer (law library specialists at the Library of Congress).

A video introduction to the website A Century of Lawmaking For a New Nation.

I know you are probably wondering why I would post on this resource considering that I just posted on finding popular topics for topic maps! 😉

Popularity, beyond social media popularity, is in the eye of the beholder. This sort of material would appeal to anyone who debates the “intent” of the original framers of the constitution, the American Enterprise Institute for example.

Justice Justice Scalia would be another likely consumer of a topic map based on these materials. He advocates what Wikipedia calls “…textualism in statutory interpretation and originalism in constitutional interpretation.”

Put anyone seeking to persuade Justice Scalia of their cause, is another likely consumer for such a topic map. Or prospective law clerks for that matter. Tying this material to Scalia’s opinions and other writings would increase the value of such a map.

The topic mapping theory part would be fun but imaging Scalia solving the problem of other minds and discerning their intent over two hundred (200) years later would require more imagination than I can muster on most days.

5 Ways to Find Trending Topics (Other than Twitter)

Filed under: Marketing,Topic Maps — Patrick Durusau @ 3:52 pm

5 Ways to Find Trending Topics (Other than Twitter) by Elisabeth Michaud.

From the post:

Like every community or social media manager, one type of social media content you’re likely to share is posts that play on what’s happening in the world– the trends of the day, week, or month. To find content for these posts, many of you are probably turning to Twitter’s Trending Topics–that friendly little section on the left-hand side of your browser when you visit Twitter.com, and something that can be personalized (or not) to what Twitter thinks you’ll be most interested in.

We admit that Trending Topics are pretty handy when it comes to inspiring content, but it’s also the same place EVERY. OTHER. BRAND (and probably your competitors) is looking for content ideas. Boring! Today, we’ve got 5 other places you can look for trending stories to inspire you.

Not recent but I think Elisabeth’s tips bear repeating. At least if you are interested in creating popular topic maps. That is topic maps that maybe of interest to someone other than yourself. 😉

I still aspire to create a topic map of the Chicago Assyrian Dictionary by using Tesseract to extract the text from image based PDF, etc. but the only buyers for that item would be me and the folks at the Oriental Archives at the University of Chicago. Maybe a few others but not something you want to bet the rent on.

Beyond Elisabeth’s suggestions, which are all social media, I would suggest you also monitor:

CNN

Guardian (UK edition)

New York Times

Spiegel Online International

The Wall Street Journal

To see if you can pick up trends in stories there as well.

The biggest problem with news channels being that stories blow hot and cold and it isn’t possible to know ahead of time which ones will last (like the Michael Brown shooting) and which ones are doing to be dropped like a hot potato (CIA torture report).

One suggestion would be to create a TWitter account to follow some representative sample of main news outlets and keep a word count, excluding noise words, on a weekly and monthly basis. Anything that spans more than a week, is likely to be a persistent topic of interest. At least to someone.

And when something flares up in social media, you can track it there as well. Like #gamergate. Where are you going to find a curated archive of all the tweets and other social media messages on that topic? Where you can track the principals, aggregate content, etc.? You could search for that now but I suspect some of it is already missing or edited.

The ultimate question is not whether topic maps as a technology are popular but rather do topic maps deliver a value-add for information that is of interest to others?

Is that a Golden Rule (A rule that will make you some gold.)?

Provide unto others the information they want

PS: Don’t confuse “provide” with “give.” The economic model for “providing” is your choice.

Deep Learning: Doubly Easy and Doubly Powerful with GraphLab Create

Filed under: Deep Learning,GraphLab — Patrick Durusau @ 3:08 pm

Deep Learning: Doubly Easy and Doubly Powerful with GraphLab Create by Piotr Teterwak.

From the post:

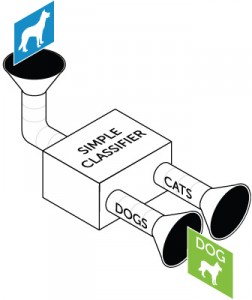
One of machine learning’s core goals is classification of input data. This is the task of taking novel data and assigning it to one of a pre-determined number of labels, based on what the classifier learns from a training set. For instance, a classifier could take an image and predict whether it is a cat or a dog.

dl_simpleclassifier

The pieces of information fed to a classifier for each data point are called features, and the category they belong to is a ‘target’ or ‘label’. Typically, the classifier is given data points with both features and labels, so that it can learn the correspondence between the two. Later, the classifier is queried with a data point and the classifier tries to predict what category it belongs to. A large group of these query data-points constitute a prediction-set, and the classifier is usually evaluated on its accuracy, or how many prediction queries it gets correct.

Despite a slow start, the post moves onto deep learning and GraphLab Create in detail, with code. You will need the GPU version of GraphLab Create to get the full benefit of this post.

Beyond distinguishing dogs and cats, a concern for other dogs and cats I’m sure, what images would you classify with deep learning?

I first saw this in a tweet by Aapo Kyrola

The Sense of Style [25 December 2014 – 10 AM – C-SPAN2]

Filed under: Language,Writing — Patrick Durusau @ 2:03 pm

Steve Pinker discussing his book The Sense of Style: The Thinking Person’s Guide to Writing in the 21st Century.

From the description:

Steven Pinker talked about his book, The Sense of Style: The Thinking Person’s Guide to Writing in the 21st Century, in which he questions why so much of our writing today is bad. Professor Pinker said that while texting and the internet are blamed for developing bad writing habits, especially among young people, good writing has always been a difficult task.

The transcript, made for closed captioning, will convince you of the power of paragraphing if you attempt to read it. I may copy it, watch the lecture Christmas morning, insert paragraphing and ask CSPAN if they would like a corrected copy. 😉

One suggestion for learning to write (like learning to program), that I have heard but never followed, is to type out text written by known good writers. As you probably suspect, my excuse is a lack of time. Perhaps that will be a New Year’s resolution for the coming year.

Becoming a better writer automatically means you will be communicating better with your audience. For some of us that may be a plus or a negative. You have been forewarned.

Enjoy!


In case you miss the broadcast, I found the video archive of the presentation. Nothing that will startle you but Pinker is an entertaining speaker.

I am watching the video early and Pinker points out an “inherent problem in the design of language.” [paraphrasing] We hold knowledge in a semantic network in our brains but when we use language to communicate some piece of that knowledge, the order of words in a sentence has to do two things at once:

* Serve as a code for meaning (who did what to whom)

* Present some bits of information to the reader before others (affects how the information is absorbed)

Pinker points out that passive voice allows better prose. Focus remains on the subject. (Is prevalent in bad prose but Pinker argues that is due to the curse of knowledge.)

Question: Do we need a form of passive voice in computer languages? What would that look like?

« Newer PostsOlder Posts »

Powered by WordPress